- Abingdon properties for sale
- Alpha properties for sale
- Cedar properties for sale
- Copley properties for sale
- Dahinda properties for sale
- East Galesburg properties for sale
- Galesburg properties for sale
- Galesburg City properties for sale
- Henderson Township properties for sale
- Knox properties for sale
- Knoxville properties for sale
- New Windsor properties for sale
- Oak Run properties for sale
- Oxford properties for sale
- Persifer properties for sale
- Rio properties for sale
- Rio Township properties for sale
- Rivoli properties for sale
- Wataga properties for sale
- Windsor properties for sale
61488, IL - homes for sale
6 of 6 results displayed
 $254,900Active3.19 Acres
2260 Knox Rd 600 E, Wataga, IL 61488
MLS# CA1040162Listed by: PLATINUM KEY REAL ESTATE, LLC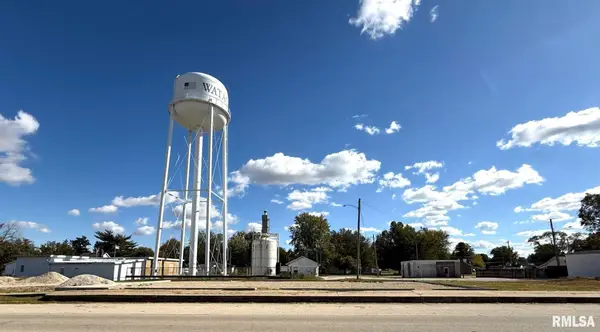 $90,000Active0 Acres
126 N Depot Street, Wataga, IL 61488
MLS# CA1040002Listed by: PLATINUM KEY REAL ESTATE, LLC $12,000Active0 Acres
237 N Union Street, Wataga, IL 61488
MLS# CA1040003Listed by: PLATINUM KEY REAL ESTATE, LLC $254,900Active3 beds 2 baths2,059 sq. ft.
2260 Knox Rd 600 E, Wataga, IL 61488
MLS# CA1040004Listed by: PLATINUM KEY REAL ESTATE, LLC $10,000Active0 Acres
500 E Victoria Street, Wataga, IL 61488
MLS# CA1040005Listed by: PLATINUM KEY REAL ESTATE, LLC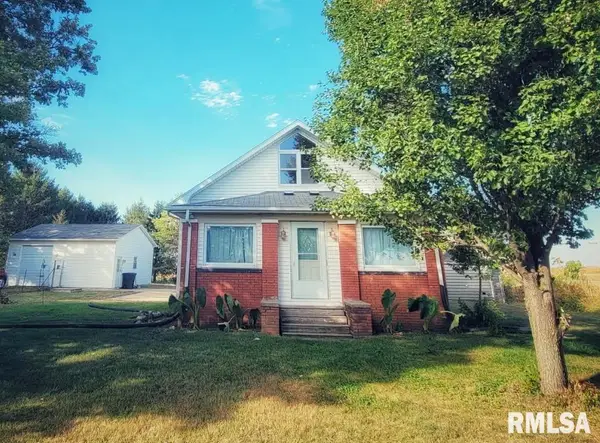
 $114,900Active2 beds 2 baths1,417 sq. ft.
593 Knox Rd 2000 N Road, Wataga, IL 61488
MLS# CA1038893Listed by: CENTURY 21 TUCKER SWANSON
Local realty services provided by:CENTURY 21 Broughton Team
Popular searches near 61488
Popular neighborhoods near 61488
- Blackhawk, Rock Island properties for sale
- Central Rock Island, Rock Island properties for sale
- East Central, Rock Island properties for sale
- Forest Hill, Moline properties for sale
- Greater Prospect Area, Moline properties for sale
- Greater Tartan Oaks, Moline properties for sale
- Hamilton Heights, Moline properties for sale
- Karstens Park, Moline properties for sale
- Rock Riverfront, Rock Island properties for sale
- Rock Valley, Moline properties for sale
- Rockview Estates, Moline properties for sale
- Saukie, Rock Island properties for sale
- Shadybrook, Rock Island properties for sale
- South Rock, Coal Valley properties for sale
- Southwest, Rock Island properties for sale
- Stephens Park, Moline properties for sale
- Stewartville, Moline properties for sale
- Uptown Moline, Moline properties for sale
- Villa Park, Moline properties for sale
- Willard, Moline properties for sale
Counties near Wataga, 61488
- Bureau County properties for sale
- Des Moines County properties for sale
- Fulton County properties for sale
- Henderson County properties for sale
- Henry County properties for sale
- Knox County properties for sale
- Louisa County properties for sale
- Marshall County properties for sale
- McDonough County properties for sale
- Mercer County properties for sale
- Muscatine County properties for sale
- Peoria County properties for sale
- Putnam County properties for sale
- Rock Island County properties for sale
- Scott County properties for sale
- Stark County properties for sale
- Tazewell County properties for sale
- Warren County properties for sale
- Whiteside County properties for sale
- Woodford County properties for sale
©2025 Century 21 Real Estate LLC. All rights reserved. CENTURY 21®, the CENTURY 21 Logo and C21® are service marks owned by Century 21 Real Estate LLC. Century 21 Real Estate LLC fully supports the principles of the Fair Housing Act and the Equal Opportunity Act. Each office is independently owned and operated. Listing information is deemed reliable but not guaranteed accurate.
©2025 Century 21 Real Estate LLC. All rights reserved. CENTURY 21®, the CENTURY 21 Logo and C21® are service marks owned by Century 21 Real Estate LLC. Century 21 Real Estate LLC fully supports the principles of the Fair Housing Act and the Equal Opportunity Act. Each office is independently owned and operated. Listing information is deemed reliable but not guaranteed accurate.