- Auburndale, Auburndale homes for sale
- Bank Square, Waltham homes for sale
- Cliff Estates, Wellesley Hills homes for sale
- Dana Hall, Wellesley homes for sale
- Fells, Wellesley homes for sale
- Newton Centre, Newton Center homes for sale
- Newton Corner, Newton homes for sale
- Newton Highlands, Newton Highlands homes for sale
- Newton Upper Falls, Newton Upper Falls homes for sale
- Newtonville, Newtonville homes for sale
- Nonantum, Newton homes for sale
- Oak Hill, Newton Center homes for sale
- Oak Hill Park, Newton Center homes for sale
- Southside, Waltham homes for sale
- The Bleachery, Waltham homes for sale
- Thompsonville, Newton Center homes for sale
- Waban, Newton Lower Falls homes for sale
- Wellesley Hills, Wellesley Hills homes for sale
- West Newton, West Newton homes for sale
- Woodlands, Wellesley homes for sale
Wellesley Farms, Wellesley Hills, MA - homes for sale
9 of 9 results displayed
- New
 $1,195,000Active2 beds 2 baths1,224 sq. ft.
63 Garden Road #G2, Wellesley, MA 02481
MLS# 73492717Listed by: Coldwell Banker Realty - Wellesley - New
 $1,350,000Active3 beds 3 baths2,127 sq. ft.
16 Intervale Road, Wellesley, MA 02481
MLS# 73491922Listed by: Coldwell Banker Realty - Wellesley - Open Thu, 4 to 5:30pm
 $4,895,000Active6 beds 4 baths7,404 sq. ft.
10 Lanark Rd, Wellesley, MA 02481
MLS# 73488699Listed by: Coldwell Banker Realty - Wellesley 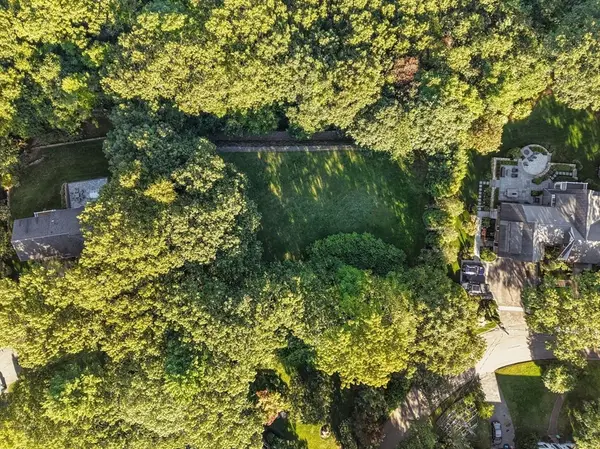 $1,995,000Active0.51 Acres
33 Boulder Rd, Wellesley, MA 02481
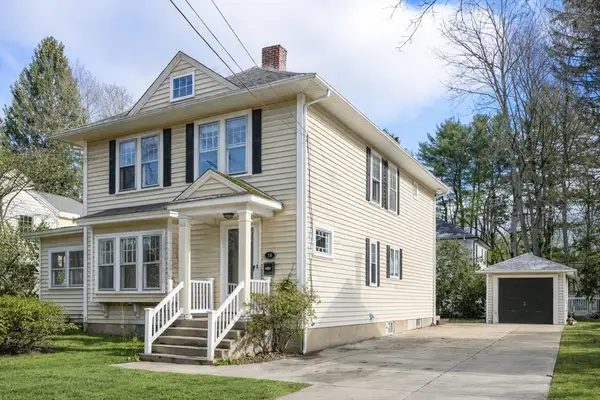
MLS# 73482797Listed by: Rutledge Properties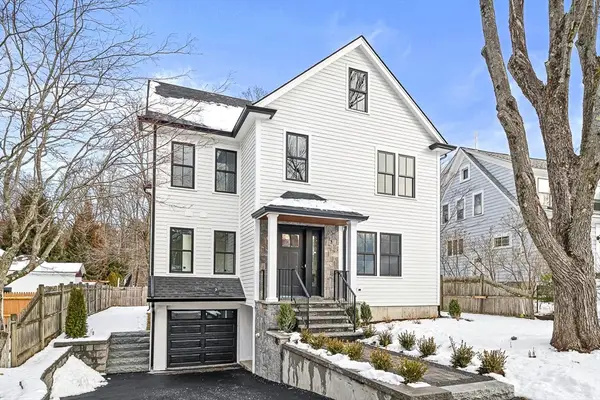 $2,350,000Active5 beds 5 baths3,200 sq. ft.
6 Intervale Rd, Wellesley, MA 02481
MLS# 73482833Listed by: Compass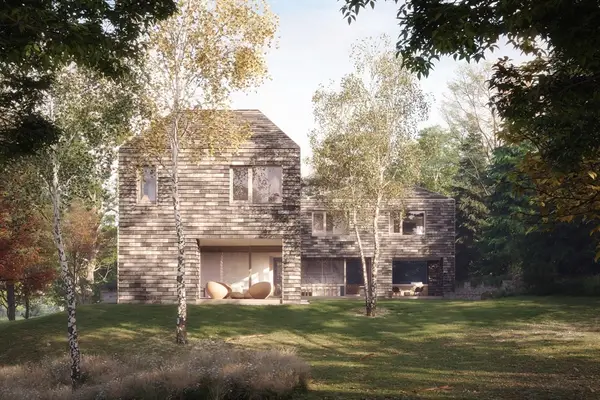 $12,250,000Active5 beds 6 baths7,200 sq. ft.
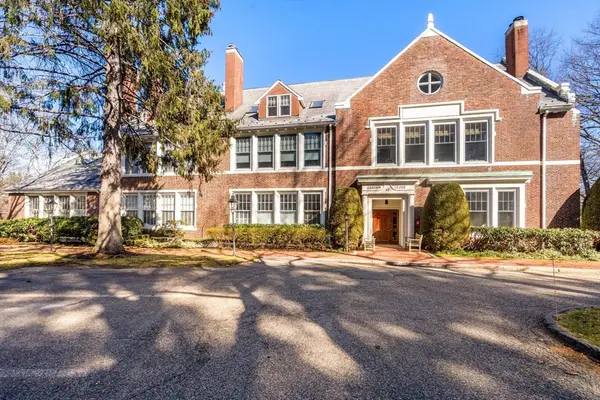
45 White Oak Road, Wellesley, MA 02481
MLS# 73475355Listed by: Northeast Development & Investment, Inc. $5,250,000Active5 beds 8 baths7,720 sq. ft.
3 Ravine Rd, Wellesley, MA 02481
MLS# 73427630Listed by: Coldwell Banker Realty - Wellesley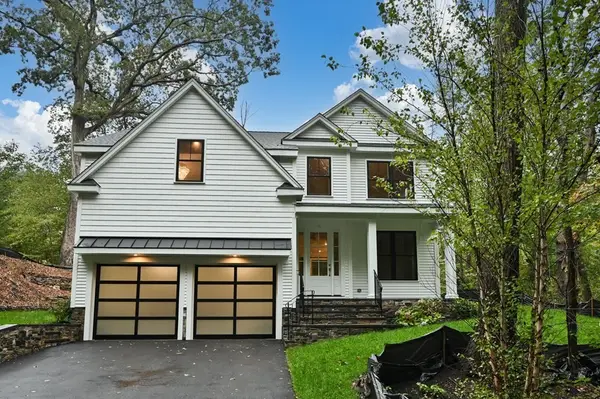 $2,799,900Active5 beds 4 baths4,090 sq. ft.
Lot A The Water Way, Wellesley, MA 02481
MLS# 73161711Listed by: Realty Associates $5,799,900Active6 beds 8 baths7,818 sq. ft.
Lot B Hundreds Road, Wellesley, MA 02481
MLS# 73098469Listed by: Realty Associates
Local realty services provided by:CENTURY 21 The Real Estate Group
Popular neighborhoods near Wellesley Farms, Wellesley Hills, MA
Counties near Wellesley Farms, Wellesley Hills, MA
- Barnstable County homes for sale
- Bristol County homes for sale
- Bristol County homes for sale
- Cheshire County homes for sale
- Essex County homes for sale
- Franklin County homes for sale
- Hillsborough County homes for sale
- Kent County homes for sale
- Middlesex County homes for sale
- Newport County homes for sale
- Norfolk County homes for sale
- Northeastern Connecticut County homes for sale
- Plymouth County homes for sale
- Providence County homes for sale
- Rockingham County homes for sale
- Suffolk County homes for sale
- Tolland County homes for sale
- Washington County homes for sale
- Windham County homes for sale
- Worcester County homes for sale
Protect your home and budget from life's surprises with an Assurant Home Warranty, backed by a partner that supports you through every step of homeownership. Explore Plans.
©2026 Century 21 Real Estate LLC. All rights reserved. CENTURY 21®, the CENTURY 21 Logo and C21® are service marks owned by Century 21 Real Estate LLC. Century 21 Real Estate LLC fully supports the principles of the Fair Housing Act and the Equal Opportunity Act. Each office is independently owned and operated. Listing information is deemed reliable but not guaranteed accurate.