- Angell, Muskegon properties for sale
- Bayside, Traverse City properties for sale
- Boardman, Traverse City properties for sale
- Central, Traverse City properties for sale
- Downtown, Traverse City properties for sale
- East Muskegon, Muskegon properties for sale
- Jackson Hill, Muskegon properties for sale
- Marquette, Muskegon properties for sale
- Marsh Field, Muskegon properties for sale
- McLaughlin, Muskegon properties for sale
- Muskegon Heights, Muskegon Heights properties for sale
- Nelson, Muskegon properties for sale
- Nims, Muskegon properties for sale
- Oak Park, Traverse City properties for sale
- Oakview, Muskegon properties for sale
- Sheldon Park, Muskegon properties for sale
- Slabtown, Traverse City properties for sale
- Steele, Muskegon properties for sale
- Traverse Heights, Traverse City properties for sale
- Village at Chartwell, Traverse City properties for sale
Wellston, MI - homes for sale
12 of 12 results displayed
 $12,000Active0.25 Acres
V/L 0.25A Main Street, Wellston, MI 49689
MLS# 201837999Listed by: EXP REALTY, LLC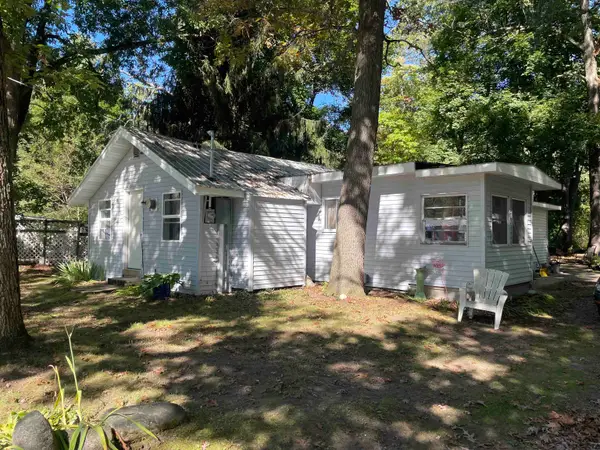 $90,000Pending2 beds 1 baths974 sq. ft.
17068 Seventh ST, Wellston, MI 49689
MLS# 78080063009Listed by: COLDWELL BANKER SCHMIDT-CADILLAC
 $90,000Pending2 beds 1 baths974 sq. ft.
17068 Seventh #Lot: 24, 25, Wellston, MI 49689
MLS# 80063009Listed by: COLDWELL BANKER SCHMIDT-CADILLAC $17,000Active1.36 Acres
Lots 1-9 Cranberry Street, Wellston, MI 49689
MLS# 25053334Listed by: ESSENTIAL REAL ESTATE $149,900Active2 beds 1 baths850 sq. ft.
17423 Spring Street, Wellston, MI 49689
MLS# 25052981Listed by: ESSENTIAL REAL ESTATE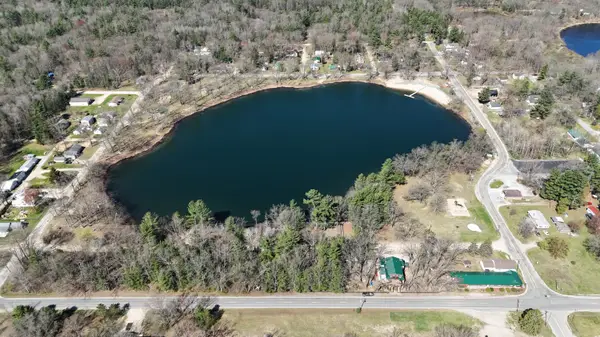 $28,000Active0.51 Acres
Main Street, Wellston, MI 49689
MLS# 25052577Listed by: ESSENTIAL REAL ESTATE $95,000Active2 beds 1 baths1,120 sq. ft.
16920 6th Street, Wellston, MI 49689
MLS# 25051561Listed by: ESSENTIAL REAL ESTATE $10,000Active0.62 Acres
V/l Marion Street, Wellston, MI 49689
MLS# 25007197Listed by: FIVE STAR REAL ESTATE WHITEHALL $10,000Active0.62 Acres
V/l Marion, Wellston, MI 49689
MLS# 70453857Listed by: FIVE STAR REAL ESTATE WHITEHALL $154,000Pending2 beds 1 baths937 sq. ft.
17111 Gene Street, Wellston, MI 49689
MLS# 25005278Listed by: CITY2SHORE PORT CITY ASSOCIATES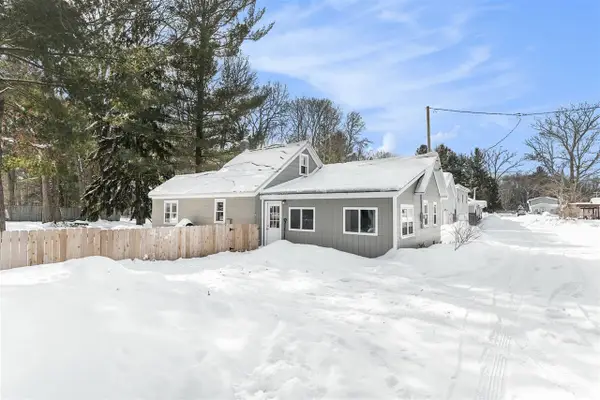 $154,000Pending2 beds 1 baths937 sq. ft.
17111 Gene, Wellston, MI 49689
MLS# 70451931Listed by: CITY2SHORE PORT CITY ASSOCIATES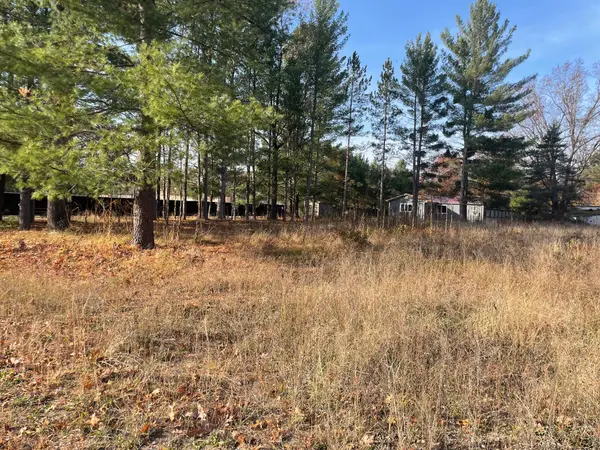 $22,500Active0.22 Acres
V/L Spring Street, Wellston, MI 49689
MLS# 24057048Listed by: BIG RIVER PROPERTIES
Local realty services provided by:CENTURY 21 Realty North, CENTURY 21 Affiliated, CENTURY 21 Northland, CENTURY 21 White House Realty
All information deemed reliable but not guaranteed and should be
independently verified. All properties are subject to prior sale, change
or withdrawal. Neither the listing broker(s) nor Water Wonderland Mls, Inc. shall be
responsible for any typographical errors, misinformation, misprints,
and shall be held totally harmless. Water Wonderland MLS, Inc © 2025 All
rights reserved
Neighborhoods near Wellston, MI
Zip codes near Wellston, MI
- 49304 properties for sale
- 49402 properties for sale
- 49405 properties for sale
- 49410 properties for sale
- 49411 properties for sale
- 49613 properties for sale
- 49614 properties for sale
- 49619 properties for sale
- 49620 properties for sale
- 49625 properties for sale
- 49626 properties for sale
- 49638 properties for sale
- 49644 properties for sale
- 49645 properties for sale
- 49656 properties for sale
- 49660 properties for sale
- 49668 properties for sale
- 49675 properties for sale
- 49683 properties for sale
- 49689 properties for sale
Popular searches near Wellston, MI
- Bear Lake Township properties for sale
- Brethren properties for sale
- Brown properties for sale
- Dickson properties for sale
- Eden properties for sale
- Elk properties for sale
- Free Soil properties for sale
- Free Soil township properties for sale
- Harrietta properties for sale
- Irons properties for sale
- Kaleva properties for sale
- Maple Grove properties for sale
- Marilla properties for sale
- Meade properties for sale
- Norman Township properties for sale
- Peacock properties for sale
- Sauble properties for sale
- Sheridan properties for sale
- Slagle properties for sale
- Stronach Township properties for sale
©2025 Century 21 Real Estate LLC. All rights reserved. CENTURY 21®, the CENTURY 21 Logo and C21® are service marks owned by Century 21 Real Estate LLC. Century 21 Real Estate LLC fully supports the principles of the Fair Housing Act and the Equal Opportunity Act. Each office is independently owned and operated. Listing information is deemed reliable but not guaranteed accurate.
©2025 Century 21 Real Estate LLC. All rights reserved. CENTURY 21®, the CENTURY 21 Logo and C21® are service marks owned by Century 21 Real Estate LLC. Century 21 Real Estate LLC fully supports the principles of the Fair Housing Act and the Equal Opportunity Act. Each office is independently owned and operated. Listing information is deemed reliable but not guaranteed accurate.