- Adams, Los Angeles homes for sale
- Angelus Vista, Los Angeles homes for sale
- Arlington Heights, Los Angeles homes for sale
- Arlington Heights Terrace, Los Angeles homes for sale
- Arlington Park, Los Angeles homes for sale
- Country Club Park, Los Angeles homes for sale
- Exposition Park West, Los Angeles homes for sale
- Harvard Heights, Los Angeles homes for sale
- Jefferson Park, Los Angeles homes for sale
- King Estates, Los Angeles homes for sale
- Lafayette Square, Los Angeles homes for sale
- Leimert Park, Los Angeles homes for sale
- Longwood Highlands, Los Angeles homes for sale
- Olympic Park, Los Angeles homes for sale
- Oxford Square, Los Angeles homes for sale
- Victoria Park, Los Angeles homes for sale
- Wellington Square, Los Angeles homes for sale
- West Adams Heights, Los Angeles homes for sale
- Western Heights, Los Angeles homes for sale
- Wilshire Park, Los Angeles homes for sale
West Adams Terrace, Los Angeles, CA - homes for sale
7 of 7 results displayed

 $1,295,000Active5 beds 4 baths3,207 sq. ft.
2546 S Bronson, Los Angeles, CA 90018
MLS# CV26031321Listed by: CENTURY 21 EXPERIENCE- Open Sat, 12 to 2pm
 $1,374,990Active6 beds 3 baths2,531 sq. ft.
2410 8th Avenue, Los Angeles, CA 90018
MLS# TR25264873Listed by: CENTURY 21 MASTERS  $1,019,500Active3 beds 2 baths1,442 sq. ft.
2415 8th Avenue, Los Angeles, CA 90018
MLS# CL25616767Listed by: BERKSHIRE HATHAWAY HOMESERVICES CALIFORNIA PROPERTIES $1,300,000Active4 beds 3 baths1,722 sq. ft.
2511 S 11th Avenue, Los Angeles, CA 90018
MLS# OC25252267Listed by: WETRUST REALTY $1,700,000Active5 beds 5 baths
2510 3rd Avenue, Los Angeles, CA 90018
MLS# PV25175287Listed by: HARCOURTS HUNTER MASON REALTY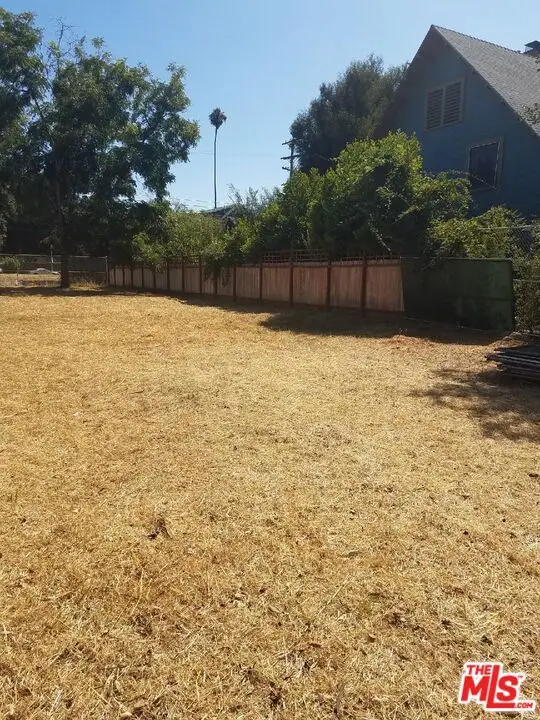 $575,000Active0.14 Acres
2154 W 24th Street, Los Angeles, CA 90018
MLS# CL25565313Listed by: KC LENDING, INC.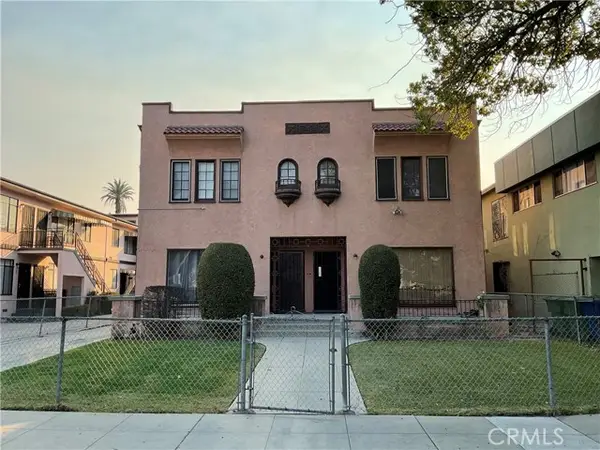 $1,125,000Pending5 beds -- baths4,151 sq. ft.
2326 W 24th Street, Los Angeles, CA 90018
MLS# CRRS25014439Listed by: ALL CITY REALTY
Local realty services provided by:CENTURY 21 Century Real Estate, CENTURY 21 Sierra Properties, CENTURY 21 Affiliated
The information being provided by California Regional MLS (Southern California) is for the consumer's personal, non-commercial use and may not be used for any purpose other than to identify prospective properties consumer may be interested in purchasing. Any information relating to real estate for sale referenced on this web site comes from the Internet Data Exchange (IDX) program of the California Regional MLS (Southern California). CENTURY 21 Century Real Estate is not a Multiple Listing Service (MLS), nor does it offer MLS access. This website is a service of CENTURY 21 Century Real Estate, a broker participant of California Regional MLS (Southern California). This web site may reference real estate listing(s) held by a brokerage firm other than the broker and/or agent who owns this web site.
The accuracy of all information, regardless of source, including but not limited to open house information, square footages and lot sizes, is deemed reliable but not guaranteed and should be personally verified through personal inspection by and/or with the appropriate professionals. The data contained herein is copyrighted by California Regional MLS (Southern California) and is protected by all applicable copyright laws. Any unauthorized dissemination of this information is in violation of copyright laws and is strictly prohibited.
Copyright 2021 California Regional MLS (Southern California). All rights reserved.
This information is deemed reliable but not guaranteed. You should rely on this information only to decide whether or not to further investigate a particular property. BEFORE MAKING ANY OTHER DECISION, YOU SHOULD PERSONALLY INVESTIGATE THE FACTS (e.g. square footage and lot size) with the assistance of an appropriate professional. You may use this information only to identify properties you may be interested in investigating further. All uses except for personal, non-commercial use in accordance with the foregoing purpose are prohibited. Redistribution or copying of this information, any photographs or video tours is strictly prohibited. This information is derived from the Internet Data Exchange (IDX) service provided by San Diego MLS®. Displayed property listings may be held by a brokerage firm other than the broker and/or agent responsible for this display. The information and any photographs and video tours and the compilation from which they are derived is protected by copyright. Compilation © 2020 San Diego MLS®, Inc.
Popular neighborhoods near West Adams Terrace, Los Angeles, CA
Zip codes near West Adams Terrace, Los Angeles, CA
- 90004 homes for sale
- 90005 homes for sale
- 90006 homes for sale
- 90007 homes for sale
- 90008 homes for sale
- 90010 homes for sale
- 90015 homes for sale
- 90016 homes for sale
- 90017 homes for sale
- 90018 homes for sale
- 90019 homes for sale
- 90020 homes for sale
- 90035 homes for sale
- 90036 homes for sale
- 90037 homes for sale
- 90038 homes for sale
- 90043 homes for sale
- 90048 homes for sale
- 90057 homes for sale
- 90062 homes for sale
Counties near West Adams Terrace, Los Angeles, CA
Protect your home and budget from life's surprises with an Assurant Home Warranty, backed by a partner that supports you through every step of homeownership. Explore Plans.
©2026 Century 21 Real Estate LLC. All rights reserved. CENTURY 21®, the CENTURY 21 Logo and C21® are service marks owned by Century 21 Real Estate LLC. Century 21 Real Estate LLC fully supports the principles of the Fair Housing Act and the Equal Opportunity Act. Each office is independently owned and operated. Listing information is deemed reliable but not guaranteed accurate.