- Ashburton, Baltimore homes for sale
- Callaway, Baltimore homes for sale
- Central Forest Park, Gwynn Oak homes for sale
- Dolfield, Baltimore homes for sale
- Dorchester, Gwynn Oak homes for sale
- East Arlington, Baltimore homes for sale
- Edmondson Village, Baltimore homes for sale
- Forest Park, Baltimore homes for sale
- Forest Park Golf Course, Gwynn Oak homes for sale
- Grove Park, Gwynn Oak homes for sale
- Hanlon, Baltimore homes for sale
- Howard Park, Gwynn Oak homes for sale
- Mount Holly, Baltimore homes for sale
- Northwest, Baltimore homes for sale
- Rognel Heights, Baltimore homes for sale
- Rosemont, Baltimore homes for sale
- Walbrook, Baltimore homes for sale
- West Arlington, Baltimore homes for sale
- West Hills, Baltimore homes for sale
- Windsor Hills, Baltimore homes for sale
West Forest Park, Gwynn Oak, MD - homes for sale
11 of 11 results displayed
- Coming Soon
 $149,999Coming Soon-- beds 1 baths
4204 Bonner, BALTIMORE, MD 21216
MLS# MDBA2208778Listed by: GW JONES AND ASSOCIATES 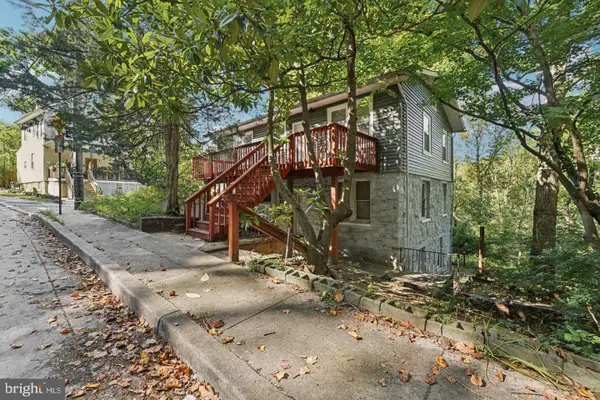 $400,000Active5 beds -- baths2,280 sq. ft.
4511 Prospect Cir, BALTIMORE, MD 21216
MLS# MDBA2206176Listed by: REAL BROKER, LLC - ANNAPOLIS $240,000Active3 beds 1 baths1,860 sq. ft.
4513 W Forest Park Ave, BALTIMORE, MD 21207
MLS# MDBA2205628Listed by: MARATHON REAL ESTATE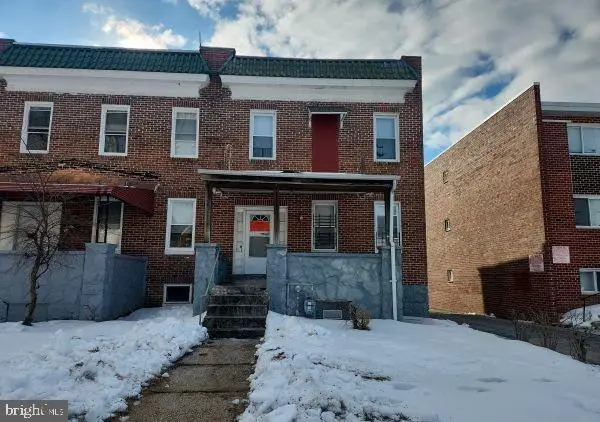 $90,000Active3 beds 2 baths1,616 sq. ft.
4169 Fairview Ave, BALTIMORE, MD 21216
MLS# MDBA2204502Listed by: CUMMINGS & CO. REALTORS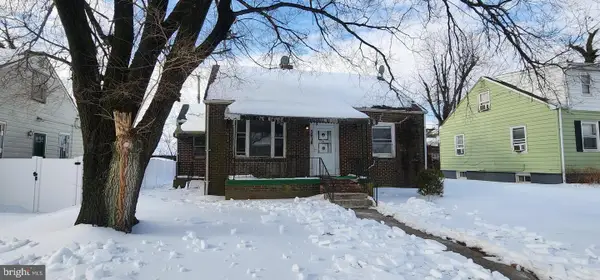 $147,000Active3 beds 2 baths1,405 sq. ft.
2918 Forest Glen Rd, BALTIMORE, MD 21216
MLS# MDBA2203698Listed by: YOUR REALTY INC. $285,000Active4 beds 4 baths1,464 sq. ft.
4114 Fairview Ave, BALTIMORE, MD 21216
MLS# MDBA2202914Listed by: FAIRFAX REALTY SELECT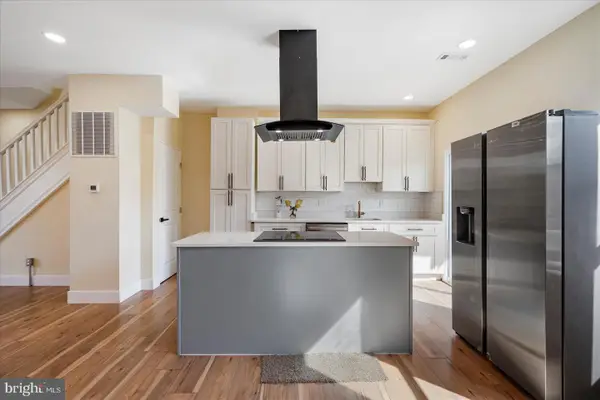 $219,900Active3 beds 2 baths1,524 sq. ft.
4121 Norfolk Ave, BALTIMORE, MD 21216
MLS# MDBA2199862Listed by: LPT REALTY, LLC $115,000Active3 beds 1 baths1,224 sq. ft.
4109 Norfolk Ave, BALTIMORE, MD 21216
MLS# MDBA2205536Listed by: KELLER WILLIAMS LEGACY $235,000Pending4 beds 2 baths1,340 sq. ft.
4119 Fairview Ave, BALTIMORE, MD 21216
MLS# MDBA2196606Listed by: FEATHERSTONE & CO.,LLC. $115,000Active3 beds 1 baths1,216 sq. ft.
4110 Norfolk Ave, BALTIMORE, MD 21216
MLS# MDBA2205574Listed by: KELLER WILLIAMS LEGACY $49,900Active1.05 Acres
4911 W Forest Park Ave, BALTIMORE, MD 21207
MLS# MDBA2174106Listed by: BERKSHIRE HATHAWAY HOMESERVICES HOMESALE REALTY
Local realty services provided by:CENTURY 21 Rauh & Johns
Popular neighborhoods near West Forest Park, Gwynn Oak, MD
Zip codes near West Forest Park, Gwynn Oak, MD
- 21201 homes for sale
- 21202 homes for sale
- 21207 homes for sale
- 21208 homes for sale
- 21209 homes for sale
- 21210 homes for sale
- 21211 homes for sale
- 21212 homes for sale
- 21213 homes for sale
- 21215 homes for sale
- 21216 homes for sale
- 21217 homes for sale
- 21218 homes for sale
- 21223 homes for sale
- 21227 homes for sale
- 21228 homes for sale
- 21229 homes for sale
- 21230 homes for sale
- 21231 homes for sale
- 21244 homes for sale
Counties near West Forest Park, Gwynn Oak, MD
- Alexandria city County homes for sale
- Anne Arundel County homes for sale
- Arlington County homes for sale
- Baltimore County homes for sale
- Baltimore city County homes for sale
- Carroll County homes for sale
- Cecil County homes for sale
- District of Columbia County homes for sale
- Fairfax County homes for sale
- Fairfax city County homes for sale
- Falls Church city County homes for sale
- Frederick County homes for sale
- Harford County homes for sale
- Howard County homes for sale
- Kent County homes for sale
- Montgomery County homes for sale
- Prince George's County homes for sale
- Queen Anne's County homes for sale
- Talbot County homes for sale
- York County homes for sale
Protect your home and budget from life's surprises with an Assurant Home Warranty, backed by a partner that supports you through every step of homeownership. Explore Plans.
©2026 Century 21 Real Estate LLC. All rights reserved. CENTURY 21®, the CENTURY 21 Logo and C21® are service marks owned by Century 21 Real Estate LLC. Century 21 Real Estate LLC fully supports the principles of the Fair Housing Act and the Equal Opportunity Act. Each office is independently owned and operated. Listing information is deemed reliable but not guaranteed accurate.