- Bridesburg, Philadelphia homes for sale
- Fairhill, Philadelphia homes for sale
- Feltonville, Philadelphia homes for sale
- Fishtown, Philadelphia homes for sale
- Glenwood, Philadelphia homes for sale
- Harrowgate, Philadelphia homes for sale
- Hartranft, Philadelphia homes for sale
- Hunting Park, Philadelphia homes for sale
- Juniata, Philadelphia homes for sale
- Kensington, Philadelphia homes for sale
- Logan, Philadelphia homes for sale
- Ludlow, Philadelphia homes for sale
- Nicetown, Philadelphia homes for sale
- Northern Liberties, Philadelphia homes for sale
- Northwood, Philadelphia homes for sale
- Olde Kensington, Philadelphia homes for sale
- Port Richmond, Philadelphia homes for sale
- Templetown, Philadelphia homes for sale
- Tioga, Philadelphia homes for sale
- Upper North Philadelphia, Philadelphia homes for sale
West Kensington, Philadelphia, PA - homes for sale
74 of 74 results displayed
- New
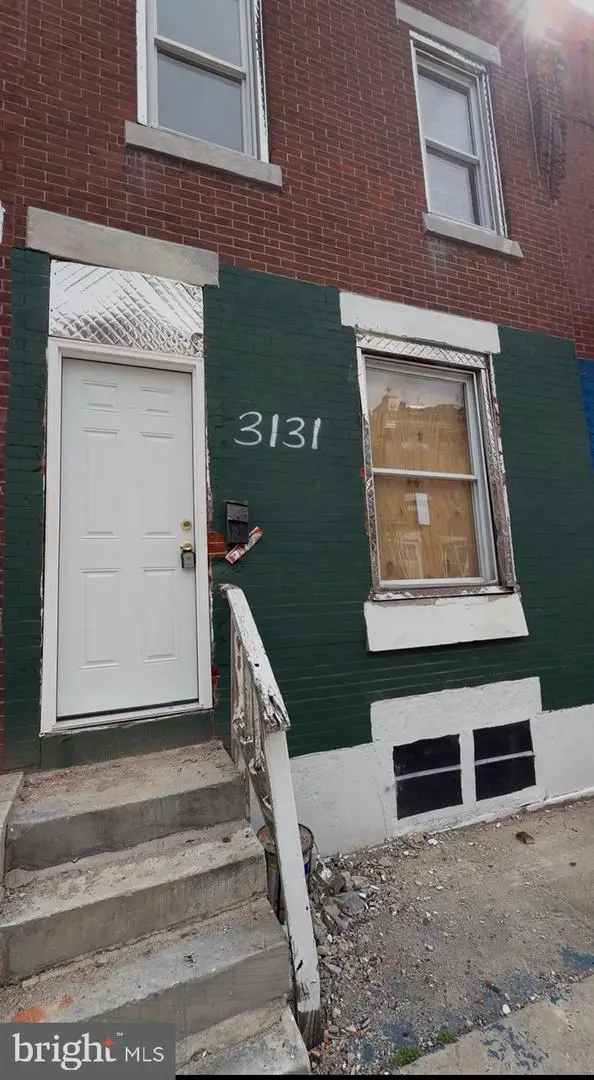 $65,000Active3 beds 1 baths1,120 sq. ft.
3131 Weymouth St, PHILADELPHIA, PA 19134
MLS# PAPH2601266Listed by: REALECTIV - New
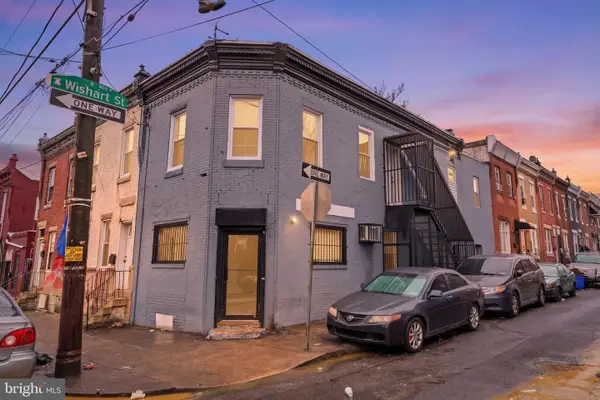 $219,999Active2 beds -- baths1,120 sq. ft.
3128 F St, PHILADELPHIA, PA 19134
MLS# PAPH2599206Listed by: HOMESTARR REALTY 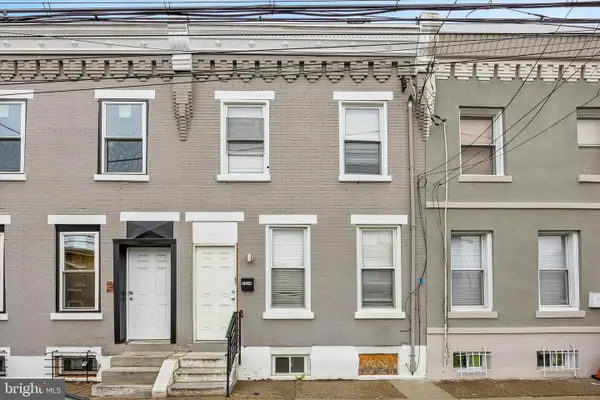 $139,900Pending2 beds 3 baths994 sq. ft.
2834 D St, PHILADELPHIA, PA 19134
MLS# PAPH2599022Listed by: KW EMPOWER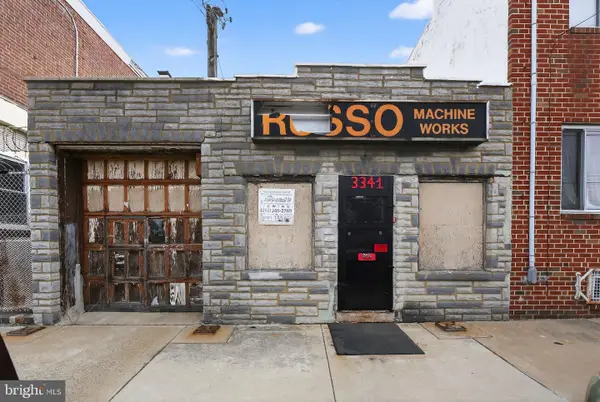 $349,900Active1 beds 2 baths3,779 sq. ft.
3341-43 D St, PHILADELPHIA, PA 19134
MLS# PAPH2596824Listed by: HOMESTARR REALTY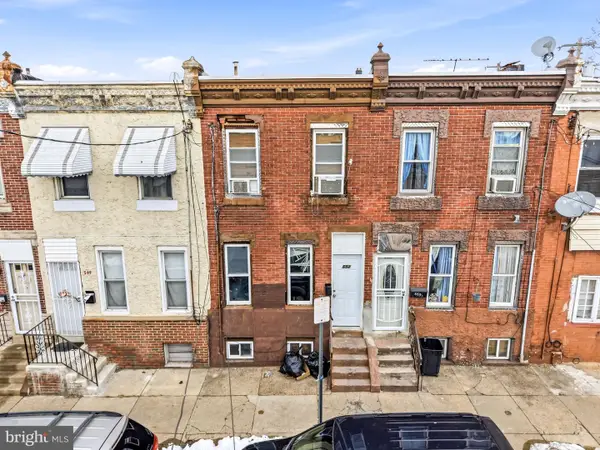 $120,000Active3 beds 1 baths1,092 sq. ft.
551 E Indiana Ave, PHILADELPHIA, PA 19134
MLS# PAPH2595388Listed by: KELLER WILLIAMS REALTY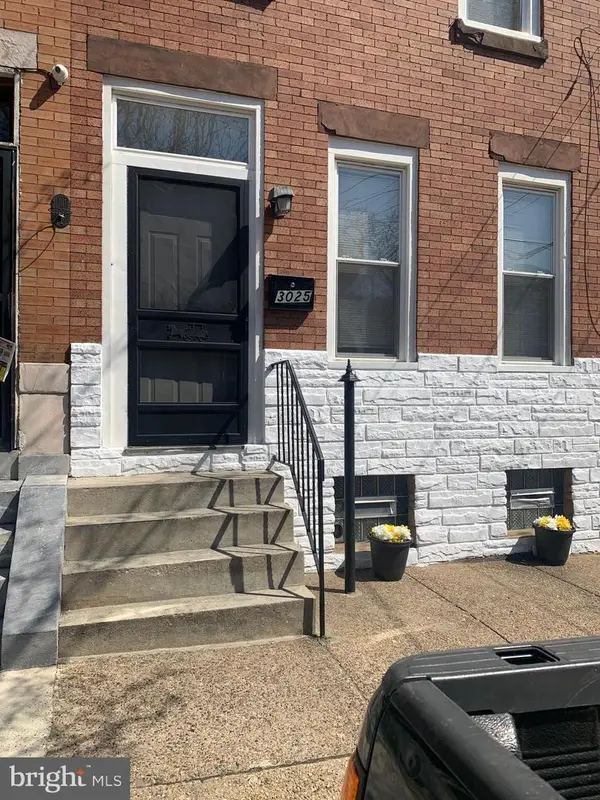 $100,000Active3 beds 1 baths1,120 sq. ft.
3025 Rorer St, PHILADELPHIA, PA 19134
MLS# PAPH2595002Listed by: COMPASS PENNSYLVANIA, LLC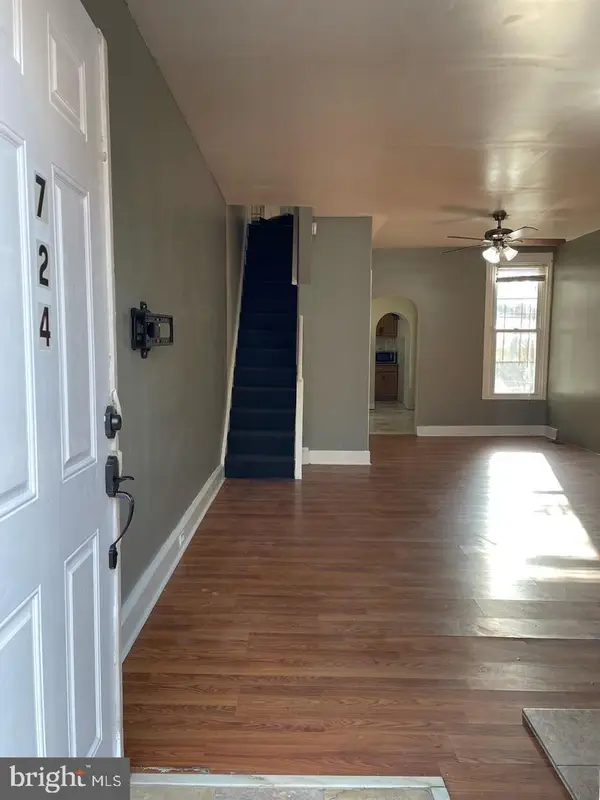 $100,000Active3 beds 1 baths1,200 sq. ft.
724 E Clearfield St, PHILADELPHIA, PA 19134
MLS# PAPH2595016Listed by: COMPASS PENNSYLVANIA, LLC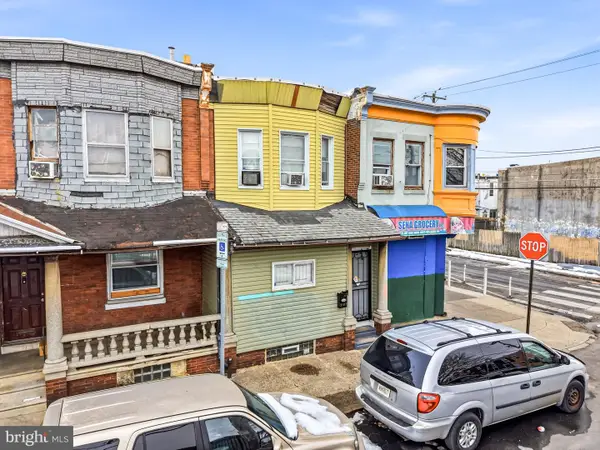 $125,000Active3 beds 1 baths1,290 sq. ft.
3103 Rorer St, PHILADELPHIA, PA 19134
MLS# PAPH2594978Listed by: KELLER WILLIAMS REALTY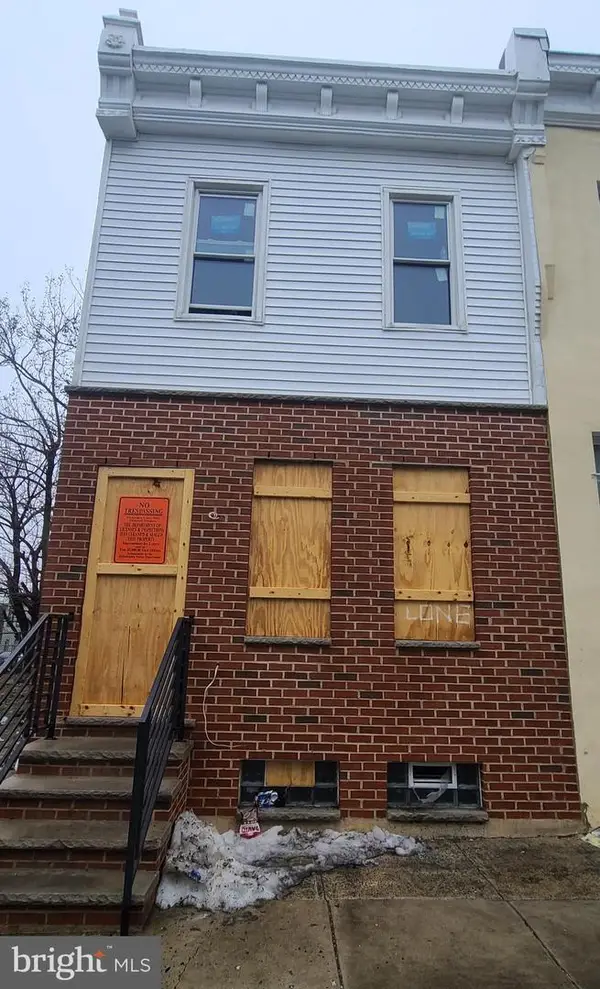 $59,900Active-- beds -- baths1,064 sq. ft.
662 E Lippincott St, PHILADELPHIA, PA 19134
MLS# PAPH2593054Listed by: EXP REALTY, LLC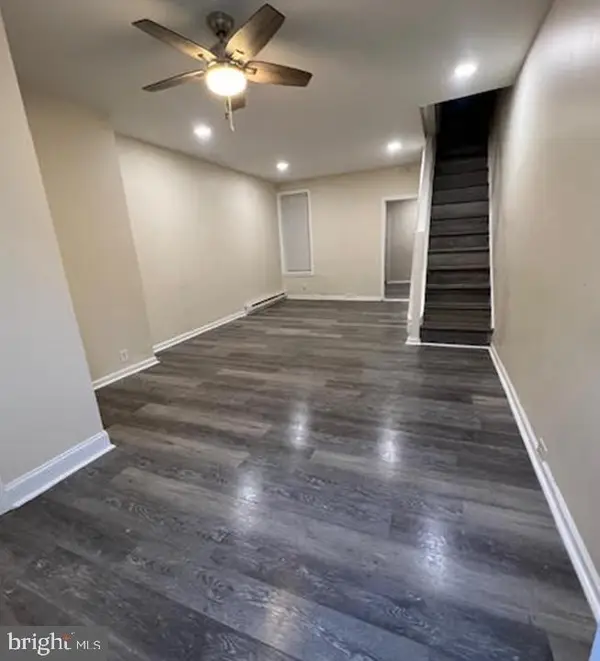 $129,900Active3 beds 2 baths1,008 sq. ft.
627 E Clementine St, PHILADELPHIA, PA 19134
MLS# PAPH2591480Listed by: LEGACY REAL ESTATE, INC. $89,900Pending3 beds 1 baths1,208 sq. ft.
3110 Boudinot St, PHILADELPHIA, PA 19134
MLS# PAPH2591674Listed by: RE/MAX KEYSTONE $29,000Pending3 beds 1 baths1,120 sq. ft.
3117 Weymouth St, PHILADELPHIA, PA 19134
MLS# PAPH2587860Listed by: KW EMPOWER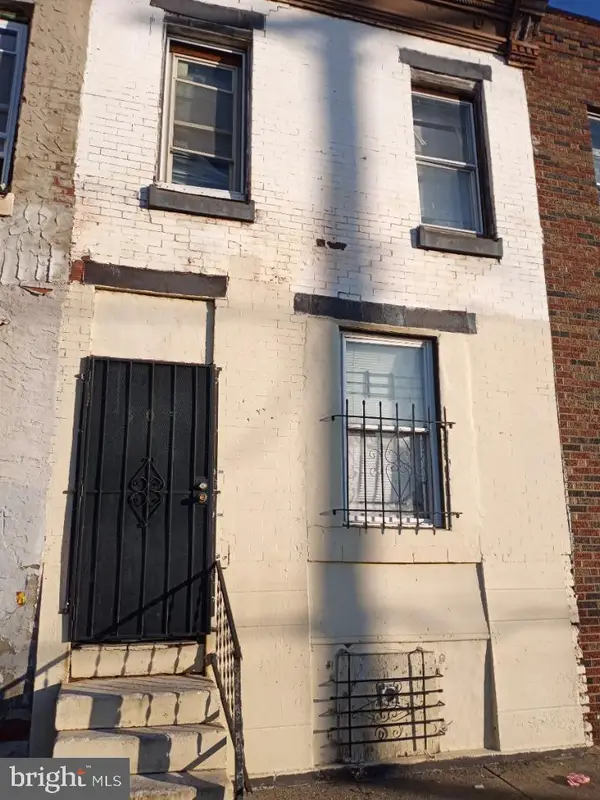 $65,000Active3 beds 1 baths1,120 sq. ft.
303 E Indiana Ave, PHILADELPHIA, PA 19134
MLS# PAPH2587734Listed by: RE/MAX ACCESS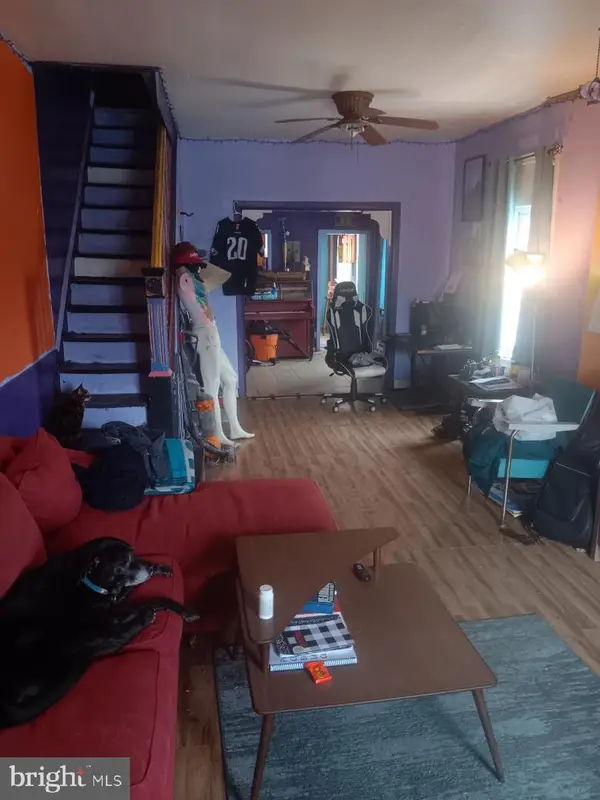 $75,000Active3 beds 1 baths672 sq. ft.
365 E Cambria St, PHILADELPHIA, PA 19134
MLS# PAPH2587742Listed by: RE/MAX ACCESS $99,900Active0 Acres
305 E Tusculum St, PHILADELPHIA, PA 19134
MLS# PAPH2587460Listed by: OCF REALTY LLC - PHILADELPHIA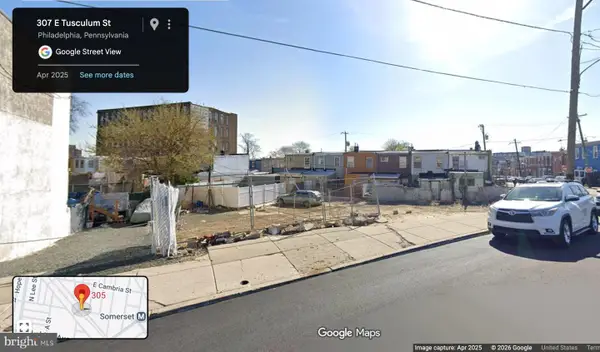 $99,900Active0 Acres
309 E Tusculum St, PHILADELPHIA, PA 19134
MLS# PAPH2587470Listed by: OCF REALTY LLC - PHILADELPHIA $19,900Active0 Acres
325 E Tusculum St, PHILADELPHIA, PA 19134
MLS# PAPH2587480Listed by: OCF REALTY LLC - PHILADELPHIA $89,900Active3 beds 3 baths1,120 sq. ft.
3134 Weymouth St, PHILADELPHIA, PA 19134
MLS# PAPH2586170Listed by: SJI JACKSON REALTY, LLC $99,900Active3 beds 3 baths1,200 sq. ft.
716 E Clearfield St, PHILADELPHIA, PA 19134
MLS# PAPH2586184Listed by: SJI JACKSON REALTY, LLC $99,900Active3 beds 3 baths1,008 sq. ft.
629 E Clementine St, PHILADELPHIA, PA 19134
MLS# PAPH2586186Listed by: SJI JACKSON REALTY, LLC $99,900Active3 beds 3 baths1,064 sq. ft.
3131 Custer St, PHILADELPHIA, PA 19134
MLS# PAPH2586214Listed by: SJI JACKSON REALTY, LLC $109,900Active3 beds 3 baths1,064 sq. ft.
624 E Lippincott St, PHILADELPHIA, PA 19134
MLS# PAPH2586294Listed by: SJI JACKSON REALTY, LLC $99,900Active3 beds 3 baths1,092 sq. ft.
3023 B St, PHILADELPHIA, PA 19134
MLS# PAPH2586298Listed by: SJI JACKSON REALTY, LLC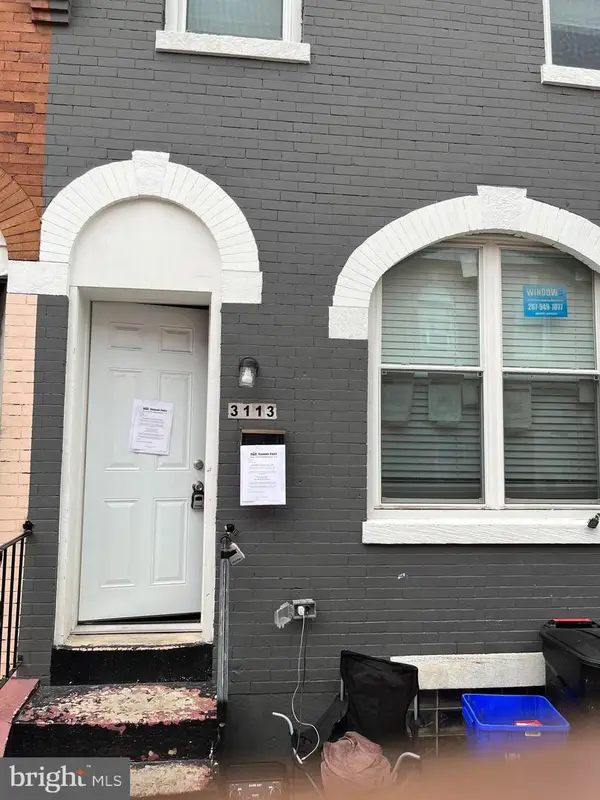 $99,900Active3 beds 3 baths960 sq. ft.
3113 Hartville St, PHILADELPHIA, PA 19134
MLS# PAPH2586224Listed by: SJI JACKSON REALTY, LLC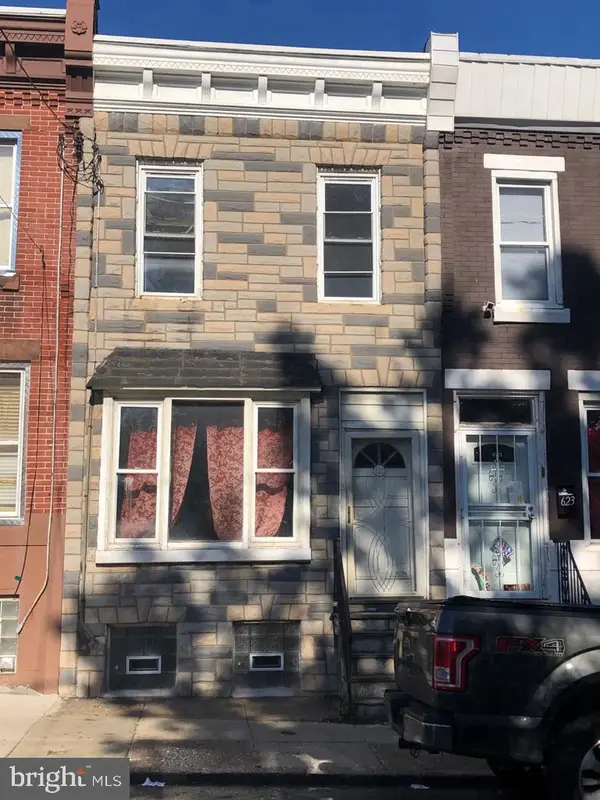 $99,900Active3 beds 3 baths1,276 sq. ft.
621 E Clearfield St, PHILADELPHIA, PA 19134
MLS# PAPH2586338Listed by: SJI JACKSON REALTY, LLC $99,900Active3 beds 3 baths1,008 sq. ft.
631 E Clementine St, PHILADELPHIA, PA 19134
MLS# PAPH2586362Listed by: SJI JACKSON REALTY, LLC $99,900Active3 beds 3 baths1,680 sq. ft.
3067 Potter St, PHILADELPHIA, PA 19134
MLS# PAPH2586368Listed by: SJI JACKSON REALTY, LLC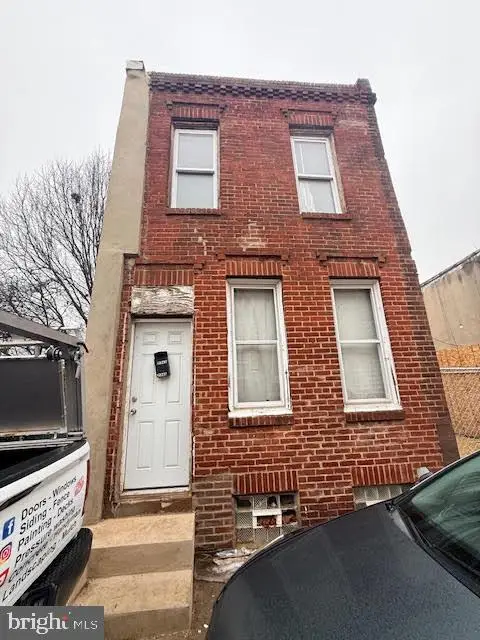 $36,000Pending2 beds 1 baths780 sq. ft.
2942 Rutledge St, PHILADELPHIA, PA 19134
MLS# PAPH2586520Listed by: THE PEOPLE'S CHOICE REAL ESTATE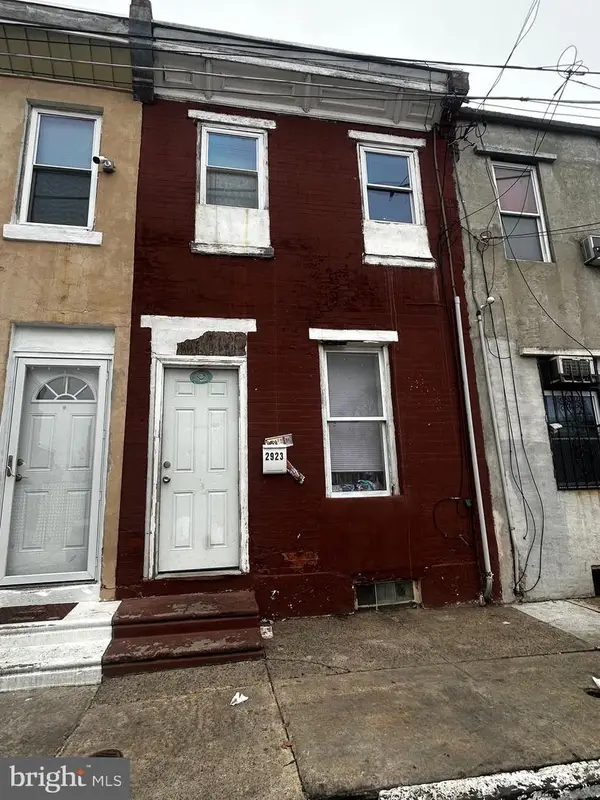 $45,000Active3 beds 1 baths784 sq. ft.
2923 Hurley St, PHILADELPHIA, PA 19134
MLS# PAPH2585868Listed by: REALTY MARK CITYSCAPE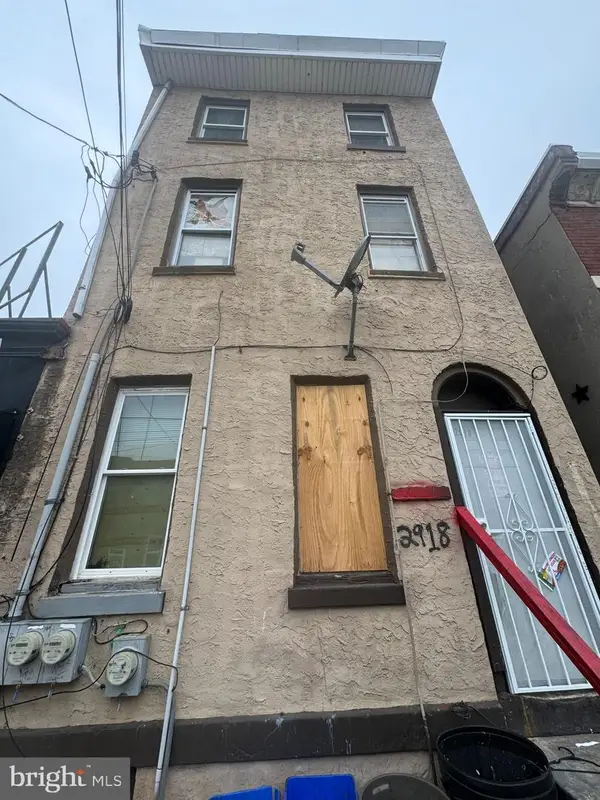 $180,000Active5 beds -- baths1,870 sq. ft.
2918 D St, PHILADELPHIA, PA 19134
MLS# PAPH2585672Listed by: TCS MANAGEMENT, LLC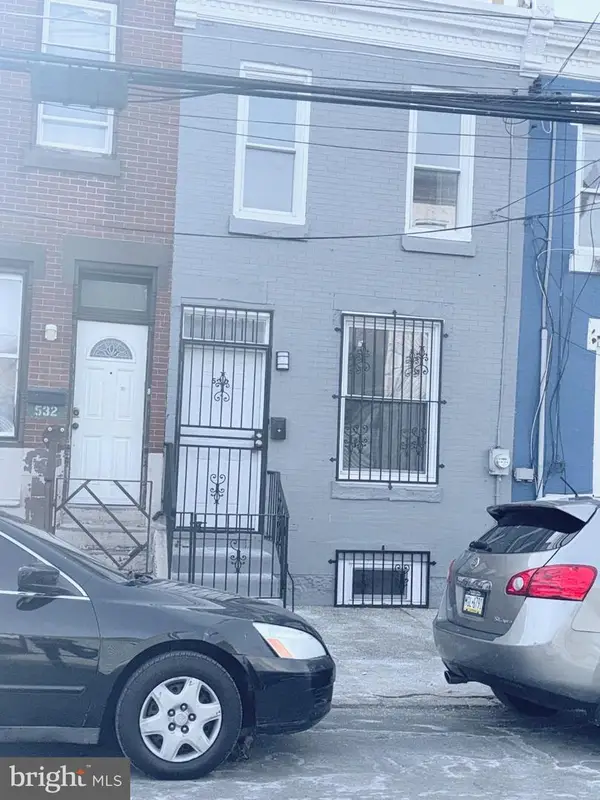 $160,000Active3 beds 1 baths1,120 sq. ft.
530 E Indiana Ave, PHILADELPHIA, PA 19134
MLS# PAPH2583410Listed by: MIS REALTY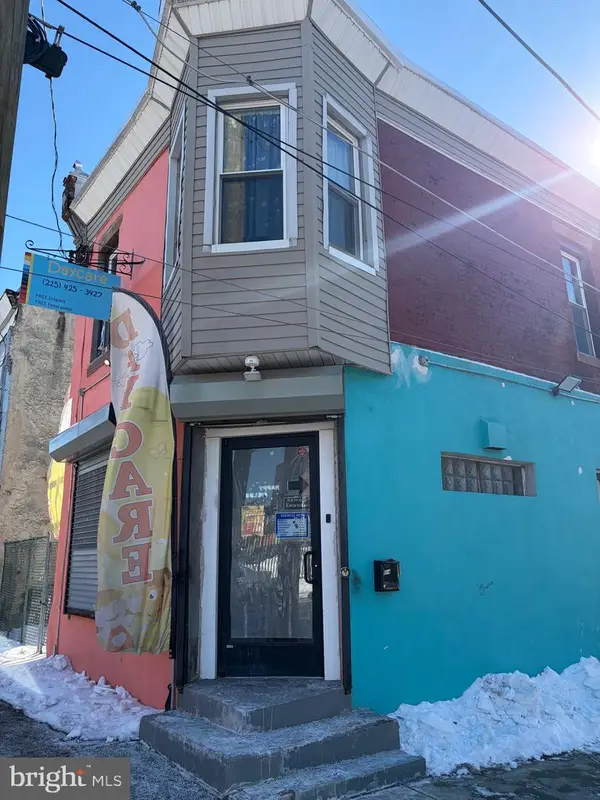 $224,900Active-- beds -- baths
516 E Clearfield St, PHILADELPHIA, PA 19134
MLS# PAPH2582140Listed by: CASA BELLA REALTY LLC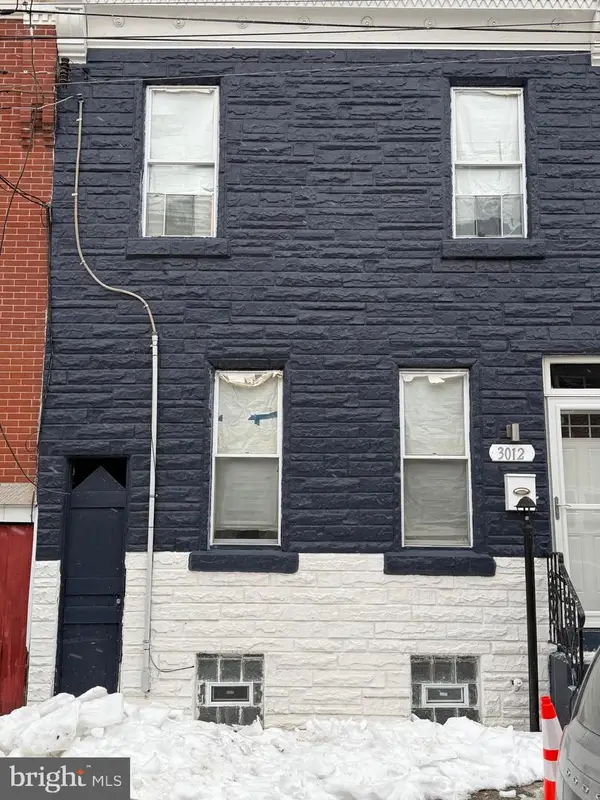 $178,000Active4 beds 3 baths1,280 sq. ft.
3012 D St, PHILADELPHIA, PA 19134
MLS# PAPH2582072Listed by: KW EMPOWER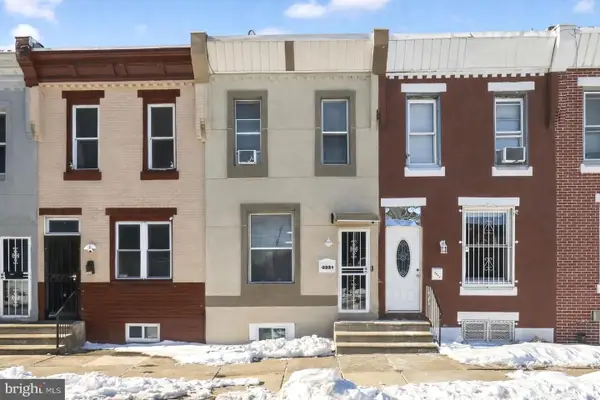 $199,999Active2 beds 1 baths1,040 sq. ft.
3038 Rosehill St, PHILADELPHIA, PA 19134
MLS# PAPH2577344Listed by: COLDWELL BANKER REALTY $65,000Active0.03 Acres
2724-26 Kensington Ave, PHILADELPHIA, PA 19134
MLS# PAPH2578284Listed by: HONEST REAL ESTATE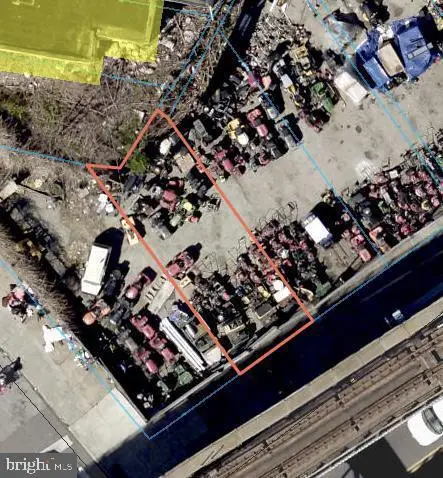 $65,000Active0.03 Acres
2728 Kensington Ave, PHILADELPHIA, PA 19134
MLS# PAPH2578314Listed by: HONEST REAL ESTATE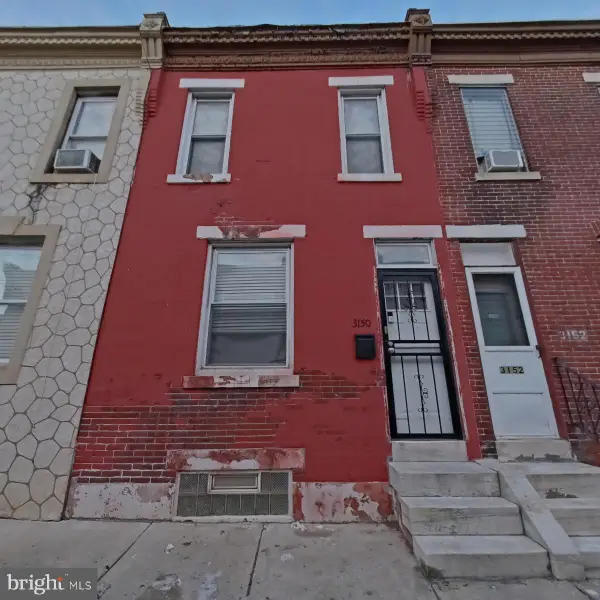 $80,000Active2 beds 1 baths840 sq. ft.
3150 Arbor St, PHILADELPHIA, PA 19134
MLS# PAPH2576802Listed by: LPT REALTY, LLC $150,000Active3 beds 1 baths840 sq. ft.
3137 Arbor St, PHILADELPHIA, PA 19134
MLS# PAPH2574986Listed by: QUALITY REAL ESTATE-BROAD ST $72,000Active3 beds 2 baths1,250 sq. ft.
2831 Boudinot St, PHILADELPHIA, PA 19134
MLS# PAPH2575320Listed by: OPUS ELITE REAL ESTATE $169,000Active3 beds 1 baths1,280 sq. ft.
3019 D St, PHILADELPHIA, PA 19134
MLS# PAPH2573060Listed by: UNITED REAL ESTATE GROUP $139,000Active3 beds 1 baths980 sq. ft.
3055 Hartville St, PHILADELPHIA, PA 19134
MLS# PAPH2570492Listed by: REALTY ONE GROUP RESTORE $34,900Pending3 beds 1 baths1,064 sq. ft.
3109 Reach St, PHILADELPHIA, PA 19134
MLS# PAPH2567298Listed by: DAN REALTY $85,000Pending3 beds 1 baths1,120 sq. ft.
3044 Rorer St, PHILADELPHIA, PA 19134
MLS# PAPH2587958Listed by: PANPHIL REALTY, LLC $25,000Active0.02 Acres
622 E Clementine St, PHILADELPHIA, PA 19134
MLS# PAPH2563660Listed by: FINEHILL LLC- $25,000Active0.02 Acres
624 E Clementine St, PHILADELPHIA, PA 19134
MLS# PAPH2563664Listed by: FINEHILL LLC - $20,000Active0.02 Acres
3159 Custer St, PHILADELPHIA, PA 19134
MLS# PAPH2563510Listed by: FINEHILL LLC  $17,500Active0.02 Acres
633 E Clementine St, PHILADELPHIA, PA 19134
MLS# PAPH2561356Listed by: KELLER WILLIAMS REALTY GROUP $455,000Active0.14 Acres
2724-38 Kensington Ave, PHILADELPHIA, PA 19134
MLS# PAPH2560820Listed by: HONEST REAL ESTATE $459,900Pending3 beds 3 baths2,600 sq. ft.
3005 Gaul St, PHILADELPHIA, PA 19134
MLS# PAPH2558078Listed by: KW EMPOWER $39,800Active0.02 Acres
665 E Lippincott St, PHILADELPHIA, PA 19134
MLS# PAPH2557452Listed by: SUPER REALTY GROUP, LLC $200,000Active5 beds -- baths2,700 sq. ft.
3151 G St, PHILADELPHIA, PA 19134
MLS# PAPH2547346Listed by: PLETHORA GROUP REAL ESTATE LLC $150,000Active3 beds 1 baths954 sq. ft.
3010 Rosehill St, PHILADELPHIA, PA 19134
MLS# PAPH2542336Listed by: CITY & SUBURBAN REAL ESTATE $45,000Pending2 beds 1 baths952 sq. ft.
3112 Hurley St, PHILADELPHIA, PA 19134
MLS# PAPH2539628Listed by: OPUS ELITE REAL ESTATE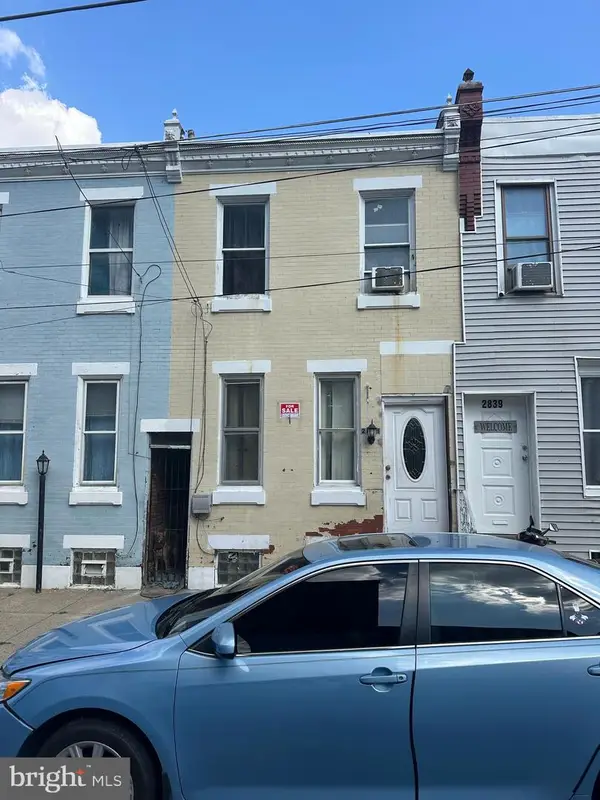 $150,000Active3 beds 2 baths840 sq. ft.
2841 Rosehill St, PHILADELPHIA, PA 19134
MLS# PAPH2542294Listed by: CITY & SUBURBAN REAL ESTATE- $69,900Active0.03 Acres
2820 Kensington Ave, PHILADELPHIA, PA 19134
MLS# PAPH2594796Listed by: KELLER WILLIAMS MAIN LINE 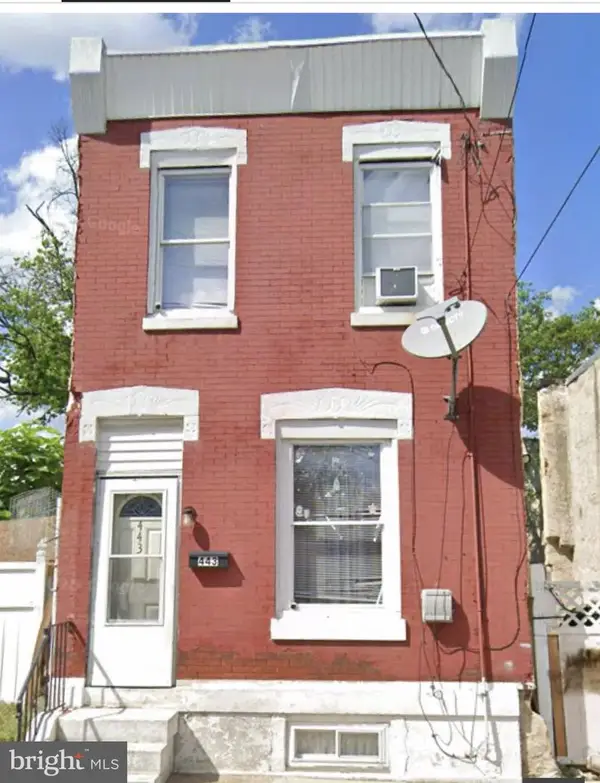 $97,900Active3 beds 1 baths1,306 sq. ft.
443 E Cambria St, PHILADELPHIA, PA 19134
MLS# PAPH2537302Listed by: RE/MAX AFFILIATES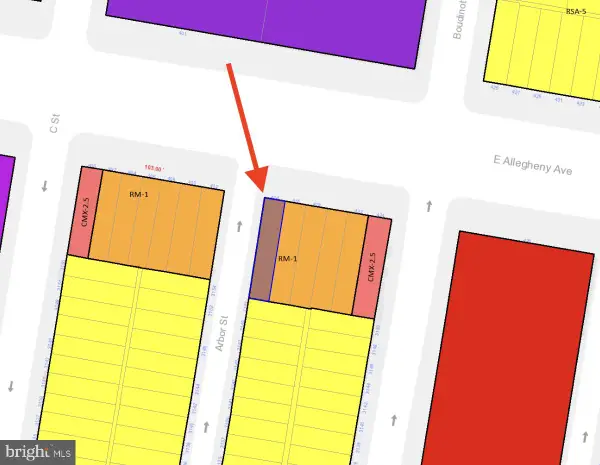 $39,900Active0.02 Acres
414 E Allegheny Ave, PHILADELPHIA, PA 19134
MLS# PAPH2536322Listed by: KELLER WILLIAMS REALTY GROUP $35,000Active0.01 Acres
324 E Cambria St, PHILADELPHIA, PA 19134
MLS# PAPH2514984Listed by: URBAN REALTY CORPORATION $18,000Active0.02 Acres
664 E Lippincott St, PHILADELPHIA, PA 19134
MLS# PAPH2506914Listed by: CITY & SUBURBAN REAL ESTATE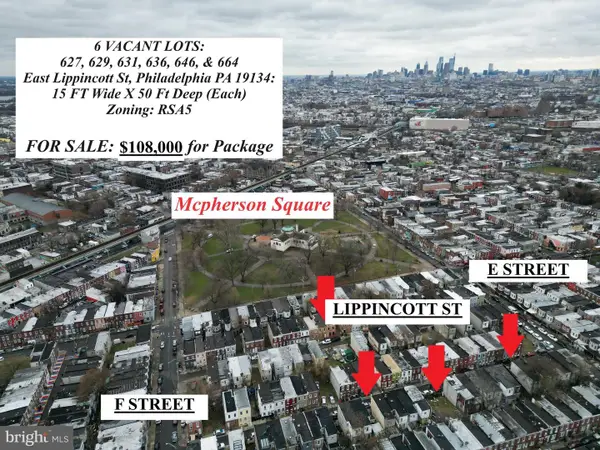 $18,000Active0.02 Acres
627 E Lippincott St, PHILADELPHIA, PA 19134
MLS# PAPH2506858Listed by: CITY & SUBURBAN REAL ESTATE $18,000Active0.02 Acres
629 E Lippincott St, PHILADELPHIA, PA 19134
MLS# PAPH2506872Listed by: CITY & SUBURBAN REAL ESTATE $18,000Active0.02 Acres
631 E Lippincott St, PHILADELPHIA, PA 19134
MLS# PAPH2506880Listed by: CITY & SUBURBAN REAL ESTATE $18,000Active0.02 Acres
636 E Lippincott St, PHILADELPHIA, PA 19134
MLS# PAPH2506886Listed by: CITY & SUBURBAN REAL ESTATE $18,000Active0.02 Acres
646 E Lippincott St, PHILADELPHIA, PA 19134
MLS# PAPH2506902Listed by: CITY & SUBURBAN REAL ESTATE $104,850Active2 beds 1 baths1,080 sq. ft.
433 E Auburn St, PHILADELPHIA, PA 19134
MLS# PAPH2483304Listed by: HAMPTON PREFERRED REAL ESTATE INC $334,888Active4 beds -- baths2,322 sq. ft.
531 E Indiana Ave, PHILADELPHIA, PA 19134
MLS# PAPH2439226Listed by: KW EMPOWER $120,000Active4 beds 1 baths1,008 sq. ft.
661 E Clementine St, PHILADELPHIA, PA 19134
MLS# PAPH2549422Listed by: EXP REALTY, LLC $30,000Active0.01 Acres
304 E William St, PHILADELPHIA, PA 19134
MLS# PAPH2456862Listed by: PHILADELPHIA HOMES $168,888Active3 beds -- baths1,173 sq. ft.
626 E Allegheny Ave, PHILADELPHIA, PA 19134
MLS# PAPH2464358Listed by: KW EMPOWER $119,000Active3 beds -- baths1,064 sq. ft.
3154 Reach St, PHILADELPHIA, PA 19134
MLS# PAPH2464362Listed by: KW EMPOWER- $50,000Active3 beds 1 baths1,064 sq. ft.
3110 Reach St, PHILADELPHIA, PA 19134
MLS# PAPH2241050Listed by: DAIS REALTY CORPORATION  $33,900Active0.01 Acres
318 E William St, PHILADELPHIA, PA 19134
MLS# PAPH2532872Listed by: REALTY ONE GROUP FOCUS $27,900Active0.02 Acres
602 E Lippincott St, PHILADELPHIA, PA 19134
MLS# PAPH2532862Listed by: REALTY ONE GROUP FOCUS- $15,000Active0.01 Acres
301 E William St, PHILADELPHIA, PA 19134
MLS# PAPH2134988Listed by: FINEHILL LLC
Local realty services provided by:CENTURY 21 Harris Hawkins & Co.
Popular neighborhoods near West Kensington, Philadelphia, PA
Zip codes near West Kensington, Philadelphia, PA
- 08102 homes for sale
- 08105 homes for sale
- 08110 homes for sale
- 19102 homes for sale
- 19106 homes for sale
- 19107 homes for sale
- 19120 homes for sale
- 19121 homes for sale
- 19122 homes for sale
- 19123 homes for sale
- 19124 homes for sale
- 19125 homes for sale
- 19129 homes for sale
- 19130 homes for sale
- 19132 homes for sale
- 19133 homes for sale
- 19134 homes for sale
- 19137 homes for sale
- 19140 homes for sale
- 19141 homes for sale
Counties near West Kensington, Philadelphia, PA
- Atlantic County homes for sale
- Berks County homes for sale
- Bucks County homes for sale
- Burlington County homes for sale
- Camden County homes for sale
- Cecil County homes for sale
- Chester County homes for sale
- Cumberland County homes for sale
- Delaware County homes for sale
- Gloucester County homes for sale
- Hunterdon County homes for sale
- Lehigh County homes for sale
- Mercer County homes for sale
- Middlesex County homes for sale
- Montgomery County homes for sale
- New Castle County homes for sale
- Ocean County homes for sale
- Philadelphia County homes for sale
- Salem County homes for sale
- Somerset County homes for sale
Protect your home and budget from life's surprises with an Assurant Home Warranty, backed by a partner that supports you through every step of homeownership. Explore Plans.
©2026 Century 21 Real Estate LLC. All rights reserved. CENTURY 21®, the CENTURY 21 Logo and C21® are service marks owned by Century 21 Real Estate LLC. Century 21 Real Estate LLC fully supports the principles of the Fair Housing Act and the Equal Opportunity Act. Each office is independently owned and operated. Listing information is deemed reliable but not guaranteed accurate.