- Alamitos Beach, Long Beach homes for sale
- Bluff Heights, Long Beach homes for sale
- Bluff Park, Long Beach homes for sale
- Broadway Corridor, Long Beach homes for sale
- Cambodia Town, Long Beach homes for sale
- Central Long Beach, Long Beach homes for sale
- Downtown Long Beach, Long Beach homes for sale
- East Village, Long Beach homes for sale
- Franklin, Long Beach homes for sale
- Hellman, Long Beach homes for sale
- Poly High, Long Beach homes for sale
- Renaissance Square, Long Beach homes for sale
- Rose Park, Long Beach homes for sale
- Saint Mary's, Long Beach homes for sale
- South Wrigley, Long Beach homes for sale
- Southeast Wrigley, Long Beach homes for sale
- Washington, Long Beach homes for sale
- Westside, Long Beach homes for sale
- Willmore, Long Beach homes for sale
- Zaferia, Long Beach homes for sale
West Village, Long Beach, CA - homes for sale
47 of 47 results displayed
- New
 $325,000Active-- beds 1 baths435 sq. ft.
325 W 3rd #507, Long Beach, CA 90802
MLS# CRPW26046218Listed by: THINK BOUTIQ REAL ESTATE - New$325,000Active-- beds 1 baths435 sq. ft.
325 W 3rd #507, Long Beach, CA 90802
MLS# PW26046218Listed by: THINK BOUTIQ REAL ESTATE - New

 $345,000Active1 beds 1 baths666 sq. ft.
545 Chestnut #203, Long Beach, CA 90802
MLS# RS26064798Listed by: CENTURY 21 ON TARGET - New
 $425,000Active1 beds 1 baths702 sq. ft.
535 Magnolia #113, Long Beach, CA 90802
MLS# SB26067061Listed by: VYLLA HOME, INC - New
 $1,899,000Active-- beds -- baths7,190 sq. ft.
617 West 3rd Street, Long Beach, CA 90802
MLS# PW26065075Listed by: CENTURY 21 MASTERS - New
 $469,000Active2 beds 2 baths1,017 sq. ft.
640 W 4th Street #410, Long Beach, CA 90802
MLS# CRPW26064435Listed by: KELLER WILLIAMS PACIFIC ESTATE - New
 $469,000Active2 beds 2 baths1,017 sq. ft.
640 W 4th Street #410, Long Beach, CA 90802
MLS# PW26064435Listed by: KELLER WILLIAMS PACIFIC ESTATE - New
 $2,100,000Active-- beds -- baths6,366 sq. ft.
613 W 4th Street, Long Beach, CA 90802
MLS# OC26064399Listed by: MARCUS & MILLICHAP RE INVEST - Open Thu, 11 to 1pm
 $548,888Active2 beds 2 baths906 sq. ft.
555 Maine Avenue #225, Long Beach, CA 90802
MLS# SR26057682Listed by: PINNACLE ESTATE PROPERTIES, INC.  $306,500Active1 beds 1 baths457 sq. ft.
315 W 3rd Street #410, Long Beach, CA 90802
MLS# RS26058621Listed by: MARK 1 REAL ESTATE INC $399,999Active2 beds 2 baths913 sq. ft.
401 W 5th #3C, Long Beach, CA 90802
MLS# CRIG26055882Listed by: KASI HOMES $505,000Active2 beds 2 baths957 sq. ft.
720 W 4th #305, Long Beach, CA 90802
MLS# CRIG26053232Listed by: JL REALTY & MANAGEMENT $1,325,000Active6 beds 4 baths
532 Chestnut, Long Beach, CA 90802
MLS# CV26052460Listed by: BERKSHIRE HATH HM SVCS CA PROP $285,000Active1 beds 1 baths585 sq. ft.
335 Cedar Avenue #412, Long Beach, CA 90802
MLS# PW26051623Listed by: VISTA SOTHEBY'S INT'L REALTY $499,000Active2 beds 2 baths867 sq. ft.
645 Chestnut Avenue #316, Long Beach, CA 90802
MLS# 26661655Listed by: COASTLINE 840 $3,698,000Active9 beds 19 baths11,928 sq. ft.
444 Chestnut Avenue, Long Beach, CA 90802
MLS# 26659109Listed by: THE AGENCY $519,000Active2 beds 2 baths1,010 sq. ft.
327 Chestnut Avenue #104, Long Beach, CA 90802
MLS# CL26656943Listed by: KASE REAL ESTATE $419,988Active2 beds 2 baths911 sq. ft.
321 Daisy #3, Long Beach, CA 90802
MLS# RS26038045Listed by: BAYRON BLISS, BROKER $435,000Pending2 beds 2 baths1,017 sq. ft.
640 W 4th Street #401, Long Beach, CA 90802
MLS# CRPW26035057Listed by: KELLER WILLIAMS COASTAL PROP. $299,000Active-- beds 1 baths457 sq. ft.
315 W 3rd Street #710, Long Beach, CA 90802
MLS# RS26030660Listed by: MARK 1 REAL ESTATE INC $225,000Active-- beds 1 baths340 sq. ft.
354 Chestnut Avenue #29, Long Beach, CA 90802
MLS# PW26022141Listed by: DUNFEE REAL ESTATE SERVICES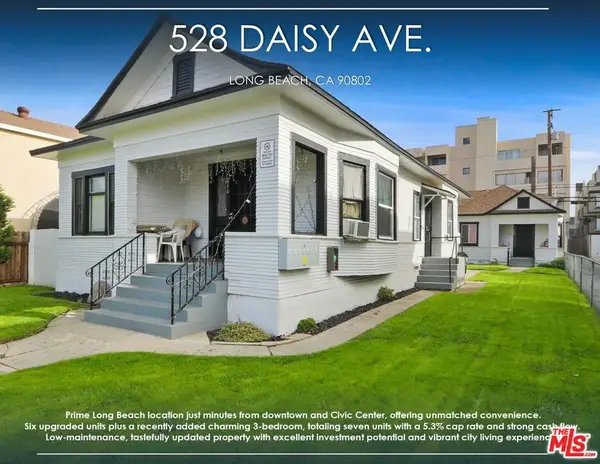 $1,995,000Active9 beds 8 baths4,144 sq. ft.
528 Daisy Avenue, Long Beach, CA 90802
MLS# 26645267Listed by: GLOBAL PLATINUM PROPERTIES, INC. $330,000Active1 beds 1 baths644 sq. ft.
640 W 4th #101, Long Beach, CA 90802
MLS# SW26017237Listed by: NEXTHOME WEST REALTY $479,900Active2 beds 2 baths957 sq. ft.
720 W 4th Street #104, Long Beach, CA 90802
MLS# CROC26013863Listed by: FIRST TEAM REAL ESTATE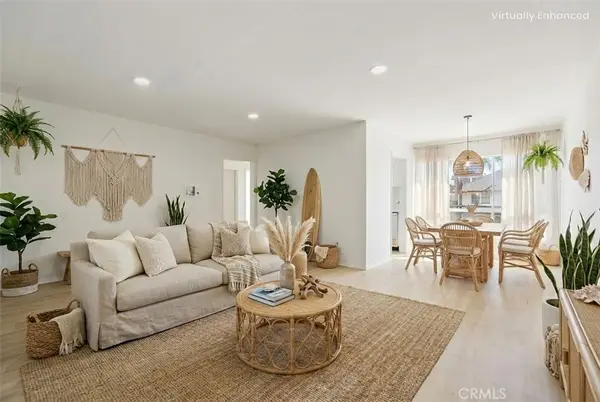 $419,900Active2 beds 2 baths989 sq. ft.
505 Cedar Avenue #2A, Long Beach, CA 90802
MLS# IV26011627Listed by: BERKSHIRE HATHAWAY HOMESERVICES CALIFORNIA REALTY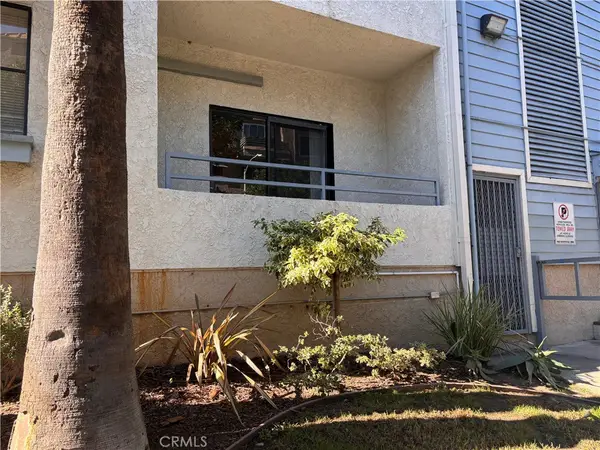 $365,000Active1 beds 2 baths588 sq. ft.
720 W 4th #114, Long Beach, CA 90802
MLS# DW26010977Listed by: CENTURY 21 JERVIS & ASSOCIATES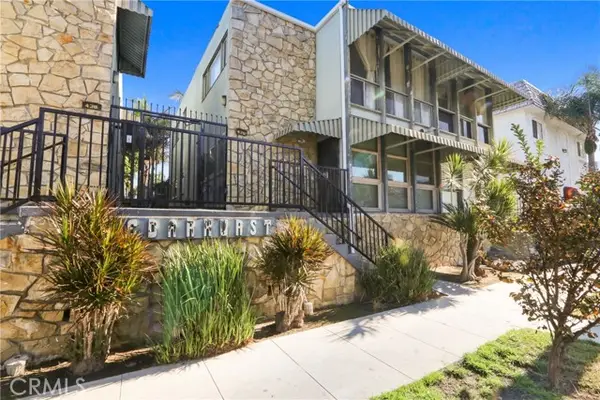 $495,000Active2 beds 1 baths946 sq. ft.
436 Cedar #15, Long Beach, CA 90802
MLS# CRRS26007135Listed by: SOUTHLAND REAL ESTATE SERVICE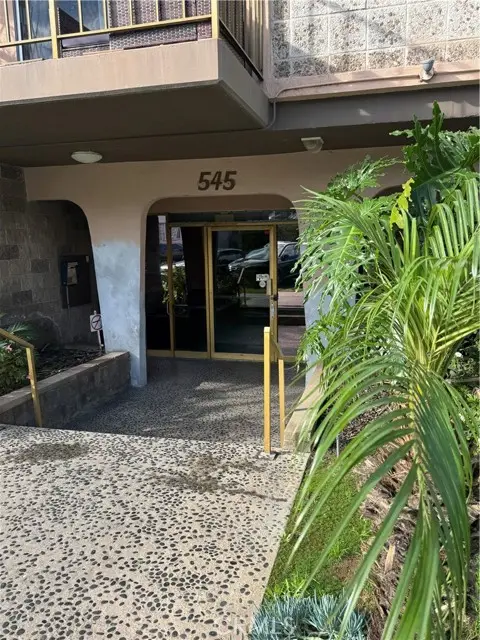 $399,000Active2 beds 2 baths926 sq. ft.
545 Chestnut #116, Long Beach, CA 90802
MLS# CRPW26002033Listed by: COLDWELL BANKER COMMERCIAL $379,000Active1 beds 2 baths584 sq. ft.
720 W 4th #110, Long Beach, CA 90802
MLS# CRPW25278493Listed by: KELLER WILLIAMS PACIFIC ESTATE $444,000Active2 beds 2 baths956 sq. ft.
401 W 5th Street #3B, Long Beach, CA 90802
MLS# PW25276830Listed by: CIRCLE REAL ESTATE $444,000Active2 beds 2 baths956 sq. ft.
401 W 5th Street #3B, Long Beach, CA 90802
MLS# PW25276830Listed by: CIRCLE REAL ESTATE $545,000Active2 beds 2 baths1,015 sq. ft.
730 W 4th Street #120, Long Beach, CA 90802
MLS# 25628369Listed by: REAL INNOVATE REALTY $399,845Active2 beds 1 baths809 sq. ft.
527 Cedar #2E, Long Beach, CA 90802
MLS# SB25269788Listed by: COLDWELL BANKER REALTY $499,000Active2 beds 2 baths867 sq. ft.
645 Chestnut Avenue #316, Long Beach, CA 90802
MLS# CL26661655Listed by: COASTLINE 840 $4,748,000Active7 beds 25 baths14,055 sq. ft.
330 Cedar Avenue, Long Beach, CA 90802
MLS# 25618923Listed by: THE AGENCY- Open Fri, 2 to 6pm
 $565,000Active2 beds 2 baths1,069 sq. ft.
315 W 3rd Street #301, Long Beach, CA 90802
MLS# PW25259777Listed by: EXP REALTY OF CALIFORNIA INC  $535,000Active2 beds 2 baths892 sq. ft.
555 Maine Ave #330, Long Beach, CA 90802
MLS# 260005131SDListed by: EXP REALTY OF CALIFORNIA, INC. $535,000Active2 beds 2 baths860 sq. ft.
327 Chestnut Avenue #102, Long Beach, CA 90802
MLS# RS25244666Listed by: GREAT INVESTMENTS, INC. $535,000Active2 beds 2 baths860 sq. ft.
327 Chestnut Avenue #102, Long Beach, CA 90802
MLS# CRRS25244666Listed by: GREAT INVESTMENTS, INC. $309,000Active1 beds 1 baths674 sq. ft.
522 Cedar Avenue #3, Long Beach, CA 90802
MLS# PW25215248Listed by: REALTY SOURCE INC. $499,000Active2 beds 2 baths989 sq. ft.
628 Daisy Avenue #311, Long Beach, CA 90802
MLS# CRRS25192825Listed by: CALIBER REAL ESTATE GROUP $385,000Active1 beds 1 baths495 sq. ft.
460 Golden Avenue #434, Long Beach, CA 90802
MLS# PW26020432Listed by: TAULER HUGHES CALIFORNIA REALTY $480,000Active2 beds 2 baths910 sq. ft.
327 Chestnut Avenue #201, Long Beach, CA 90802
MLS# CROC25101101Listed by: KELLER WILLIAMS PACIFIC ESTATE $225,000Active1 beds 1 baths371 sq. ft.
323 W 4th Street #407, Long Beach, CA 90802
MLS# SR25027192Listed by: TNG REAL ESTATE SERVICES INC. $475,000Active2 beds 2 baths1,073 sq. ft.
640 W 4th Street #205, Long Beach, CA 90802
MLS# 25-1731Listed by: WAHLUND & CO. REALTY GROUP $359,900Pending1 beds 1 baths654 sq. ft.
440 Chestnut Avenue #2C, Long Beach, CA 90802
MLS# PW22156970Listed by: REALTY MASTERS & ASSOCIATES $349,900Pending1 beds 1 baths574 sq. ft.
325 W 3rd Street #102, Long Beach, CA 90802
MLS# OC22116222Listed by: INTERPACIFIC ASSET MANAGEMENT
Local realty services provided by:CENTURY 21 Sierra Properties, CENTURY 21 Jordan-Link, CENTURY 21 Affiliated, CENTURY 21 Epic
The information being provided by California Regional MLS (Southern California) is for the consumer's personal, non-commercial use and may not be used for any purpose other than to identify prospective properties consumer may be interested in purchasing. Any information relating to real estate for sale referenced on this web site comes from the Internet Data Exchange (IDX) program of the California Regional MLS (Southern California). CENTURY 21 Jordan-Link is not a Multiple Listing Service (MLS), nor does it offer MLS access. This website is a service of CENTURY 21 Jordan-Link, a broker participant of California Regional MLS (Southern California). This web site may reference real estate listing(s) held by a brokerage firm other than the broker and/or agent who owns this web site.
The accuracy of all information, regardless of source, including but not limited to open house information, square footages and lot sizes, is deemed reliable but not guaranteed and should be personally verified through personal inspection by and/or with the appropriate professionals. The data contained herein is copyrighted by California Regional MLS (Southern California) and is protected by all applicable copyright laws. Any unauthorized dissemination of this information is in violation of copyright laws and is strictly prohibited.
Copyright 2021 California Regional MLS (Southern California). All rights reserved.
This information is deemed reliable but not guaranteed. You should rely on this information only to decide whether or not to further investigate a particular property. BEFORE MAKING ANY OTHER DECISION, YOU SHOULD PERSONALLY INVESTIGATE THE FACTS (e.g. square footage and lot size) with the assistance of an appropriate professional. You may use this information only to identify properties you may be interested in investigating further. All uses except for personal, non-commercial use in accordance with the foregoing purpose are prohibited. Redistribution or copying of this information, any photographs or video tours is strictly prohibited. This information is derived from the Internet Data Exchange (IDX) service provided by San Diego MLS®. Displayed property listings may be held by a brokerage firm other than the broker and/or agent responsible for this display. The information and any photographs and video tours and the compilation from which they are derived is protected by copyright. Compilation © 2020 San Diego MLS®, Inc.
Popular neighborhoods near West Village, Long Beach, CA
Zip codes near West Village, Long Beach, CA
- 90502 homes for sale
- 90710 homes for sale
- 90712 homes for sale
- 90731 homes for sale
- 90740 homes for sale
- 90744 homes for sale
- 90745 homes for sale
- 90746 homes for sale
- 90755 homes for sale
- 90802 homes for sale
- 90803 homes for sale
- 90804 homes for sale
- 90805 homes for sale
- 90806 homes for sale
- 90807 homes for sale
- 90808 homes for sale
- 90810 homes for sale
- 90813 homes for sale
- 90814 homes for sale
- 90815 homes for sale
Counties near West Village, Long Beach, CA
Protect your home and budget from life's surprises with an Assurant Home Warranty, backed by a partner that supports you through every step of homeownership. Explore Plans.
©2026 Century 21 Real Estate LLC. All rights reserved. CENTURY 21®, the CENTURY 21 Logo and C21® are service marks owned by Century 21 Real Estate LLC. Century 21 Real Estate LLC fully supports the principles of the Fair Housing Act and the Equal Opportunity Act. Each office is independently owned and operated. Listing information is deemed reliable but not guaranteed accurate.