- Blue Lagoon, Miami properties for sale
- Catalina Lakes, Miami properties for sale
- Dadeland, Miami properties for sale
- East Turnpike, Miami properties for sale
- Flagler Westside, Miami properties for sale
- Fountainbleau, Miami properties for sale
- Horse Country, Miami properties for sale
- Kendall North, Miami properties for sale
- North Coral Terrace, Miami properties for sale
- Olympia Heights, Miami properties for sale
- South Coral Terrace, Miami properties for sale
- Sunset East, Miami properties for sale
- Sunset West, Miami properties for sale
- Sweetwater, Miami properties for sale
- Tamiami, Miami properties for sale
- West Miami, Miami properties for sale
- West South Miami, Miami properties for sale
- West Sweetwater, Miami properties for sale
- Westchester, Miami properties for sale
- Westwood Lakes, Miami properties for sale
Westchester, FL - homes for sale
8 of 8 results displayed
- New
 $350,000Active2 beds 2 baths828 sq. ft.
1923 SW 107th Ave #103, Miami, FL 33165
MLS# A11969928Listed by: EXP REALTY SOUTH LLC 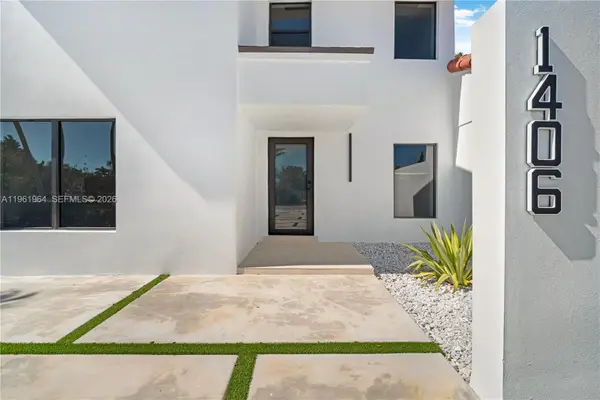 $780,000Active4 beds 3 baths1,920 sq. ft.
1406 SW 104th Ct, Miami, FL 33174
MLS# A11961964Listed by: KELLER WILLIAMS REALTY INTERNATIONAL LIFESTYLES $579,000Active3 beds 2 baths1,113 sq. ft.
3815 SW 82nd Ave #41, Miami, FL 33155
MLS# A11943172Listed by: LIFESTYLE INTERNATIONAL REALTY $650,000Active3 beds 2 baths1,815 sq. ft.
10365 SW 11th Ter #4-9B, Miami, FL 33174
MLS# A11948658Listed by: EXP REALTY SOUTH LLC $562,000Active3 beds 3 baths1,500 sq. ft.
8773 SW 36th St, Miami, FL 33165
MLS# A11938669Listed by: REALTY ONE GROUP EVOLUTION $650,000Active4 beds 3 baths1,996 sq. ft.
2524 SW 112th Ave, Miami, FL 33165
MLS# A11932829Listed by: KELLER WILLIAMS REALTY INTERNATIONAL LIFESTYLES $354,000Active2 beds 2 baths828 sq. ft.
1813 SW 107th Ave #2408, Miami, FL 33165
MLS# A11889547Listed by: LPT REALTY, LLC $425,000Active3 beds 3 baths1,347 sq. ft.
3806 SW 84th Ave #17-E, Miami, FL 33155
MLS# A11754449Listed by: THE K'S ELITE REALTY
Local realty services provided by:CENTURY 21 Hansen Realty
Information deemed reliable but not guaranteed. Information is provided, in part, by Greater Miami MLS. This information being provided is for consumer's personal, non-commercial use and may not be used for any other purpose other than to identify prospective properties consumers may be interested in purchasing.
Neighborhoods near Westchester, FL
Zip codes near Westchester, FL
- 33122 properties for sale
- 33126 properties for sale
- 33133 properties for sale
- 33134 properties for sale
- 33143 properties for sale
- 33144 properties for sale
- 33146 properties for sale
- 33155 properties for sale
- 33156 properties for sale
- 33165 properties for sale
- 33166 properties for sale
- 33172 properties for sale
- 33173 properties for sale
- 33174 properties for sale
- 33175 properties for sale
- 33176 properties for sale
- 33182 properties for sale
- 33183 properties for sale
- 33184 properties for sale
- 33185 properties for sale
Popular searches near Westchester, FL
- Coral Terrace properties for sale
- Doral properties for sale
- Fountainebleau properties for sale
- Glenvar Heights properties for sale
- Kendale Lakes properties for sale
- Kendale Lakes-Tamiami properties for sale
- Kendall properties for sale
- Kendall West properties for sale
- North Westside properties for sale
- Olympia Heights properties for sale
- Pinecrest properties for sale
- South Miami properties for sale
- South Westside properties for sale
- Sunset properties for sale
- Sweetwater properties for sale
- Tamiami properties for sale
- The Crossings properties for sale
- Virginia Gardens properties for sale
- West Miami properties for sale
- Westwood Lakes properties for sale
Protect your home and budget from life's surprises with an Assurant Home Warranty, backed by a partner that supports you through every step of homeownership. Explore Plans.
©2026 Century 21 Real Estate LLC. All rights reserved. CENTURY 21®, the CENTURY 21 Logo and C21® are service marks owned by Century 21 Real Estate LLC. Century 21 Real Estate LLC fully supports the principles of the Fair Housing Act and the Equal Opportunity Act. Each office is independently owned and operated. Listing information is deemed reliable but not guaranteed accurate.