- Adams homes for sale
- Arcadia homes for sale
- Carmel homes for sale
- Cicero homes for sale
- Clay homes for sale
- Delaware homes for sale
- Jackson homes for sale
- Marion homes for sale
- Meridian Hills homes for sale
- Noblesville Township homes for sale
- Noblesville homes for sale
- Perry homes for sale
- Pike homes for sale
- Sheridan homes for sale
- Washington homes for sale
- Westfield homes for sale
- Westfield Washington homes for sale
- Whitestown homes for sale
- Worth homes for sale
- Zionsville homes for sale
46074, IN - homes for sale
55 of 55 results displayed
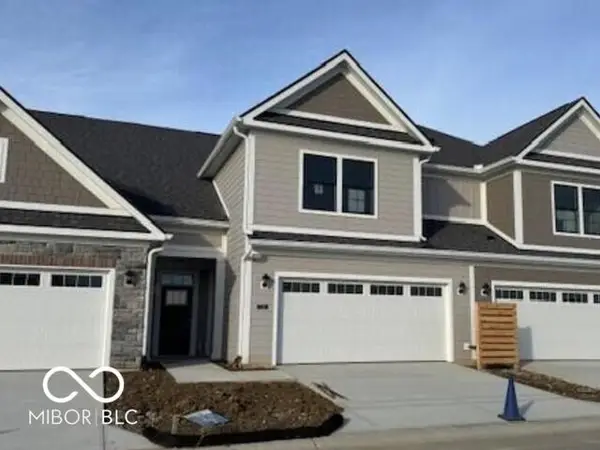
 $427,000Pending4 beds 4 baths2,390 sq. ft.
1776 Gualandri Lane, Westfield, IN 46074
MLS# 22090859Listed by: PULTE REALTY OF INDIANA, LLC- Open Sat, 12 to 4pmNew
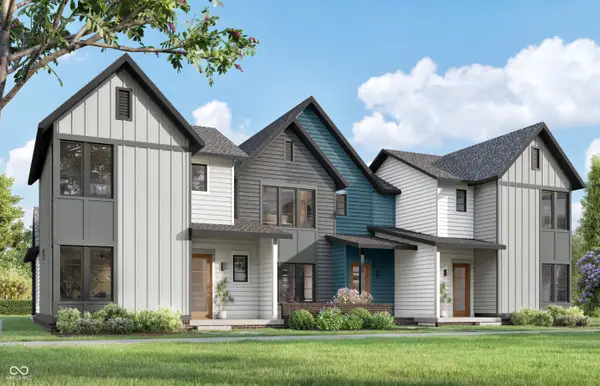
 $345,000Active3 beds 3 baths1,854 sq. ft.
681 Garrow Drive, Westfield, IN 46074
MLS# 22090195Listed by: PULTE REALTY OF INDIANA, LLC - Open Sat, 12 to 2pmNew
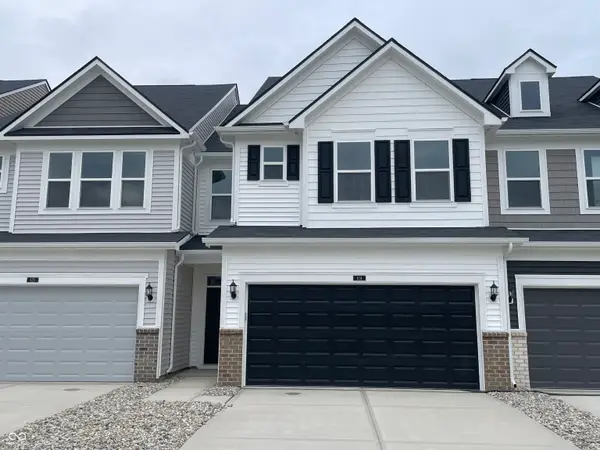
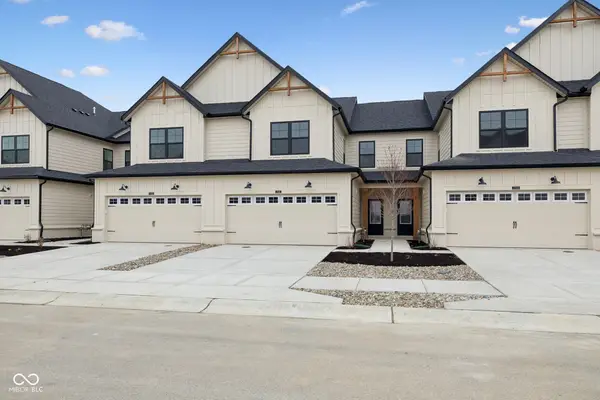
 $455,000Active4 beds 4 baths1,980 sq. ft.
14574 Hanford Lane, Carmel, IN 46074
MLS# 22088162Listed by: F.C. TUCKER COMPANY - New
 $325,000Active3 beds 3 baths1,875 sq. ft.
15570 Clearbrook Street, Westfield, IN 46074
MLS# 22088576Listed by: VIEWPOINT REALTY GROUP, LLC  $305,000Active3 beds 3 baths1,622 sq. ft.
3516 Thomas Jefferson Street, Westfield, IN 46074
MLS# 22051161Listed by: COMPASS INDIANA, LLC $499,000Active3 beds 3 baths1,849 sq. ft.
16518 Deerpath Way, Westfield, IN 46074
MLS# 22087651Listed by: STACEY WILLIS $264,900Active2 beds 2 baths1,197 sq. ft.
3491 Thomas Jefferson Street, Westfield, IN 46074
MLS# 22088697Listed by: TRUEBLOOD REAL ESTATE $464,000Active3 beds 4 baths1,980 sq. ft.
14531 Elsmere Lane, Carmel, IN 46074
MLS# 22088764Listed by: PULTE REALTY OF INDIANA, LLC $379,000Active2 beds 3 baths1,393 sq. ft.
17448 Carrier Drive, Westfield, IN 46074
MLS# 22088776Listed by: BERKSHIRE HATHAWAY HOME $394,000Active2 beds 3 baths1,428 sq. ft.
17452 Carrier Drive, Westfield, IN 46074
MLS# 22088522Listed by: BERKSHIRE HATHAWAY HOME
 $331,000Active3 beds 3 baths1,864 sq. ft.
665 Bucksport Lane, Westfield, IN 46074
MLS# 22086894Listed by: CENTURY 21 SCHEETZ $369,900Pending3 beds 3 baths2,216 sq. ft.
15428 Smithfield Drive, Westfield, IN 46074
MLS# 22087116Listed by: CENTURY 21 SCHEETZ $285,000Pending2 beds 2 baths1,418 sq. ft.
19353 Grassy Branch Road, Westfield, IN 46074
MLS# 22080766Listed by: EXP REALTY, LLC $325,000Active3 beds 3 baths1,854 sq. ft.
18702 Terra Vista Place, Westfield, IN 46074
MLS# 22079612Listed by: BERKSHIRE HATHAWAY HOME $569,500Active3 beds 4 baths2,030 sq. ft.
411 Jersey Street, Westfield, IN 46074
MLS# 22084161Listed by: KELLER WILLIAMS INDY METRO NE- Open Sat, 12 to 3pm
 $462,841Active3 beds 3 baths1,967 sq. ft.
2412 N Keenan Circle #Lot 23, Westfield, IN 46074
MLS# 22085673Listed by: ANDY MCINTYRE  $350,000Pending3 beds 3 baths1,854 sq. ft.
663 Garrow Drive, Westfield, IN 46074
MLS# 22087026Listed by: PULTE REALTY OF INDIANA, LLC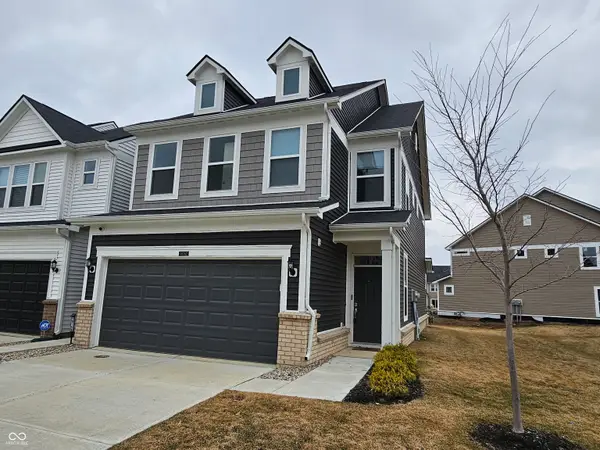 $315,000Active3 beds 3 baths1,896 sq. ft.
18762 Terra Vista Place, Westfield, IN 46074
MLS# 22084678Listed by: ENVOY REAL ESTATE, LLC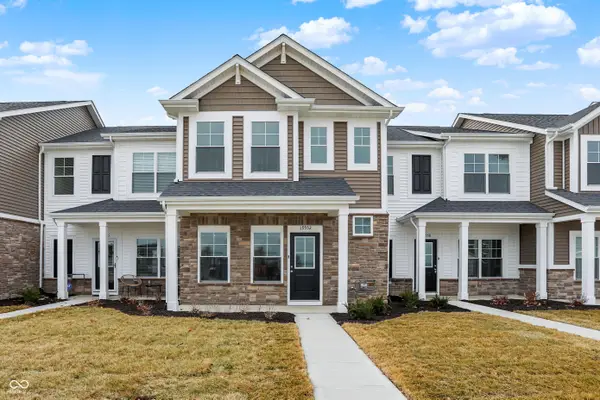 $313,984Active3 beds 3 baths1,574 sq. ft.
19552 Northwest Drive, Westfield, IN 46074
MLS# 22085590Listed by: F.C. TUCKER COMPANY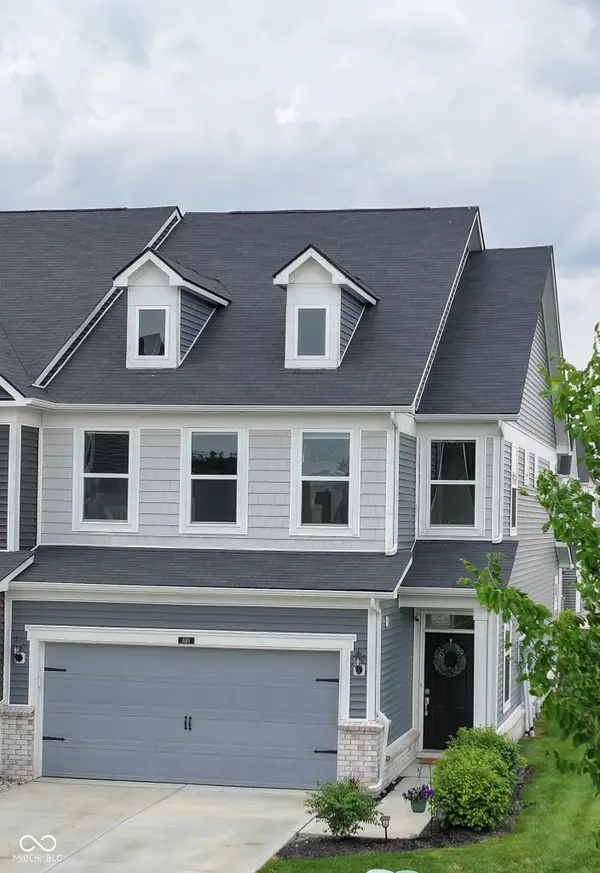 $329,000Active3 beds 3 baths1,896 sq. ft.
640 Axford Bay Drive, Westfield, IN 46074
MLS# 22085676Listed by: RE/MAX REALTY SERVICES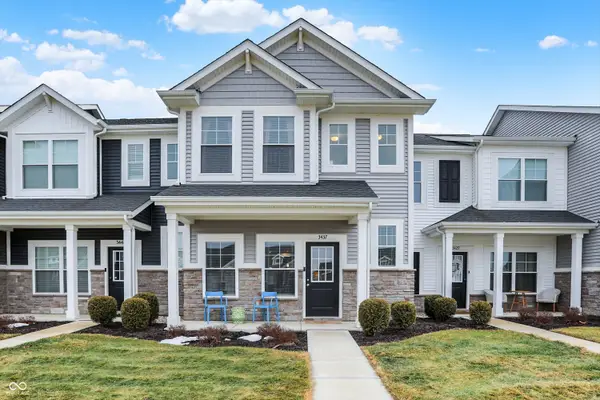 $289,000Pending3 beds 3 baths1,622 sq. ft.
3437 Lehigh Avenue, Westfield, IN 46074
MLS# 22085437Listed by: BERKSHIRE HATHAWAY HOME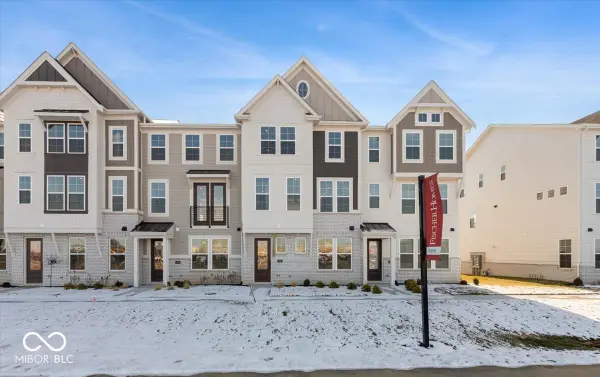 $434,990Active4 beds 4 baths2,197 sq. ft.
428 Elite Street, Westfield, IN 46074
MLS# 22085428Listed by: HMS REAL ESTATE, LLC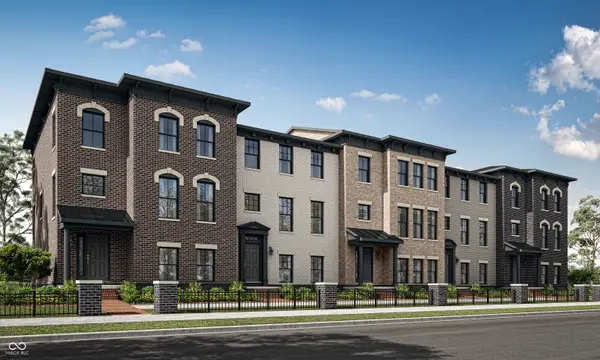 $474,995Active3 beds 4 baths2,073 sq. ft.
1575 Hamilton Ridge Road, Westfield, IN 46074
MLS# 22084937Listed by: COMPASS INDIANA, LLC $494,995Active3 beds 4 baths2,162 sq. ft.
1581 Hamilton Ridge Road, Westfield, IN 46074
MLS# 22084949Listed by: COMPASS INDIANA, LLC $529,995Active3 beds 4 baths2,295 sq. ft.
1563 Hamilton Ridge Road, Westfield, IN 46074
MLS# 22084963Listed by: COMPASS INDIANA, LLC $569,995Pending3 beds 4 baths2,240 sq. ft.
1545 Hamilton Ridge Road, Westfield, IN 46074
MLS# 22084969Listed by: COMPASS INDIANA, LLC- Open Sat, 12 to 4pm
 $330,000Active3 beds 3 baths1,854 sq. ft.
669 Garrow Drive, Westfield, IN 46074
MLS# 22084210Listed by: PULTE REALTY OF INDIANA, LLC 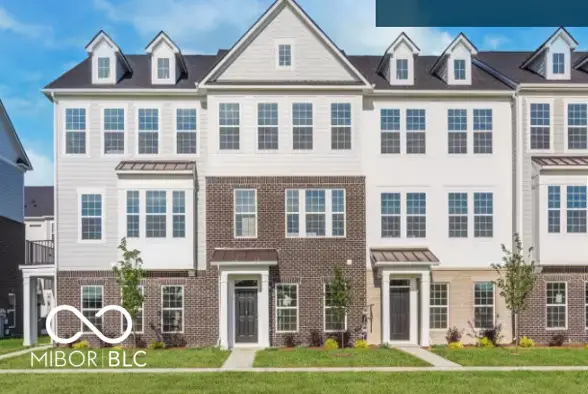 $460,000Pending3 beds 4 baths1,980 sq. ft.
14513 Elsmere Lane, Carmel, IN 46074
MLS# 22082935Listed by: PULTE REALTY OF INDIANA, LLC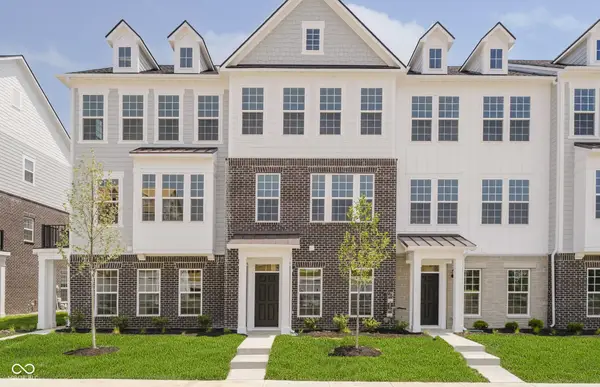 $438,000Pending4 beds 4 baths1,980 sq. ft.
14518 Elsmere Lane, Carmel, IN 46074
MLS# 22082901Listed by: PULTE REALTY OF INDIANA, LLC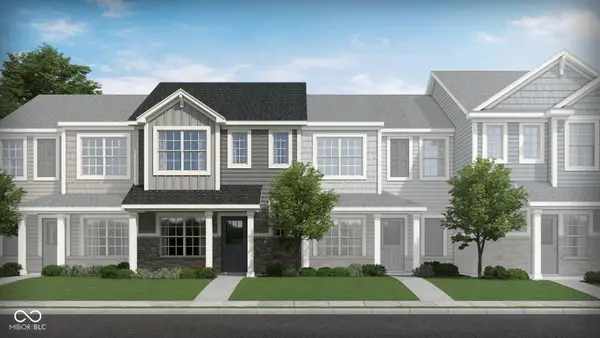 $288,530Active2 beds 2 baths1,394 sq. ft.
3419 E 196th Street, Westfield, IN 46074
MLS# 22082194Listed by: F.C. TUCKER COMPANY $330,000Pending3 beds 3 baths1,854 sq. ft.
656 Garrow Drive, Westfield, IN 46074
MLS# 22081558Listed by: PULTE REALTY OF INDIANA, LLC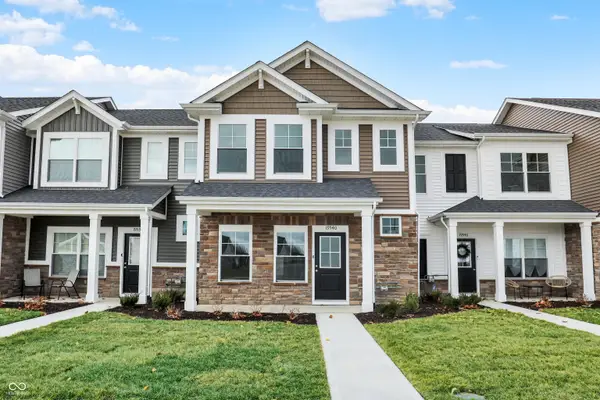 $315,836Pending3 beds 3 baths1,574 sq. ft.
19540 Northwest Drive, Westfield, IN 46074
MLS# 22081511Listed by: F.C. TUCKER COMPANY $424,995Active3 beds 3 baths2,346 sq. ft.
1883 Werner Lane, Westfield, IN 46074
MLS# 22081002Listed by: COMPASS INDIANA, LLC $349,995Pending3 beds 4 baths1,710 sq. ft.
1912 Werner Lane, Westfield, IN 46074
MLS# 22081003Listed by: COMPASS INDIANA, LLC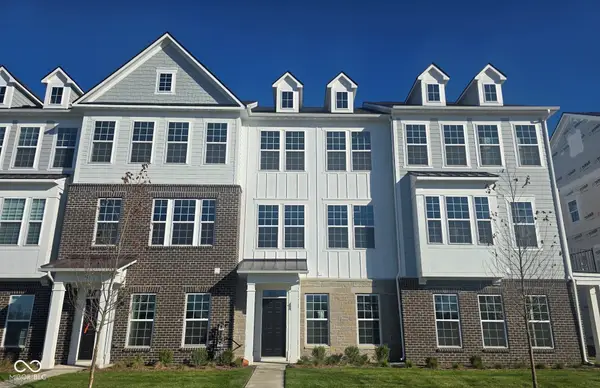 $430,000Pending3 beds 4 baths1,980 sq. ft.
14525 Elsmere Lane, Carmel, IN 46074
MLS# 22080370Listed by: PULTE REALTY OF INDIANA, LLC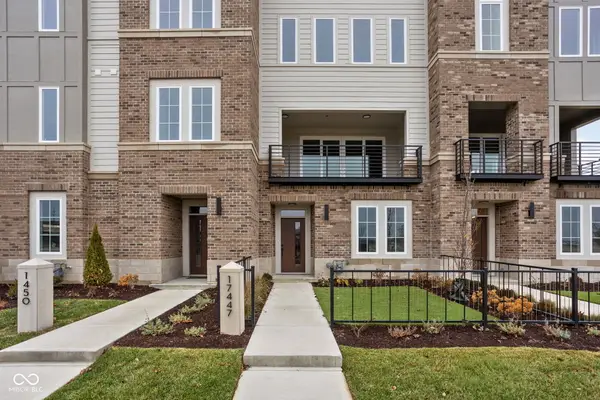 $448,000Pending3 beds 4 baths2,102 sq. ft.
17447 Carrier Drive, Westfield, IN 46074
MLS# 22080213Listed by: BERKSHIRE HATHAWAY HOME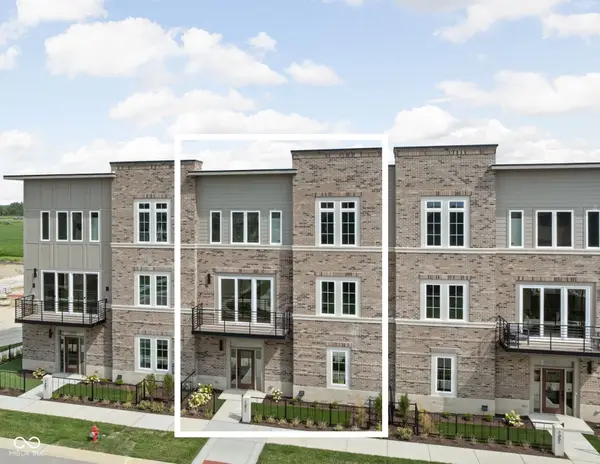 $446,000Active3 beds 3 baths1,993 sq. ft.
1471 Whistle Way, Westfield, IN 46074
MLS# 22080212Listed by: BERKSHIRE HATHAWAY HOME $467,000Active3 beds 3 baths2,104 sq. ft.
1481 Whistle Way, Westfield, IN 46074
MLS# 22080077Listed by: BERKSHIRE HATHAWAY HOME $418,000Pending3 beds 3 baths1,993 sq. ft.
1461 Whistle Way, Westfield, IN 46074
MLS# 22080009Listed by: BERKSHIRE HATHAWAY HOME $388,000Pending2 beds 3 baths1,583 sq. ft.
17443 Carrier Drive, Westfield, IN 46074
MLS# 22079822Listed by: BERKSHIRE HATHAWAY HOME $530,000Active3 beds 4 baths2,106 sq. ft.
189 Midland Trace Loop, Westfield, IN 46074
MLS# 22075921Listed by: STACEY WILLIS- Open Fri, 12 to 4pm
 $345,990Active3 beds 3 baths1,778 sq. ft.
17498 Ebling Trail, Westfield, IN 46062
MLS# 22075365Listed by: M/I HOMES OF INDIANA, L.P.  $339,000Pending3 beds 4 baths2,210 sq. ft.
17252 Henslow Drive, Westfield, IN 46074
MLS# 22050146Listed by: BERKSHIRE HATHAWAY HOME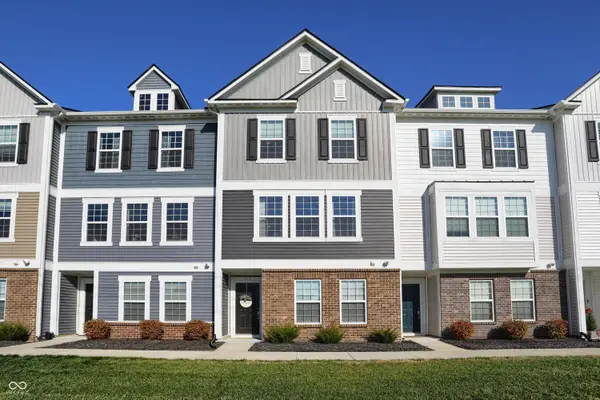 $299,900Active3 beds 3 baths1,980 sq. ft.
717 Axford Bay Drive, Westfield, IN 46074
MLS# 22073722Listed by: CENTURY 21 SCHEETZ $384,990Pending3 beds 3 baths2,025 sq. ft.
17514 Ebling Trail, Westfield, IN 46062
MLS# 22071975Listed by: M/I HOMES OF INDIANA, L.P. $275,449Pending2 beds 2 baths1,197 sq. ft.
19558 Northwest Drive, Westfield, IN 46074
MLS# 22079444Listed by: F.C. TUCKER COMPANY $345,000Pending3 beds 4 baths2,337 sq. ft.
17379 Lillian Street, Westfield, IN 46074
MLS# 22067987Listed by: CENTURY 21 SCHEETZ $274,900Active2 beds 2 baths1,418 sq. ft.
3412 Thomas Jefferson Street, Westfield, IN 46074
MLS# 22061143Listed by: REALTY WEALTH ADVISORS $263,186Active2 beds 2 baths1,197 sq. ft.
19559 Grassy Branch Road, Westfield, IN 46074
MLS# 22057795Listed by: F.C. TUCKER COMPANY $269,271Pending2 beds 2 baths1,394 sq. ft.
19547 Grassy Branch Road, Westfield, IN 46074
MLS# 22055735Listed by: F.C. TUCKER COMPANY- Open Sat, 12 to 3pm
 $478,280Active2 beds 3 baths1,785 sq. ft.
14890 E Keenan Circle #Lot 36, Westfield, IN 46074
MLS# 22054821Listed by: ANDY MCINTYRE - Open Sat, 12 to 3pm
 $449,900Active2 beds 3 baths1,853 sq. ft.
14896 E Keenan Circle #Lot 35, Westfield, IN 46074
MLS# 22054656Listed by: ANDY MCINTYRE - Open Sat, 12 to 3pm
 $448,501Active3 beds 3 baths1,967 sq. ft.
14866 E Keenan Circle #Lot 38, Westfield, IN 46074
MLS# 22039786Listed by: ANDY MCINTYRE - Open Sat, 12 to 5pm
 $542,000Active3 beds 3 baths1,849 sq. ft.
16375 Burlwood Drive, Westfield, IN 46074
MLS# 22032281Listed by: HIGHGARDEN REAL ESTATE 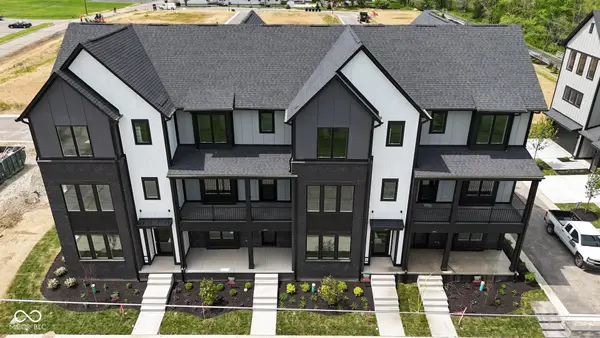 $484,000Active3 beds 4 baths2,106 sq. ft.
367 S Cherry Street, Westfield, IN 46074
MLS# 21954759Listed by: STACEY WILLIS
Local realty services provided by:CENTURY 21 Scheetz
Popular searches near 46074
Popular neighborhoods near 46074
- Brookshire, Carmel homes for sale
- Centennial, Westfield homes for sale
- College Park, Indianapolis homes for sale
- Countryside, Westfield homes for sale
- Driftwood Hills, Indianapolis homes for sale
- Home Place, Indianapolis homes for sale
- Kingsley, Noblesville homes for sale
- Meridian Highlands, Indianapolis homes for sale
- Mill Grove, Noblesville homes for sale
- Nora, Indianapolis homes for sale
- Oak Manor, Westfield homes for sale
- Prairie Crossing of Noblesville, Noblesville homes for sale
- Sherwood Forest, Indianapolis homes for sale
- South Harbour, Noblesville homes for sale
- Springmill Villages, Carmel homes for sale
- Stone Harbour, Noblesville homes for sale
- The Bridgewater, Carmel homes for sale
- The Village of Westclay, Carmel homes for sale
- The Westons, Carmel homes for sale
- Viking Meadows, Westfield homes for sale
Counties near Westfield, 46074
- Boone County homes for sale
- Carroll County homes for sale
- Clinton County homes for sale
- Delaware County homes for sale
- Grant County homes for sale
- Hamilton County homes for sale
- Hancock County homes for sale
- Hendricks County homes for sale
- Henry County homes for sale
- Howard County homes for sale
- Johnson County homes for sale
- Madison County homes for sale
- Marion County homes for sale
- Montgomery County homes for sale
- Morgan County homes for sale
- Putnam County homes for sale
- Rush County homes for sale
- Shelby County homes for sale
- Tippecanoe County homes for sale
- Tipton County homes for sale
Protect your home and budget from life's surprises with an Assurant Home Warranty, backed by a partner that supports you through every step of homeownership. Explore Plans.
©2026 Century 21 Real Estate LLC. All rights reserved. CENTURY 21®, the CENTURY 21 Logo and C21® are service marks owned by Century 21 Real Estate LLC. Century 21 Real Estate LLC fully supports the principles of the Fair Housing Act and the Equal Opportunity Act. Each office is independently owned and operated. Listing information is deemed reliable but not guaranteed accurate.