- Alamo Heights, San Antonio homes for sale
- Alta Vista, San Antonio homes for sale
- Beacon Hill, San Antonio homes for sale
- Central San Antonio, San Antonio homes for sale
- Dignowity Hill, San Antonio homes for sale
- Downtown, San Antonio homes for sale
- East San Antonio, San Antonio homes for sale
- Five Points, San Antonio homes for sale
- Gardendale, San Antonio homes for sale
- Government Hill, San Antonio homes for sale
- Harvard Place / Eastlawn, San Antonio homes for sale
- Jefferson Heights, San Antonio homes for sale
- Mahncke Park, San Antonio homes for sale
- Monte Vista, San Antonio homes for sale
- Monte Vista Terrace, San Antonio homes for sale
- Olmos Park, San Antonio homes for sale
- River Road, San Antonio homes for sale
- Terrell Hills, San Antonio homes for sale
- Tobin Hill, San Antonio homes for sale
- Uptown, San Antonio homes for sale
Westfort Alliance, San Antonio, TX - homes for sale
3 of 3 results displayed
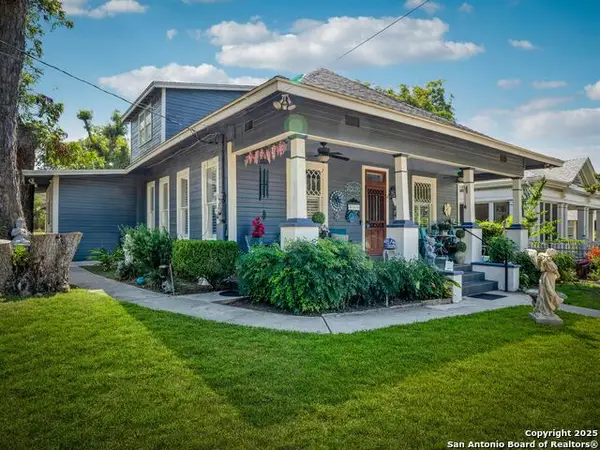 $699,999Active3 beds 3 baths3,030 sq. ft.
240 Post Avenue, San Antonio, TX 78215
MLS# 1912606Listed by: KUPER SOTHEBY'S INT'L REALTY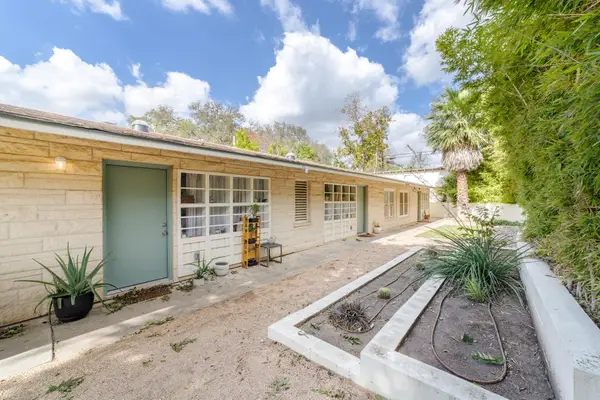 $649,999Active4 beds 4 baths2,472 sq. ft.
239 Brahan Blvd, San Antonio, TX 78215
MLS# 6076415Listed by: DEN PROPERTY GROUP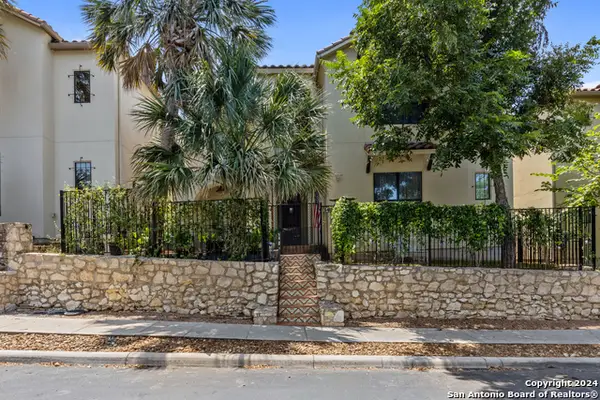 $800,000Active4 beds 4 baths3,074 sq. ft.
246 Brahan Blvd, San Antonio, TX 78215
MLS# 1920014Listed by: KUPER SOTHEBY'S INT'L REALTY
Local realty services provided by:CENTURY 21 Scott Myers Realtors, CENTURY 21 North East
Popular neighborhoods near Westfort Alliance, San Antonio, TX
Zip codes near Westfort Alliance, San Antonio, TX
- 78201 homes for sale
- 78202 homes for sale
- 78203 homes for sale
- 78204 homes for sale
- 78205 homes for sale
- 78206 homes for sale
- 78207 homes for sale
- 78208 homes for sale
- 78209 homes for sale
- 78210 homes for sale
- 78212 homes for sale
- 78213 homes for sale
- 78215 homes for sale
- 78218 homes for sale
- 78219 homes for sale
- 78220 homes for sale
- 78225 homes for sale
- 78228 homes for sale
- 78234 homes for sale
- 78237 homes for sale
Counties near Westfort Alliance, San Antonio, TX
- Atascosa County homes for sale
- Bandera County homes for sale
- Bexar County homes for sale
- Blanco County homes for sale
- Caldwell County homes for sale
- Comal County homes for sale
- DeWitt County homes for sale
- Frio County homes for sale
- Gillespie County homes for sale
- Gonzales County homes for sale
- Guadalupe County homes for sale
- Hays County homes for sale
- Karnes County homes for sale
- Kendall County homes for sale
- Kerr County homes for sale
- Live Oak County homes for sale
- McMullen County homes for sale
- Medina County homes for sale
- Travis County homes for sale
- Wilson County homes for sale
Protect your home and budget from life's surprises with an Assurant Home Warranty, backed by a partner that supports you through every step of homeownership. Explore Plans.
©2026 Century 21 Real Estate LLC. All rights reserved. CENTURY 21®, the CENTURY 21 Logo and C21® are service marks owned by Century 21 Real Estate LLC. Century 21 Real Estate LLC fully supports the principles of the Fair Housing Act and the Equal Opportunity Act. Each office is independently owned and operated. Listing information is deemed reliable but not guaranteed accurate.