- Audubon Park, Orlando homes for sale
- Baldwin Park, Orlando homes for sale
- Central Business District, Orlando homes for sale
- College Park, Orlando homes for sale
- Colonialtown North, Orlando homes for sale
- Colonialtown South, Orlando homes for sale
- Coytown, Orlando homes for sale
- East Central Park, Orlando homes for sale
- Fairview Shores, Winter Park homes for sale
- Fern Park, Casselberry homes for sale
- Goldenrod, Goldenrod homes for sale
- Lake Eola Heights, Orlando homes for sale
- Lake Shore Village, Orlando homes for sale
- Lake Underhill, Orlando homes for sale
- Lawson, Orlando homes for sale
- North Orange, Orlando homes for sale
- Orwin Manor, Orlando homes for sale
- South Eola, Orlando homes for sale
- Thornton Park, Orlando homes for sale
- Uptown, Orlando homes for sale
Winter Park, FL - homes for sale
5 of 5 results displayed
 $7,150,000Active-- beds -- baths12,500 sq. ft.
2412 Chantilly Avenue, WINTER PARK, FL 32789
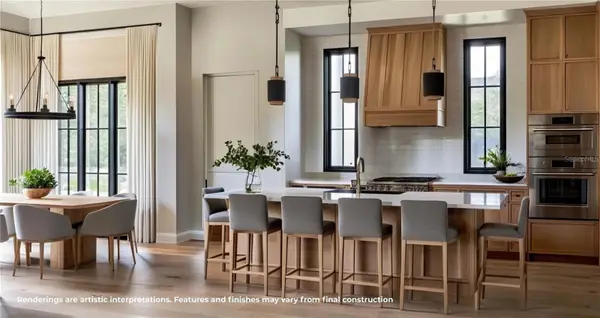
MLS# O6383456Listed by: REAL BROKER, LLC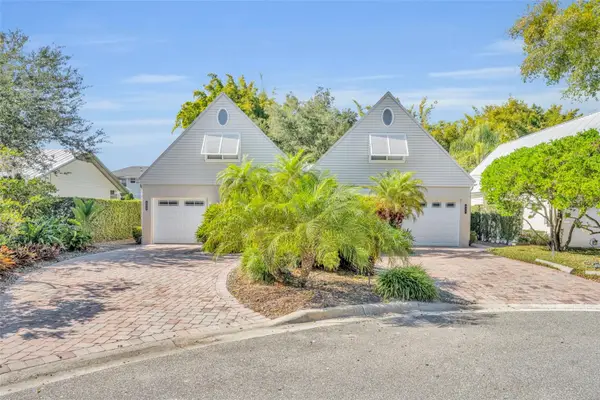 $1,100,000Pending6 beds 4 baths2,915 sq. ft.
831/833 Huntington Court, WINTER PARK, FL 32789
MLS# O6378801Listed by: FANNIE HILLMAN & ASSOCIATES $650,000Active5 beds 3 baths1,917 sq. ft.
352 Cambridge Boulevard, WINTER PARK, FL 32789
MLS# O6377540Listed by: COLDWELL BANKER RESIDENTIAL RE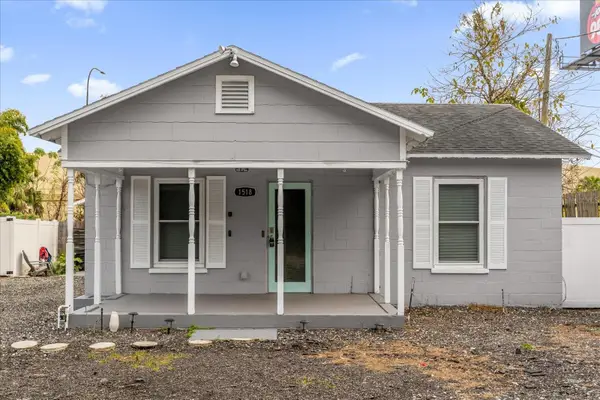 $415,000Active3 beds 2 baths1,197 sq. ft.
1518 Pinewood Drive, WINTER PARK, FL 32789
MLS# O6369600Listed by: KELLER WILLIAMS REALTY AT THE PARKS $645,000Active5 beds 3 baths2,472 sq. ft.
2612 Roxbury Road, WINTER PARK, FL 32789
MLS# S5139410Listed by: EXP REALTY LLC
Local realty services provided by:CENTURY 21 Carioti
The information being provided by Stellar Mls is for the consumer's personal, non-commercial use and may not be used for any purpose other than to identify prospective properties consumer may be interested in purchasing. Any information relating to real estate for sale referenced on this web site comes from the Internet Data Exchange (IDX) program of the Stellar Mls. CENTURY 21 Carioti is not a Multiple Listing Service (MLS), nor does it offer MLS access. This website is a service of CENTURY 21 Carioti, a broker participant of Stellar Mls. This web site may reference real estate listing(s) held by a brokerage firm other than the broker and/or agent who owns this web site.
The accuracy of all information, regardless of source, including but not limited to open house information, square footages and lot sizes, is deemed reliable but not guaranteed and should be personally verified through personal inspection by and/or with the appropriate professionals. The data contained herein is copyrighted by Stellar Mls and is protected by all applicable copyright laws. Any unauthorized dissemination of this information is in violation of copyright laws and is strictly prohibited.
Properties in listings may have been sold or may no longer be available.
Copyright 2026 Stellar Mls. All rights reserved.
Neighborhoods near Winter Park, FL
Zip codes near Winter Park, FL
- 32701 homes for sale
- 32707 homes for sale
- 32708 homes for sale
- 32714 homes for sale
- 32730 homes for sale
- 32750 homes for sale
- 32751 homes for sale
- 32789 homes for sale
- 32792 homes for sale
- 32801 homes for sale
- 32803 homes for sale
- 32804 homes for sale
- 32805 homes for sale
- 32806 homes for sale
- 32807 homes for sale
- 32808 homes for sale
- 32810 homes for sale
- 32812 homes for sale
- 32814 homes for sale
- 32817 homes for sale
Popular searches near Winter Park, FL
- Altamonte Springs homes for sale
- Azalea Park homes for sale
- Casselberry homes for sale
- Casselberry-Altamonte Springs homes for sale
- Conway homes for sale
- Eatonville homes for sale
- Edgewood homes for sale
- Fairview Shores homes for sale
- Fern Park homes for sale
- Forest City homes for sale
- Goldenrod homes for sale
- Holden Heights homes for sale
- Holden Lakes homes for sale
- Lockhart homes for sale
- Longwood homes for sale
- Maitland homes for sale
- Orlovista homes for sale
- Pine Hills homes for sale
- Rio Pinar homes for sale
- Union Park homes for sale
Protect your home and budget from life's surprises with an Assurant Home Warranty, backed by a partner that supports you through every step of homeownership. Explore Plans.
©2026 Century 21 Real Estate LLC. All rights reserved. CENTURY 21®, the CENTURY 21 Logo and C21® are service marks owned by Century 21 Real Estate LLC. Century 21 Real Estate LLC fully supports the principles of the Fair Housing Act and the Equal Opportunity Act. Each office is independently owned and operated. Listing information is deemed reliable but not guaranteed accurate.