- Avon properties for sale
- Basalt properties for sale
- Beaver Creek properties for sale
- Bond properties for sale
- Copper Mountain properties for sale
- Dotsero properties for sale
- Eagle properties for sale
- Eagle-Gypsum properties for sale
- Edwards properties for sale
- El Jebel properties for sale
- Frisco properties for sale
- Gypsum properties for sale
- Kremmling properties for sale
- McCoy properties for sale
- Minturn properties for sale
- Minturn-Red Cliff properties for sale
- Red Cliff properties for sale
- Toponas properties for sale
- Vail properties for sale
- Wolcott properties for sale
81655, CO - homes for sale
17 of 17 results displayed
- New
 $775,000Active10.01 Acres
384 Jouflas Ranch Road, Wolcott, CO 81655
MLS# 1013203Listed by: SLIFER SMITH & FRAMPTON- LIONSHEAD  $436,000Active10.01 Acres
116 Travis Road, Edwards, CO 81632
MLS# 1013100Listed by: SLIFER SMITH & FRAMPTON- 230 BRIDGE STREET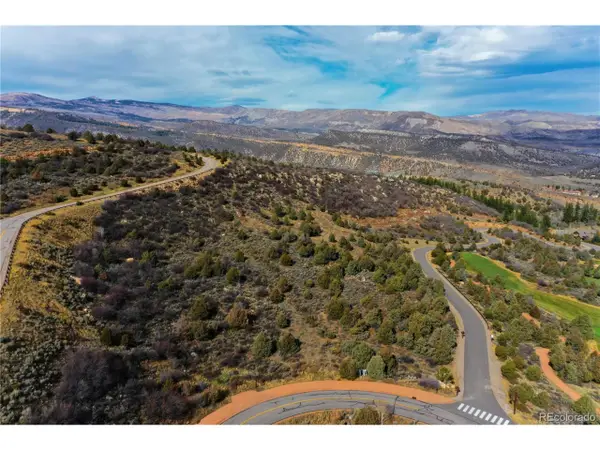 $650,000Active2.88 Acres
303 Red Sky, Wolcott, CO 81655
MLS# 7222722Listed by: Cornerstone Real Estate Co, LLC $950,000Pending2.53 Acres
65 Eagle Feather, Wolcott, CO 81655
MLS# 1012896Listed by: SLIFER SMITH & FRAMPTON- LIONSHEAD $899,000Active0.81 Acres
53 Juniper Trail, Wolcott, CO 81655
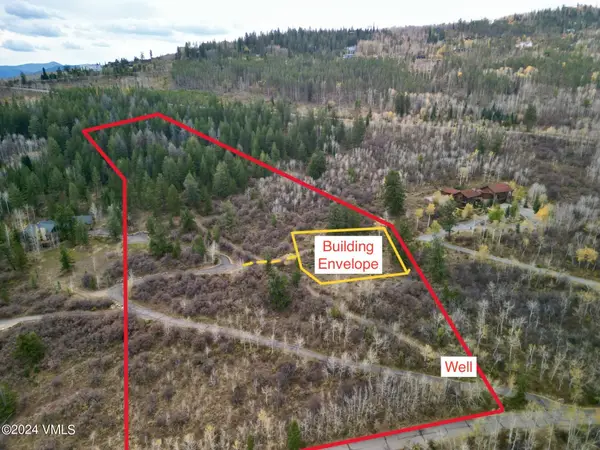
MLS# 1012846Listed by: SLIFER SMITH & FRAMPTON - ARROWHEAD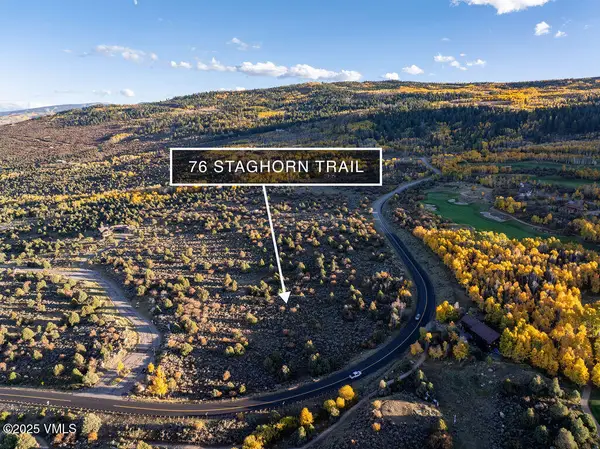 $1,995,000Active10.34 Acres
76 Stag Horn Trail, Wolcott, CO 81655
MLS# 1012845Listed by: SLIFER SMITH & FRAMPTON - ARROWHEAD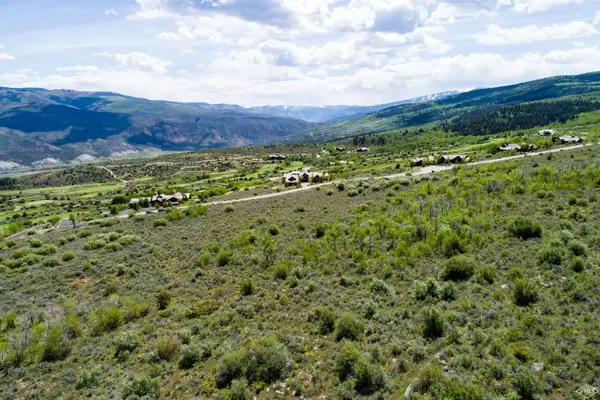 $5,950,000Pending284.01 Acres
3000 Red Sky Ranch Road, Wolcott, CO 81655
MLS# 1012776Listed by: LIV SOTHEBY'S INT. REALTY-VAIL MOUNTAIN HAUS $450,000Active1.84 Acres
548 Big Dipper Road, Wolcott, CO 81655
MLS# 1012735Listed by: SLIFER SMITH & FRAMPTON/FOUR SEASONS $3,775,000Active5 beds 6 baths5,440 sq. ft.
948 Wolcott Springs Road, Wolcott, CO 81655
MLS# 1012558Listed by: SLIFER SMITH & FRAMPTON/AVON $10,500,000Active4 beds 6 baths8,008 sq. ft.
909 Ute Forest Lane, Edwards, CO 81632
MLS# 1012477Listed by: SLIFER SMITH & FRAMPTON/FOUR SEASONS $8,450,000Active6 beds 6 baths8,656 sq. ft.
6903 Bellyache Ridge Rd, Wolcott, CO 81655
MLS# 7069795Listed by: Mossy Oak Properties / Mountain Ranch and Home Brokers $5,100,000Active5 beds 8 baths6,954 sq. ft.
325 Jouflas Ranch Road, Wolcott, CO 81655
MLS# 1012388Listed by: SLIFER SMITH & FRAMPTON - ARROWHEAD $3,195,000Active4 beds 6 baths4,497 sq. ft.
4454 Bellyache Ridge Road, Wolcott, CO 81655
MLS# 1012310Listed by: SLIFER SMITH & FRAMPTON - HYATT $799,000Active35.16 Acres
1463 Wolcott Springs Road, Wolcott, CO 81655
MLS# 1012261Listed by: BERKSHIRE HATHAWAY-VILLA M. $675,000Active0.9 Acres
160 Wildflower Lane, Wolcott, CO 81655
MLS# 1011990Listed by: LIV SOTHEBY'S INT. REALTY- VAIL BRIDGE STREET $2,995,000Pending4 beds 6 baths3,734 sq. ft.
379 Wolcott Springs Road, Wolcott, CO 81655
MLS# 1011404Listed by: SLIFER SMITH & FRAMPTON - ARROWHEAD $690,000Active10.02 Acres
305 Jouflas Ranch Road, Wolcott, CO 81655
MLS# 1009333Listed by: COMPASS
Local realty services provided by:CENTURY 21 Top Dog Properties, CENTURY 21 Cornerstone
The real estate listing information and related content displayed on this site is provided exclusively for consumer's personal, non-commercial use and may not be used for any purpose other than to identify prospective properties consumers may be interested in purchasing. This information and related content is deemed reliable but is not guaranteed accurate by Information and Real Estate Services, LLC.
Information source: Information and Real Estate Services, LLC. Provided for limited non-commercial use only under IRES Rules © Copyright IRES. The information being provided by Information and Real Estate Services is for the consumer's personal, non-commercial use and may not be used for any purpose other than to identify prospective properties consumer may be interested in purchasing. Any information relating to real estate for sale referenced on this web site comes from the Internet Data Exchange (IDX) program of the Information and Real Estate Services. This web site may reference real estate listing(s) held by a brokerage firm other than the broker and/or agent who owns this web site.
The accuracy of all information, regardless of source, including but not limited to open house information, square footages and lot sizes, is deemed reliable but not guaranteed and should be personally verified through personal inspection by and/or with the appropriate professionals. The data contained herein is copyrighted by Information and Real Estate Services and is protected by all applicable copyright laws. Any unauthorized dissemination of this information is in violation of copyright laws and is strictly prohibited.
Popular searches near 81655
Popular neighborhoods near 81655
- Allenspark Vicinity, Lyons properties for sale
- Coal Creek, Golden properties for sale
- Cold Creek Canyon, Coal Creek properties for sale
- Eagles Nest, Silverthorne properties for sale
- Empire, Empire properties for sale
- Georgetown, Georgetown properties for sale
- Hiwan, Evergreen properties for sale
- Idaho Springs, Idaho Springs properties for sale
- Keystone, Dillon properties for sale
- Nederland, Nederland properties for sale
- River Valley Ranch, Carbondale properties for sale
- Ruby Ranch, Silverthorne properties for sale
- Soda Creek, Evergreen properties for sale
- Soda Creek at Lake Dillon, Dillon properties for sale
- South Forty, Silverthorne properties for sale
- Summit Cove, Dillon properties for sale
- The Highlands, Breckenridge properties for sale
- The Ponds at Blue River, Silverthorne properties for sale
- The River Course at Keystone, Dillon properties for sale
- Ward Vicinity, Ward properties for sale
Counties near Wolcott, 81655
- Boulder County properties for sale
- Broomfield County properties for sale
- Chaffee County properties for sale
- Clear Creek County properties for sale
- Delta County properties for sale
- Denver County properties for sale
- Eagle County properties for sale
- Garfield County properties for sale
- Gilpin County properties for sale
- Grand County properties for sale
- Gunnison County properties for sale
- Jackson County properties for sale
- Jefferson County properties for sale
- Lake County properties for sale
- Larimer County properties for sale
- Park County properties for sale
- Pitkin County properties for sale
- Rio Blanco County properties for sale
- Routt County properties for sale
- Summit County properties for sale
©2025 Century 21 Real Estate LLC. All rights reserved. CENTURY 21®, the CENTURY 21 Logo and C21® are service marks owned by Century 21 Real Estate LLC. Century 21 Real Estate LLC fully supports the principles of the Fair Housing Act and the Equal Opportunity Act. Each office is independently owned and operated. Listing information is deemed reliable but not guaranteed accurate.
©2025 Century 21 Real Estate LLC. All rights reserved. CENTURY 21®, the CENTURY 21 Logo and C21® are service marks owned by Century 21 Real Estate LLC. Century 21 Real Estate LLC fully supports the principles of the Fair Housing Act and the Equal Opportunity Act. Each office is independently owned and operated. Listing information is deemed reliable but not guaranteed accurate.