- Alba homes for sale
- Big Sandy homes for sale
- Como homes for sale
- Emory homes for sale
- Grand Saline homes for sale
- Hawkins homes for sale
- Hideaway homes for sale
- Holly Lake Ranch homes for sale
- Leesburg homes for sale
- Leesburg-Newsome homes for sale
- Lindale homes for sale
- Mineola homes for sale
- Pickton homes for sale
- Quitman homes for sale
- Scroggins homes for sale
- Seymore homes for sale
- Van homes for sale
- Winnsboro homes for sale
- Winnsboro homes for sale
- Yantis homes for sale
Wood County, TX - homes for sale
300 of 991 results displayed
- New
 $250,000Active35 Acres
TBD County Road 4510, Winnsboro, TX 75494
MLS# 26004514Listed by: CENTURY 21 FIRST GROUP - MINEOLA - New
 $160,000Active1 beds 1 baths368 sq. ft.
TBD Private Road 5811 Road #5811, Yantis, TX 75765
MLS# 21224243Listed by: LONE STAR REALTY - New
 $160,000Active1 beds 1 baths368 sq. ft.
TBD Private Road 5811, Yantis, TX 75497
MLS# 26004511Listed by: LONE STAR REALTY - LAKE FORK - New
 $115,000Active2 beds 2 baths1,576 sq. ft.
609 Walnut St, Mineola, TX 75773
MLS# 26004473Listed by: WOOD REAL ESTATE GROUP, LLC - New
 $299,000Active-- beds -- baths1,798 sq. ft.
105 Francis St, Hawkins, TX 75765
MLS# 26004495Listed by: NORRIS REAL ESTATE - New
 $197,000Active3 beds 2 baths1,400 sq. ft.
1014 County Road 3226, Quitman, TX 75783
MLS# 21223783Listed by: WELLS REALTY SOLUTIONS, LLC - New
 $125,000Active2 beds 1 baths940 sq. ft.
407 W Carnegie Street, Winnsboro, TX 75494
MLS# 21224358Listed by: NATIONAL AGENT NETWORK - New
 $415,000Active4 beds 3 baths2,151 sq. ft.
557 CR 2610, Mineola, TX 75773
MLS# 26004466Listed by: UNITED COUNTRY CAIN AGENCY - New
 $33,900Active0.28 Acres
Lots 17,18&19 Section F Caddo, Quitman, TX 75783
MLS# 21223932Listed by: DEEN PROPERTY GROUP - New
 $155,000Active2 beds 3 baths1,216 sq. ft.
112 Rising Star, Quitman, TX 75783
MLS# 21220052Listed by: REAL BROKER, LLC - New
 $125,000Active2 beds 1 baths1,400 sq. ft.
330 W Kilpatrick, Mineola, TX 75773
MLS# 21223724Listed by: CENTURY 21 FIRST GROUP - New
 $399,999Active3 beds 3 baths1,800 sq. ft.
2198 County Road 3540, Hawkins, TX 75765
MLS# 21206134Listed by: SU KAZA REALTY, LLC - New
 $599,000Active4 beds 3 baths2,800 sq. ft.
1767 County Road 3840, Hawkins, TX 75765
MLS# 26004414Listed by: KELLER WILLIAMS REALTY-TYLER - New
 $148,000Active2 beds 2 baths985 sq. ft.
1692 Valleywood Trail, Holly Lake Ranch, TX 75765
MLS# 26004394Listed by: TEXAS PREMIER REALTY - New
 $79,900Active3 beds 2 baths1,726 sq. ft.
18839 Texas Highway 11 E, Winnsboro, TX 75494
MLS# 40921420Listed by: WALZEL PROPERTIES - CORPORATE OFFICE - New
 $1,389,000Active3 beds 3 baths3,450 sq. ft.
1132 County Road 4470, Winnsboro, TX 75494
MLS# 26004388Listed by: SEARS REALTY GROUP - New
 $1,600,000Active5 beds 4 baths3,228 sq. ft.
3020 FM 2659, Big Sandy, TX 75755
MLS# 26004381Listed by: BERKSHIRE HATHAWAY HOMESERVICES MILES REALTY-TYLER - New
 $299,000Active3 beds 2 baths1,900 sq. ft.
606 Glazner Street, Hawkins, TX 75765
MLS# 26004375Listed by: LESLIE CAIN REALTY, LLC - New
 $75,000Active3 beds 2 baths1,290 sq. ft.
326 Blue Water Ln., Holly Lake Ranch, TX 75765
MLS# 26004363Listed by: REAL ESTATE MARKETING - New
 $379,900Active4 beds 2 baths1,795 sq. ft.
371 CR 2462, Mineola, TX 75773
MLS# 26004368Listed by: SIGNATURE PROPERTIES, LLC-LAKE FORK - New
 $385,000Active35 Acres
TBD Cr 2382, Alba, TX 75410
MLS# 21208180Listed by: DAVE PERRY MILLER REAL ESTATE - New
 $975,000Active105.75 Acres
TBD CR 4390, Winnsboro, TX 75494
MLS# 26004343Listed by: SIGNATURE PROPERTIES, LLC-LAKE FORK - New
 $7,000Active0.07 Acres
Lot 209 Arapaho Drive, Quitman, TX 75783
MLS# 21220188Listed by: REAL BROKER, LLC - New
 $119,900Active3 beds 2 baths1,500 sq. ft.
278 Choctaw, Quitman, TX 75783
MLS# 21221174Listed by: LISTINGSPARK - New
 $629,000Active3 beds 2 baths1,733 sq. ft.
447 County Road 4845, Winnsboro, TX 75494
MLS# 21221299Listed by: MY CASTLE REALTY - New
 $295,000Active3 beds 2 baths1,628 sq. ft.
609 E Quitman Street, Alba, TX 75410
MLS# 21221407Listed by: LESLIE CAIN REALTY - New
 $499,999Active4 beds 2 baths2,451 sq. ft.
221 County Road 2308, Mineola, TX 75773
MLS# 26004293Listed by: CENTURY 21 FIRST GROUP - MINEOLA - New
 $79,000Active5.77 Acres
0 County Road 2484, Mineola, TX 75773
MLS# 56006332Listed by: EXP REALTY LLC - New
 $285,000Active3 beds 2 baths1,392 sq. ft.
284 Pleasant Hill Lane, Holly Lake Ranch, TX 75765
MLS# 21206815Listed by: HI VIEW REAL ESTATE - New
 $349,900Active3 beds 2 baths1,664 sq. ft.
4668 FM 2088, Winnsboro, TX 75494
MLS# 26004283Listed by: TEXAS REAL ESTATE EXECUTIVES-GILMER - New
 $470,500Active1 beds 1 baths1,249 sq. ft.
812 County Road 2275, Mineola, TX 75773
MLS# 21219158Listed by: INC REALTY, LLC - New
 $229,000Active2 beds 1 baths832 sq. ft.
985 Indian Gap, Quitman, TX 75783
MLS# 21187470Listed by: CENTRAL METRO REALTY - New
 $359,000Active3 beds 2 baths1,344 sq. ft.
4140 County Road 3230, Mineola, TX 75773
MLS# 26004267Listed by: CENTURY 21 LAKE COUNTRY-QUITMN - New
 $629,900Active2 beds 2 baths1,583 sq. ft.
659 Indian Gap, Quitman, TX 75783
MLS# 26004255Listed by: REALTY ONE GROUP ROSE - New
 $199,900Active2 beds 2 baths1,078 sq. ft.
233 County Road 2130, Quitman, TX 75783
MLS# 21220067Listed by: PROMISED LAND GROUP, LLC - New
 $185,900Active2 beds 2 baths1,106 sq. ft.
159 Cherrywood Lane, Holly Lake Ranch, TX 75765
MLS# 26004250Listed by: LONE STAR REALTY - HOLLY LAKE RANCH - New
 $125,000Active2 beds 1 baths1,450 sq. ft.
308 S Mill Street, Winnsboro, TX 75494
MLS# 21219839Listed by: KELLER WILLIAMS REALTY-TYLER - New
 $299,500Active3 beds 2 baths1,645 sq. ft.
161 Pine Branch Glen, Holly Lake Ranch, TX 75765
MLS# 20262125Listed by: CENTURY 21 FIRST GROUP - LINDALE - New
 $315,000Active3 beds 2 baths1,725 sq. ft.
105 Maxine St, Mineola, TX 75773
MLS# 26004217Listed by: BLUE SKY GROUP REALTY - New
 $360,000Active3 beds 2 baths1,632 sq. ft.
202 County Road 1558, Alba, TX 75410
MLS# 21214800Listed by: KELLER WILLIAMS REALTY - New
 $300,000Active3 beds 2 baths1,912 sq. ft.
116 County Road 1559, Alba, TX 75410
MLS# 21214852Listed by: KELLER WILLIAMS REALTY - New
 $249,900Active3 beds 2 baths2,433 sq. ft.
290 Lynch Street, Hawkins, TX 75765
MLS# 20262119Listed by: CENTURY 21 FIRST GROUP - LINDALE - New
 $730,000Active3 beds 3 baths2,262 sq. ft.
336 Private Road 5517, Alba, TX 75410
MLS# 21197160Listed by: DAVE PERRY MILLER REAL ESTATE - New
 $249,900Active3 beds 2 baths1,688 sq. ft.
109 Maxine St, Mineola, TX 75773
MLS# 20262107Listed by: BLUE SKY GROUP REALTY - New
 $373,290Active5 beds 3 baths2,514 sq. ft.
7505 Bent Gale Road, Pilot Point, TX 76258
MLS# 21218502Listed by: WILLIAM ROBERDS - New
 $189,000Active2 beds 2 baths1,126 sq. ft.
188 Candlelight Path, Holly Lake Ranch, TX 75765
MLS# 20262096Listed by: EXP REALTY LLC - New
 $25,000Active0.43 Acres
TBD CR 3860, Lot 76 Indian Mound, Hawkins, TX 75765
MLS# 26004183Listed by: NOLAN PROPERTIES, LLC - New
 $1,799,000Active-- beds -- baths5,040 sq. ft.
128 Loye Ln, Hawkins, TX 75765
MLS# 26004178Listed by: NORRIS REAL ESTATE - New
 $249,900Active2 beds 2 baths1,648 sq. ft.
264 Peaceful Valley Trail, Holly Lake Ranch, TX 75765
MLS# 20262093Listed by: TEXAS REAL ESTATE EXECUTIVES - LONGVIEW - New
 $330,000Active22.06 Acres
3842 N State Highway 37, Quitman, TX 75783
MLS# 21218342Listed by: UNITED COUNTRY CAIN AGENCY - New
 $177,900Active2 beds 2 baths1,106 sq. ft.
121 Candlelight Cove, Holly Lake Ranch, TX 75765
MLS# 21218487Listed by: WILLOW PROPERTY GROUP - New
 $340,000Active3 beds 2 baths1,728 sq. ft.
1457 Lake Franklin Dr., Winnsboro, TX 75494
MLS# 26004163Listed by: MAYBEN REALTY - MT. VERNON - New
 $475,000Active4 beds 3 baths2,190 sq. ft.
2801 County Road 1600, Alba, TX 75410
MLS# 21217984Listed by: RE/MAX LANDMARK EDGEWOOD - New
 $10,000Active0.23 Acres
0 County Road 1687, Alba, TX 75410
MLS# 21216965Listed by: KELLER WILLIAMS ROCKWALL - New
 $256,000Active3 beds 2 baths1,523 sq. ft.
336 County Road 3542, Hawkins, TX 75765
MLS# 26004123Listed by: NATIONAL AGENT NETWORK - New
 $350,000Active2 beds 2 baths840 sq. ft.
884 County Road 2950, Alba, TX 75410
MLS# 26004131Listed by: THE PROPERTY SHOPPE - EXP REALTY, LLC - New
 $355,000Active4 beds 3 baths2,631 sq. ft.
412 Nathan Drive, Quitman, TX 75783
MLS# 21217932Listed by: KELLER WILLIAMS REALTY-TYLER - New
 $344,820Active3 beds 2 baths1,916 sq. ft.
126 County Road 2318, Mineola, TX 75773
MLS# 26004115Listed by: MIDWEST LAND GROUP - New
 $124,900Active1 beds 1 baths399 sq. ft.
370 Sioux, Quitman, TX 75783
MLS# 26004116Listed by: CENTURY 21 LAKE COUNTRY-QUITMN - New
 $646,000Active34 Acres
1176 FM 515, Winnsboro, TX 75494
MLS# 26004108Listed by: COLDWELL BANKER LAKEHAVEN, REA - New
 $190,000Active10 Acres
1176 W FM 515, Winnsboro, TX 75494
MLS# 26004114Listed by: COLDWELL BANKER LAKEHAVEN, REA - New
 $310,000Active19.4 Acres
567 County Road 2880, Mineola, TX 75773
MLS# 26004107Listed by: NATIONAL AGENT NETWORK - New
 $2,449,217Active3 beds 1 baths1,107 sq. ft.
205 County Road 2880, Mineola, TX 75773
MLS# 26004101Listed by: LONE STAR REALTY - WINNSBORO - New
 $1,547,660Active188.74 Acres
TBD County Road 2880, Mineola, TX 75773
MLS# 26004095Listed by: LONE STAR REALTY - WINNSBORO - New
 $1,061,119Active3 beds 1 baths1,107 sq. ft.
205 County Road 2880, Mineola, TX 75773
MLS# 26004096Listed by: LONE STAR REALTY - WINNSBORO - New
 $75,000Active3 beds 2 baths1,056 sq. ft.
227 S McWhorter, Mineola, TX 75773
MLS# 26004098Listed by: LONE STAR REALTY - MINEOLA - New
 $270,000Active2 beds 1 baths1,020 sq. ft.
1457 FM 1804, Mineola, TX 75773
MLS# 26004083Listed by: EAST TEXAS PREFERRED PROPERTIES, LLC - TYLER - New
 $20,000Active0.47 Acres
TBD N Main St, Winnsboro, TX 75494
MLS# 26004062Listed by: CENTURY 21 PREMIER GROUP - New
 $995,000Active3 beds 3 baths2,800 sq. ft.
449 CR 3955, Mineola, TX 75773
MLS# 26004046Listed by: QUITMAN REALTY - New
 $28,000Active0.43 Acres
TBD N N Main, Winnsboro, TX 75494
MLS# 26004058Listed by: CENTURY 21 PREMIER GROUP - New
 $77,000Active1.38 Acres
TBD Lot 49 Private Road 6305, Mineola, TX 75773
MLS# 21215935Listed by: TOP NOTCH REALTY & ASSOCIATES - New
 $315,000Active4 beds 2 baths2,246 sq. ft.
725 W BLAIR ST, Mineola, TX 75773
MLS# 26004037Listed by: COLDWELL BANKER APEX - TYLER - New
 $189,500Active3 beds 2 baths1,856 sq. ft.
200 E Myrtle Street, Winnsboro, TX 75494
MLS# 21215808Listed by: UNITED COUNTRY CAIN AGENCY - New
 $748,000Active68.3 Acres
TBD County Road 462, Mineola, TX 75773
MLS# 21215440Listed by: EXIT REALTY PRO - New
 $69,900Active0.2 Acres
718 Indian Gap, Quitman, TX 75783
MLS# 21215437Listed by: LONE STAR REALTY - New
 $769,000Active5 beds 3 baths2,849 sq. ft.
253 County Road 1445, Quitman, TX 75783
MLS# 21212124Listed by: RE/MAX ADVANCED - New
 $549,000Active3 beds 3 baths4,799 sq. ft.
802 W Coke Rd, Winnsboro, TX 75494
MLS# 26003990Listed by: CENTURY 21 LAKE COUNTRY-QUITMN - New
 $449,900Active4 beds 2 baths1,830 sq. ft.
1528 CR 3260, Quitman, TX 75783
MLS# 26003991Listed by: CENTURY 21 FIRST GROUP - LINDALE - New
 $998,500Active3 beds 3 baths3,142 sq. ft.
270 PR 5293, Yantis, TX 75497
MLS# 26003993Listed by: SIGNATURE PROPERTIES, LLC-LAKE FORK  $149,900Active3 beds 2 baths1,428 sq. ft.
1015 E Broad St. #14, Mineola, TX 75773
MLS# 26003911Listed by: QUITMAN REALTY- New
 $1,318,000Active167.75 Acres
TBD FM 852, Winnsboro, TX 75494
MLS# 26003973Listed by: TEXAS REAL ESTATE EXECUTIVES-GILMER  $395,000Active3 beds 2 baths1,635 sq. ft.
1162 County Road 2330, Mineola, TX 75773
MLS# 21209804Listed by: L.L. SPENCER REAL ESTATE $177,500Active2 beds 1 baths984 sq. ft.
1048 W Holly Trail, Hawkins, TX 75765
MLS# 21214736Listed by: KELLER WILLIAMS REALTY-TYLER $412,000Active4 beds 2 baths1,971 sq. ft.
21531 Kayla Ln, Mineola, TX 75773
MLS# 26003946Listed by: COLDWELL BANKER APEX - TYLER $449,900Active3 beds 3 baths1,920 sq. ft.
291 CR 4555, Winnsboro, TX 75494
MLS# 26003943Listed by: COLDWELL BANKER LENHART - GILMER $724,900Active3 beds 3 baths2,759 sq. ft.
11374 Texas Highway 154 S, Yantis, TX 75497
MLS# 21213425Listed by: JANET MARTIN REALTY $177,500Active2 beds 1 baths984 sq. ft.
1048 W Holly Trl, Holly Lake Ranch, TX 75765
MLS# 26003908Listed by: KELLER WILLIAMS REALTY-TYLER $80,000Active3 beds 2 baths1,542 sq. ft.
204 S Mill, Winnsboro, TX 75494
MLS# 26003904Listed by: CLEMENTS, REALTORS $349,000Active3 beds 2 baths1,851 sq. ft.
172 Private Road 6292, Mineola, TX 75773
MLS# 26003898Listed by: LESLIE CAIN REALTY, LLC $697,000Pending3 beds 3 baths3,470 sq. ft.
520 Pr 5987, Yantis, TX 75497
MLS# 21195673Listed by: EBBY HALLIDAY, REALTORS $30,000Active0.5 Acres
TBD HWY 80 E Southside, Mineola, TX 75773
MLS# 26003885Listed by: EAST TEXAS PREFERRED PROPERTIES, LLC - TYLER $189,000Active2 beds 2 baths1,126 sq. ft.
188 Candlelight Path, Hawkins, TX 75765
MLS# 35442322Listed by: EXP REALTY LLC $149,900Active2 beds 2 baths824 sq. ft.
509 Sherman Street, Winnsboro, TX 75494
MLS# 26003877Listed by: JANET MARTIN REALTY $430,000Active43.2 Acres
TBD FM 1643, Winnsboro, TX 75494
MLS# 20261955Listed by: NOON AND ASSOCIATES $1,100,000Active4 beds 3 baths3,386 sq. ft.
181 County Road 1505, Alba, TX 75410
MLS# 26003843Listed by: SIGNATURE PROPERTIES, LLC-LAKE FORK $409,000Active3 beds 3 baths1,745 sq. ft.
228 CR 2462, Mineola, TX 75773
MLS# 26003844Listed by: REALTY ONE GROUP ROSE $2,275,000Active5 Acres
1002 Private Road 7892, Mineola, TX 75773
MLS# 21211345Listed by: REPUBLIC RANCHES, LLC $235,000Active3 beds 2 baths1,163 sq. ft.
190 County Road 1975, Yantis, TX 75497
MLS# 26003835Listed by: SIGNATURE PROPERTIES, LLC-LAKE FORK $209,500Active3 beds 2 baths1,356 sq. ft.
140 Woodfern Glen, Holly Lake Ranch, TX 75765
MLS# 20261948Listed by: CENTURY 21 FIRST GROUP - LINDALE $49,500Active1.77 Acres
TBD Tx-11 E, Winnsboro, TX 75494
MLS# 21212481Listed by: UNITED COUNTRY CAIN AGENCY $380,000Active3 beds 2 baths2,128 sq. ft.
109 Old Barn Circle, Holly Lake Ranch, TX 75765
MLS# 21184006Listed by: LONE STAR REALTY $865,000Active3 beds 3 baths2,996 sq. ft.
22782 N Us Highway 69, Mineola, TX 75773
MLS# 21211931Listed by: I-20 TEAM REAL ESTATE, LLC $325,000Active4 beds 2 baths1,683 sq. ft.
1132 N FM 17, Alba, TX 75410
MLS# 26003782Listed by: DWELL REALTY $649,900Active4 beds 3 baths2,428 sq. ft.
364 Private Road 6602, Mineola, TX 75773
MLS# 21211854Listed by: COLDWELL BANKER APEX, REALTORS $150,000Active2 beds 2 baths1,120 sq. ft.
183 CR 3496, Hawkins, TX 75765
MLS# 26003750Listed by: RE/MAX TYLER $149,500Active3 beds 2 baths1,456 sq. ft.
167 County Road 2244, Mineola, TX 75773
MLS# 21210967Listed by: CENTURY 21 FIRST GROUP $49,500Active1.77 Acres
TBD E Hwy 11, Winnsboro, TX 75494
MLS# 26003721Listed by: UNITED COUNTRY CAIN AGENCY $650,000Active3 beds 3 baths2,091 sq. ft.
101 County Road 1299, Yantis, TX 75497
MLS# 21209214Listed by: MILLER HOMES GROUP $99,000Active2 beds 1 baths265 sq. ft.
6435 Fm 17 #605, Yantis, TX 75497
MLS# 21203007Listed by: RE/MAX ADVANCED $185,000Active3 beds 2 baths1,369 sq. ft.
3872 E Highway 154, Quitman, TX 75783
MLS# 21209172Listed by: LONE STAR REALTY $189,500Active4 beds 3 baths2,080 sq. ft.
509 Tina St, Quitman, TX 75783
MLS# 26003651Listed by: COLDWELL BANKER APEX - TYLER $149,000Active3 beds 2 baths1,191 sq. ft.
501 Tamy, Quitman, TX 75783
MLS# 26003661Listed by: QUITMAN REALTY $172,500Active-- beds -- baths1,549 sq. ft.
210 E BLACKBOURN ST, Hawkins, TX 75765
MLS# 26003632Listed by: CENTURY 21 FIRST GROUP - LINDALE $449,000Active2 beds 2 baths1,421 sq. ft.
2291 County Road 3440, Hawkins, TX 75765
MLS# 26003615Listed by: TEXAS PREMIER REALTY $300,000Active3 beds 2 baths1,590 sq. ft.
227 county road 2425, Mineola, TX 75773
MLS# 26003611Listed by: FATHOM REALTY, LLC - ARLINGTON $320,000Active5 beds 2 baths2,626 sq. ft.
1624 County Road 1560, Alba, TX 75410
MLS# 21208832Listed by: CENTURY 21 FIRST GROUP $30,000Active0.57 Acres
186 Private Road 5617 (Golden Valley Crossing), Alba, TX 75410
MLS# 26003605Listed by: EBBY HALLIDAY, REALTORS - TYLER $30,000Active0.56 Acres
204 Private Road 5617 (Golden Valley Crossing), Alba, TX 75410
MLS# 26003606Listed by: EBBY HALLIDAY, REALTORS - TYLER $345,000Active1 beds 1 baths1,748 sq. ft.
773 CR 1522, Alba, TX 75410
MLS# 26003602Listed by: SIGNATURE PROPERTIES, LLC-LAKE FORK $789,900Active4 beds 2 baths1,953 sq. ft.
395 County Road 1780 Road, Yantis, TX 75497
MLS# 21203023Listed by: CENTURY 21 FIRST GROUP $110,000Active3 beds 2 baths1,216 sq. ft.
245 Seminole, Quitman, TX 75783
MLS# 21207305Listed by: REAL BROKER, LLC $235,000Pending4 beds 2 baths1,815 sq. ft.
255 County Road 2132, Quitman, TX 75783
MLS# 26003588Listed by: S.E.T. REAL ESTATE $249,000Active2.02 Acres
1 Angler Shores Drive, Yantis, TX 75497
MLS# 26003550Listed by: LISTINGSPARK $139,000Active4 beds 2 baths1,800 sq. ft.
165 County Road 4137, Quitman, TX 75783
MLS# 26003555Listed by: THE BRIAN CHINN TEAM, EXP REALTY $70,000Active5.3 Acres
TBD FM 778/CR 3230, Quitman, TX 75783
MLS# 26003556Listed by: KELLER WILLIAMS REALTY-TYLER $150,000Active9.9 Acres
n/a County Road 4878, Winnsboro, TX 75494
MLS# 82378647Listed by: JANE BYRD PROPERTIES INTERNATIONAL LLC $525,000Pending3 beds 2 baths2,500 sq. ft.
249 Private Road 6936, Alba, TX 75410
MLS# 21207769Listed by: I-20 TEAM REAL ESTATE, LLC $125,000Active2 beds 1 baths1,450 sq. ft.
308 S Mill St, Winnsboro, TX 75494
MLS# 26003451Listed by: KELLER WILLIAMS REALTY-TYLER $278,000Active4 beds 3 baths2,144 sq. ft.
221 Butternut Glen, Holly Lake Ranch, TX 75765
MLS# 26003534Listed by: TEXAS REAL ESTATE EXECUTIVES-GILMER $60,000Active2 beds 1 baths228 sq. ft.
Lot 180-182 Private Road 5822 Road, Yantis, TX 75497
MLS# 21198855Listed by: REALTY FIRM GLOBAL, PLLC $19,500Active0 Acres
202 Magnolia, Holly Lake Ranch, TX 75765
MLS# 26003448Listed by: LESLIE CAIN REALTY, LLC $369,999Active4 beds 3 baths2,490 sq. ft.
17113 Texas Highway 11 E, Winnsboro, TX 75494
MLS# 21204533Listed by: CENTURY 21 FIRST GROUP $199,999Active3 beds 2 baths1,320 sq. ft.
154 Wapiti, Quitman, TX 75783
MLS# 21196297Listed by: CENTURY 21 FIRST GROUP $179,900Pending2 beds 1 baths1,868 sq. ft.
5427 Fm 69, Como, TX 75431
MLS# 21204106Listed by: FREEDOM REALTY $299,000Pending3 beds 2 baths1,421 sq. ft.
2459 FM 1647, Winnsboro, TX 75494
MLS# 26003363Listed by: TEXAS ALLY REAL ESTATE GROUP $2,695,000Active3 beds -- baths2,940 sq. ft.
3222 Fm 1254, Mineola, TX 75773
MLS# 21092774Listed by: TX LAND & LEGACY REALTY, LLC $330,000Active2 beds 2 baths1,200 sq. ft.
3820 County Road 4930, Quitman, TX 75783
MLS# 21199785Listed by: QUITMAN REALTY $239,900Active2 beds 2 baths1,907 sq. ft.
204 Dewitt Street, Alba, TX 75410
MLS# 21200865Listed by: NEWFOUND REAL ESTATE $429,000Active3 beds 2 baths845 sq. ft.
1432 County Road 2270, Mineola, TX 75773
MLS# 26003337Listed by: LONE STAR REALTY - LAKE FORK $850,000Active4 beds 3 baths3,273 sq. ft.
242 Lakewood Circle, Holly Lake Ranch, TX 75765
MLS# 26003332Listed by: CRAINE REALTY $35,000Active0.5 Acres
TBD CR 4836 0.50, Winnsboro, TX 75494
MLS# 21199746Listed by: QUALITY CHOICE SOLUTIONS, LLC $24,900Active0.33 Acres
Lot 322 Section Pine Cone Glen, Holly Lake Ranch, TX 75765
MLS# 26003307Listed by: WILLOW PROPERTY GROUP $59,900Active4.5 Acres
0 Farm To Market 69 Road, Como, TX 75431
MLS# 21202993Listed by: TOP BROKERAGE LLC $177,900Active2 beds 2 baths1,106 sq. ft.
121 Candlelight Cv, Holly Lake Ranch, TX 75765
MLS# 26003296Listed by: WILLOW PROPERTY GROUP $259,000Pending1.68 Acres
TBD Private Road 5860, Yantis, TX 75497
MLS# 26003299Listed by: CENTURY 21 LAKE COUNTRY-QUITMN $135,000Pending3 beds 2 baths1,064 sq. ft.
3327 FM 2966, Quitman, TX 75783
MLS# 26003302Listed by: CENTURY 21 LAKE COUNTRY-QUITMN $259,000Pending1.68 Acres
TBD Private Road 5860, Yantis, TX 75765
MLS# 21200858Listed by: CENTURY 21 LAKE COUNTRY $405,000Pending65 Acres
19181 Texas Highway 11 E, Winnsboro, TX 75494
MLS# 21202645Listed by: UNITED COUNTRY CAIN AGENCY $59,900Active0.1 Acres
6435 FM 17 LOTS 34-35, Yantis, TX 75497
MLS# 26003281Listed by: PROMISED LAND GROUP, LLC $129,900Active1 beds 1 baths280 sq. ft.
6435 Fm 17 LOTS 620-625, Yantis, TX 75497
MLS# 26003284Listed by: PROMISED LAND GROUP, LLC $299,900Active2 beds 3 baths599 sq. ft.
6435 Fm 17 LOTS 34-39, Yantis, TX 75497
MLS# 26003285Listed by: PROMISED LAND GROUP, LLC $850,000Active47 Acres
0000 Overview Drive, Mineola, TX 75773
MLS# 21196143Listed by: RE/MAX DALLAS SUBURBS PM $149,900Active2 beds 1 baths941 sq. ft.
177 County Road 1556, Alba, TX 75410
MLS# 26003279Listed by: PROMISED LAND GROUP, LLC $299,000Active3 beds 2 baths1,996 sq. ft.
1905 County Road 2720, Mineola, TX 75773
MLS# 26003259Listed by: EXIT REALTY PINNACLE GROUP $145,000Active2 beds 2 baths1,040 sq. ft.
234 Holly Hill Circle 206B, Holly Lake Ranch, TX 75765
MLS# 26003247Listed by: TEXAS PREMIER REALTY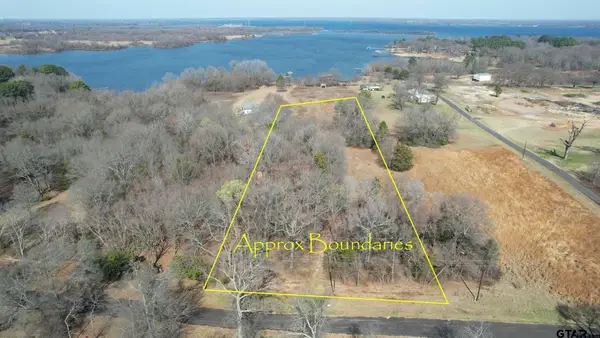 $295,000Active4.06 Acres
TBD County Rd 1575, Alba, TX 75410
MLS# 26003245Listed by: SIGNATURE PROPERTIES, LLC-LAKE FORK $95,000Active2 beds 1 baths934 sq. ft.
616 Kevin Drive, Mineola, TX 75773
MLS# 96325720Listed by: STAG & STONE REALTY LLC $150,000Active2 beds 2 baths978 sq. ft.
100 LYNCH ST, Hawkins, TX 75765
MLS# 20261666Listed by: TEXAS REAL ESTATE EXECUTIVES, THE DANIELS GROUP - GILMER $264,900Active2 beds 2 baths1,359 sq. ft.
138 GREEN KNOLL, Holly Lake Ranch, TX 75765
MLS# 26003233Listed by: CENTURY 21 FIRST GROUP - LINDALE $495,000Pending3 beds 2 baths2,201 sq. ft.
703 CR 4592, Winnsboro, TX 75494
MLS# 26003223Listed by: COLDWELL BANKER LAKEHAVEN, REA $319,000Active4 beds 2 baths1,769 sq. ft.
1445 County Road 4450, Winnsboro, TX 75494
MLS# 21197617Listed by: UNITED COUNTRY CAIN AGENCY $399,000Active3 beds 2 baths2,264 sq. ft.
510 County Road 2311, Mineola, TX 75773
MLS# 21200387Listed by: LESLIE CAIN REALTY $60,000Active1 Acres
Lot 3 Pr 2228, Mineola, TX 75773
MLS# 21200199Listed by: EXIT REALTY PRO $299,900Active2 beds 3 baths599 sq. ft.
6435 N Fm 17 #Lots 34-39, Yantis, TX 75497
MLS# 21193879Listed by: PROMISED LAND GROUP, LLC $60,000Active1 Acres
Lot 2 Pr 2228, Mineola, TX 75773
MLS# 21199830Listed by: EXIT REALTY PRO $419,000Active4 beds 4 baths3,116 sq. ft.
140 Pat Drive, Mineola, TX 75773
MLS# 26003143Listed by: CENTURY 21 FIRST GROUP - MINEOLA $659,000Active3 beds 2 baths2,071 sq. ft.
1339 FM 288, Quitman, TX 75783
MLS# 26003137Listed by: CENTURY 21 LAKE COUNTRY-QUITMN $205,000Active3 beds 2 baths1,464 sq. ft.
231 Lamplight Path, Holly Lake Ranch, TX 75765
MLS# 26003115Listed by: KELLER WILLIAMS REALTY-TYLER $149,900Active3 beds 2 baths1,270 sq. ft.
318 CR 2922, Alba, TX 75410
MLS# 20261566Listed by: A GRACE REAL ESTATE $599,000Active3 beds 3 baths3,077 sq. ft.
352 County Road 3120, Quitman, TX 75783
MLS# 21198286Listed by: QUITMAN REALTY $275,000Active3 beds 2 baths1,678 sq. ft.
130 County Road 3803, Hawkins, TX 75765
MLS# 26003072Listed by: MILLER HOMES GROUP $299,900Active3 beds 3 baths2,273 sq. ft.
1265 Lake Franklin Dr, Winnsboro, TX 75494
MLS# 26003084Listed by: MAYBEN REALTY - MT. VERNON $469,900Pending4 beds 3 baths2,440 sq. ft.
411 County Road 1784, Yantis, TX 75497
MLS# 21188261Listed by: CENTURY 21 FIRST GROUP $199,000Active3 beds 2 baths1,584 sq. ft.
905 N Walnut Street, Winnsboro, TX 75494
MLS# 21185310Listed by: DODD REALTY $106,925Active6.1 Acres
TBD County Road 2958, Alba, TX 75410
MLS# 21197532Listed by: L.L. SPENCER REAL ESTATE $55,000Active0.89 Acres
255 CR 3496, Hawkins, TX 75765
MLS# 26003015Listed by: RE/MAX PROFESSIONALS $60,000Active0.08 Acres
Lot 91-92 Private Road 5800, Yantis, TX 75497
MLS# 21197020Listed by: LONE STAR REALTY $228,500Active2 beds 2 baths1,274 sq. ft.
531 Knollwood Lane, Holly Lake Ranch, TX 75765
MLS# 26003004Listed by: TEXAS PREMIER REALTY $515,000Active4 beds 3 baths2,344 sq. ft.
145 Private Road 6238, Mineola, TX 75773
MLS# 26003006Listed by: DHS REALTY $309,000Active23.68 Acres
TBD County Road 3986, Winnsboro, TX 75494
MLS# 21196938Listed by: UNITED COUNTRY CAIN AGENCY $309,000Active23.68 Acres
TBD CR 3986, Winnsboro, TX 75494
MLS# 26002984Listed by: UNITED COUNTRY CAIN AGENCY $350,000Active2 beds 2 baths1,488 sq. ft.
229 County Road 4554, Winnsboro, TX 75494
MLS# 21194146Listed by: DANNY SWAFFORD, JR. $325,000Active3 beds 2 baths1,521 sq. ft.
702 Davis Ave, Quitman, TX 75783
MLS# 26002968Listed by: QUITMAN REALTY $150,000Active8.09 Acres
423 County Road 1560, Alba, TX 75410
MLS# 21193956Listed by: RESIDE REAL ESTATE LLC $429,900Active4 beds 2 baths1,964 sq. ft.
143 Cr 2724, Mineola, TX 75773
MLS# 26002965Listed by: THE AGENCY - TYLER $139,000Active2 beds 1 baths968 sq. ft.
329 LYNCH, Hawkins, TX 75765
MLS# 26002956Listed by: CENTURY 21 FIRST GROUP - MINEOLA $295,000Active3 beds 2 baths1,628 sq. ft.
609 E Quitman St., Alba, TX 75410
MLS# 26002953Listed by: LESLIE CAIN REALTY, LLC $1,100,000Active3 beds 2 baths3,704 sq. ft.
810 W Pine Street, Winnsboro, TX 75494
MLS# 21195731Listed by: MISSION REAL ESTATE GROUP $680,000Active4 beds 3 baths3,529 sq. ft.
3115 Rains County Road 2610, Alba, TX 75410
MLS# 66525140Listed by: COMPASS RE TEXAS, LLC - MEMORIAL $219,900Active0.52 Acres
TBD Cr 1503, Alba, TX 75410
MLS# 21195081Listed by: REALEDGE REAL ESTATE $13,500Active0.08 Acres
163 Navajo, Quitman, TX 75783
MLS# 21195201Listed by: PROMISED LAND GROUP, LLC $180,000Active18.19 Acres
1462 Mole Road, Winnsboro, TX 75494
MLS# 26002891Listed by: MIDWEST LAND GROUP $218,500Active2 beds 2 baths1,306 sq. ft.
514 McMillan, Winnsboro, TX 75494
MLS# 26002898Listed by: CLEMENTS, REALTORS $36,000Active0.47 Acres
Lot 128, 144 County Road 2123, Quitman, TX 75783
MLS# 26002913Listed by: LONE STAR REALTY - LAKE FORK $30,000Active0.13 Acres
TBD Dubose St, Mineola, TX 75773
MLS# 21191205Listed by: JONES & CO. REALTY GROUP, LLC $230,000Active1.01 Acres
Lot 13 Angler Shores Drive, Yantis, TX 75497
MLS# 21193697Listed by: LONE STAR REALTY $475,000Active3 beds 2 baths2,032 sq. ft.
810 Clear Water Trail, Holly Lake Ranch, TX 75765
MLS# 21180871Listed by: CEDAR CREEK LAKE REAL ESTATE $209,000Active2 beds 2 baths1,220 sq. ft.
315 CR 3496, Hawkins, TX 75765
MLS# 26002835Listed by: RE/MAX TYLER $650,000Pending4 beds 2 baths2,324 sq. ft.
4868 N FM 17, Alba, TX 75410
MLS# 26002826Listed by: CENTURY 21 LAKE COUNTRY-QUITMN $100,000Active2 beds 1 baths1,400 sq. ft.
TBD 140 Minwood, Mineola, TX 75773
MLS# 26002827Listed by: LESLIE CAIN REALTY, LLC $650,000Pending4 beds 2 baths2,324 sq. ft.
4868 Fm 17 #A & B, Alba, TX 75410
MLS# 21193643Listed by: CENTURY 21 LAKE COUNTRY $695,000Active3 beds 3 baths2,988 sq. ft.
115 Raton Pass, Holly Lake Ranch, TX 75765
MLS# 26002813Listed by: LONE STAR REALTY - LAKE FORK $159,900Active3 beds 2 baths1,440 sq. ft.
182 Sioux, Quitman, TX 75783
MLS# 26002769Listed by: FATHOM REALTY, LLC $189,000Active3 beds 2 baths1,050 sq. ft.
750 Waterfront Row, Quitman, TX 75783
MLS# 21184877Listed by: REAL BROKER, LLC $171,900Active3 beds 2 baths1,512 sq. ft.
4394 FARM MARKET 2869, Hawkins, TX 75765
MLS# 26002750Listed by: REALTY ONE GROUP ROSE $61,500Active2.09 Acres
TBD Private Rd 5912, Yantis, TX 75497
MLS# 21192015Listed by: COLDWELL BANKER APEX, REALTORS $355,000Active3 beds 2 baths1,736 sq. ft.
251 Private Road 5986, Yantis, TX 75497
MLS# 21191507Listed by: REALTY TEXAS LLC $45,900Active1.01 Acres
TBD 74 FM 2869 and FM 14, Hawkins, TX 75765
MLS# 25018102Listed by: CENTURY 21 LAKE COUNTRY-QUITMN $45,900Active1.01 Acres
TBD 73 S FM 2869 and S FM 14, Hawkins, TX 75765
MLS# 25018103Listed by: CENTURY 21 LAKE COUNTRY-QUITMN $396,000Active4 beds 2 baths2,333 sq. ft.
1304 Greenbriar Trail, Holly Lake Ranch, TX 75765
MLS# 26002729Listed by: UNITED COUNTRY CAIN AGENCY $329,900Active3 beds 2 baths2,145 sq. ft.
215 CR 3542, Hawkins, TX 75765
MLS# 26002683Listed by: TEXAS REAL ESTATE EXECUTIVES-GILMER $350,000Active3 beds 2 baths1,686 sq. ft.
152 CR 4310, Winnsboro, TX 75494
MLS# 26002663Listed by: CLEMENTS, REALTORS $2,000,000Active98.34 Acres
0001 S Hwy 69, Mineola, TX 75773
MLS# 21190182Listed by: QUITMAN REALTY $140,000Active2 beds 2 baths1,224 sq. ft.
513 1st St., Hawkins, TX 75765
MLS# 20261342Listed by: COLDWELL BANKER LENHART-GILMER $189,900Active10.2 Acres
Lot 1 FM 1795, Big Sandy, TX 75755
MLS# 26002641Listed by: THE BRIAN CHINN TEAM, EXP REALTY $189,900Active10.2 Acres
Lot 2 County Road 3689, Big Sandy, TX 75755
MLS# 26002643Listed by: THE BRIAN CHINN TEAM, EXP REALTY $189,900Active10.2 Acres
Lot 3 County Road 3689, Big Sandy, TX 75755
MLS# 26002644Listed by: THE BRIAN CHINN TEAM, EXP REALTY $189,900Active10.2 Acres
Lot 4 County Road 3689, Big Sandy, TX 75755
MLS# 26002645Listed by: THE BRIAN CHINN TEAM, EXP REALTY $127,700Active5 Acres
Lot 5 County Road 3689, Big Sandy, TX 75755
MLS# 26002647Listed by: THE BRIAN CHINN TEAM, EXP REALTY $200,000Active2 beds 2 baths798 sq. ft.
275 and 281 Indian Gap, Quitman, TX 75783
MLS# 26002624Listed by: JONES & CO. REALTY GROUP, LLC $627,000Active3 beds 3 baths2,913 sq. ft.
615 Private Road 5881, Yantis, TX 75497
MLS# 26002615Listed by: CENTURY 21 LAKE COUNTRY-QUITMN $135,000Active3 beds 2 baths1,068 sq. ft.
209 S Walnut, Winnsboro, TX 75494
MLS# 21186752Listed by: JULIO ROMERO LLC, REALTORS $214,735Active4 beds 2 baths2,016 sq. ft.
157 County Road 4641, Winnsboro, TX 75494
MLS# 5443063Listed by: STARCREST REALTY, LLC $235,000Pending-- beds -- baths1,941 sq. ft.
1408/1410 N NEWSOM, Mineola, TX 75773
MLS# 26002595Listed by: RE/MAX INTEGRITY $195,000Pending3 beds 2 baths1,943 sq. ft.
316 N NEWSOM, Mineola, TX 75773
MLS# 26002593Listed by: RE/MAX INTEGRITY $195,000Active24 Acres
TBD CR 2397, Winnsboro, TX 75494-0000
MLS# 20261327Listed by: UNITED COUNTRY WALKER REALTY & AUCTION $249,900Active3 beds 2 baths2,393 sq. ft.
1124 County Road 2351, Mineola, TX 75773
MLS# 21188486Listed by: COLDWELL BANKER APEX, REALTORS $274,900Active3 beds 2 baths1,667 sq. ft.
1803 Park Place, Mineola, TX 75773
MLS# 26002573Listed by: CENTURY 21 FIRST GROUP - LINDALE $259,900Active4 beds 2 baths1,612 sq. ft.
935 Indian Gap, Quitman, TX 75783
MLS# 21188687Listed by: DEEN PROPERTY GROUP $445,000Active2 beds 2 baths1,895 sq. ft.
2360 County Road 4660, Winnsboro, TX 75494
MLS# 21187429Listed by: CENTURY 21 FIRST GROUP $255,914Pending3 beds 2 baths1,286 sq. ft.
135 Brenlind Ln, Mineola, TX 75773
MLS# 26002549Listed by: SIGNATURE PROPERTIES, LLC-LAKE FORK $269,900Active3 beds 2 baths1,800 sq. ft.
2072 N State Highway 37, Quitman, TX 75783
MLS# 21187740Listed by: GRAHAM & CO REALTY GROUP $150,000Active8.83 Acres
947 County Road 4510, Winnsboro, TX 75494
MLS# 21187546Listed by: FOXY REAL ESTATE, LLC $214,500Pending3 beds 2 baths2,196 sq. ft.
508 Helena St, Winnsboro, TX 75494
MLS# 26002502Listed by: SEARS REALTY GROUP $117,500Active2 beds 2 baths992 sq. ft.
191 Sioux, Quitman, TX 75783
MLS# 21187083Listed by: COLDWELL BANKER ANDERSON REALTY $29,900Pending0.62 Acres
Lot 196 Section H Comanche, Quitman, TX 75783
MLS# 21187001Listed by: DEEN PROPERTY GROUP $12,900Active0.08 Acres
Lot 174 Section I Inca, Quitman, TX 75783
MLS# 21187014Listed by: DEEN PROPERTY GROUP $12,900Active0.17 Acres
Lot 221 Section H Geronimo, Quitman, TX 75783
MLS# 21187021Listed by: DEEN PROPERTY GROUP $39,000Active0.18 Acres
110 Moore St, Hawkins, TX 75765
MLS# 26002475Listed by: CENTURY 21 LAKE COUNTRY-QUITMN $1,925,000Active4 beds 3 baths3,123 sq. ft.
6949 Fm-852, Winnsboro, TX 75494
MLS# 21186414Listed by: UNITED COUNTRY CAIN AGENCY $135,000Active1.74 Acres
9696 Fm-515, Alba, TX 75410
MLS# 21185061Listed by: MILLER HOMES GROUP $1,925,000Active4 beds 3 baths3,123 sq. ft.
6949 FM 852, Winnsboro, TX 75494
MLS# 26002460Listed by: UNITED COUNTRY CAIN AGENCY $359,900Active4 beds 2 baths1,815 sq. ft.
329 CR 2317, Mineola, TX 75773
MLS# 26002428Listed by: BERKSHIRE HATHAWAY HOMESERVICES PREMIER PROPERTIES $200,000Active4 beds 2 baths798 sq. ft.
275 and 281 Indian Gap, Quitman, TX 75783
MLS# 21182828Listed by: JONES & CO. REALTY GROUP, LLC $749,998Active3 beds 5 baths3,788 sq. ft.
304 CR 2311, Mineola, TX 75773
MLS# 26002392Listed by: GOLDEN REALTY GROUP LLC $299,000Active3 beds 2 baths2,009 sq. ft.
2613 CR 4760, Winnsboro, TX 75494
MLS# 26002367Listed by: COLDWELL BANKER LAKEHAVEN, REA $75,000Active0.28 Acres
285 Caddo, Quitman, TX 75783
MLS# 26002364Listed by: CENTURY 21 LAKE COUNTRY-QUITMN $495,000Active3 beds 3 baths2,526 sq. ft.
350 Private Road 6937 #F17S, Alba, TX 75410
MLS# 21184037Listed by: GOLDEN REALTY GROUP LLC $254,900Active3 beds 2 baths1,680 sq. ft.
469 CR 3223, Quitman, TX 75783
MLS# 26002345Listed by: SOUTHERN CHARM REAL ESTATE $495,000Active3 beds 3 baths2,526 sq. ft.
350 PR 6937, Alba, TX 75410
MLS# 26002338Listed by: GOLDEN REALTY GROUP LLC $295,000Active3 beds 2 baths1,473 sq. ft.
130 CR 2312, Mineola, TX 75773
MLS# 26002330Listed by: GOLDEN REALTY GROUP LLC $69,900Active0.25 Acres
Lots 303&382 Broken Bow, Quitman, TX 75783
MLS# 26002333Listed by: PROMISED LAND GROUP, LLC $69,900Active0.25 Acres
Lots 303 and 382 Broken Bow, Quitman, TX 75783
MLS# 21183774Listed by: PROMISED LAND GROUP, LLC $389,900Pending3 beds 2 baths1,908 sq. ft.
176 CR 2462, Mineola, TX 75773
MLS# 26002851Listed by: COLDWELL BANKER APEX - TYLER $385,000Active3 beds 2 baths1,924 sq. ft.
266 PR 6305, Mineola, TX 75773
MLS# 26002308Listed by: COLDWELL BANKER APEX - TYLER $352,130Active22.01 Acres
TBD FM 2088, Quitman, TX 75783
MLS# 26002300Listed by: QUITMAN REALTY $69,000Active3 beds 1 baths1,048 sq. ft.
502 Third St., Quitman, TX 75783
MLS# 26002292Listed by: QUITMAN REALTY $649,000Active3 beds 3 baths2,606 sq. ft.
501 Private Road 5980, Yantis, TX 75497
MLS# 21182603Listed by: FREEDOM REALTY $509,600Active98 Acres
000 CR 3854, Hawkins, TX 75765
MLS# 26002285Listed by: MIDWEST LAND GROUP $167,210Active10.45 Acres
TBD FM 2088, Quitman, TX 75783
MLS# 26002281Listed by: QUITMAN REALTY $208,000Active13.2 Acres
tbd County Road 4930, Quitman, TX 75783
MLS# 21182357Listed by: UNITED COUNTRY CAIN AGENCY $649,000Active3 beds 2 baths1,631 sq. ft.
156 Private Road 5218, Quitman, TX 75783
MLS# 26002247Listed by: CENTURY 21 LAKE COUNTRY-QUITMN $225,000Active3 beds 2 baths1,568 sq. ft.
8477 S FM 14, Hawkins, TX 75765
MLS# 26002254Listed by: CENTURY 21 FIRST GROUP - LINDALE $254,515Active3 beds 2 baths1,474 sq. ft.
515 N Newsom, Mineola, TX 75773
MLS# 112357Listed by: REGAL REALTORS LLC $79,900Active2 beds 1 baths728 sq. ft.
571 Cheyenne, Quitman, TX 75783
MLS# 21175866Listed by: FATHOM REALTY LLC $191,990Active3 beds 2 baths1,202 sq. ft.
105 Sparrow Court, Mineola, TX 75773
MLS# 21182231Listed by: HOMESUSA.COM $229,000Pending3 beds 2 baths2,140 sq. ft.
108 Circle, Mineola, TX 75773
MLS# 26002233Listed by: CENTURY 21 FIRST GROUP - MINEOLA $371,070Active35.34 Acres
TBD County Road 1468, Quitman, TX 75783
MLS# 21175673Listed by: FREEDOM REALTY $140,000Active1 Acres
25 Private Rd 6307, Mineola, TX 75773
MLS# 21181726Listed by: MILLER HOMES GROUP $650,000Active4 beds 4 baths5,200 sq. ft.
295 County Road 3160, Quitman, TX 75783
MLS# 26002189Listed by: COLONIAL REALTY AND DEVELOPMENT $65,500Active1.83 Acres
1332 RS County Road 2570, Alba, TX 75410
MLS# 21180733Listed by: BERKSHIRE HATHAWAYHS PENFED TX $279,900Active3 beds 2 baths1,890 sq. ft.
189 Phil Dr, Hawkins, TX 75765
MLS# 20261056Listed by: CENTURY 21 FIRST GROUP - LINDALE $179,900Active9.91 Acres
TBD 9.91 Acres PR 6662, Mineola, TX 75773
MLS# 26002170Listed by: COLDWELL BANKER APEX - TYLER $282,000Active3 beds 2 baths1,614 sq. ft.
130 Pueblo Path, Holly Lake Ranch, TX 75765
MLS# 26002160Listed by: KELLER WILLIAMS REALTY-TYLER $49,000Active0.47 Acres
0000 County Road 1420, Quitman, TX 75783
MLS# 26002161Listed by: CENTURY 21 LAKE COUNTRY-QUITMN $393,740Active39.37 Acres
605 CR 2100, Quitman, TX 75783
MLS# 26002163Listed by: CENTURY 21 LAKE COUNTRY-QUITMN $280,000Active6 beds 4 baths2,545 sq. ft.
671 & 673 County Road 4116, Quitman, TX 75783
MLS# 21180085Listed by: CROSS POWER REAL ESTATE, LLC $449,000Active3 beds 1 baths1,247 sq. ft.
569 PRIVATE RD 6662, Mineola, TX 75773
MLS# 26002140Listed by: CENTURY 21 FIRST GROUP - MINEOLA $185,000Active9.78 Acres
1815 County Road 3860, Hawkins, TX 75765
MLS# 20261028Listed by: KRISTI MARTIN REALTY $299,900Pending3 beds 2 baths1,707 sq. ft.
629 CR 2620, Mineola, TX 75773
MLS# 26002117Listed by: CENTURY 21 FIRST GROUP - MINEOLA $18,000Active0.17 Acres
870 Choctaw, Quitman, TX 75783
MLS# 21179074Listed by: THE RIGHT REALTORS LLC $280,000Pending23.77 Acres
1223 County Road 1236, Quitman, TX 75783
MLS# 26002061Listed by: CENTURY 21 LAKE COUNTRY-QUITMN $299,999Active3 beds 2 baths2,374 sq. ft.
6258 Highway 37, Mineola, TX 75773
MLS# 26002062Listed by: COLDWELL BANKER LENHART - GILMER $163,900Active2 beds 1 baths918 sq. ft.
786 Holiday Village Dr, Quitman, TX 75783
MLS# 21178862Listed by: DEEN PROPERTY GROUP- $324,000Active3 beds 2 baths1,533 sq. ft.
211 Private Road 6292, Mineola, TX 75773
MLS# 26002046Listed by: DWELL REALTY 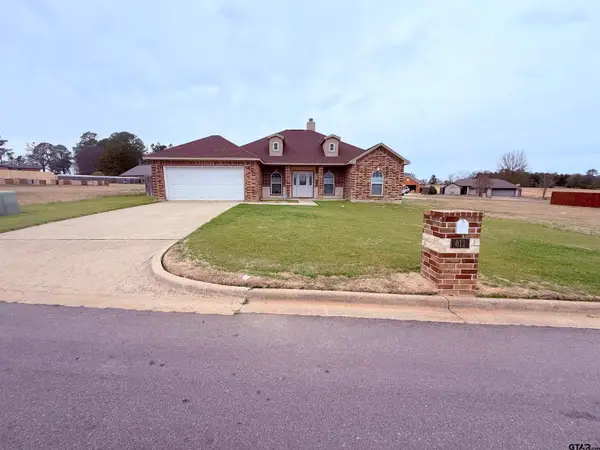 $289,000Active3 beds 2 baths1,706 sq. ft.
611 Dela Cruz Dr, Winnsboro, TX 75494
MLS# 26002024Listed by: UNITED COUNTRY CAIN AGENCY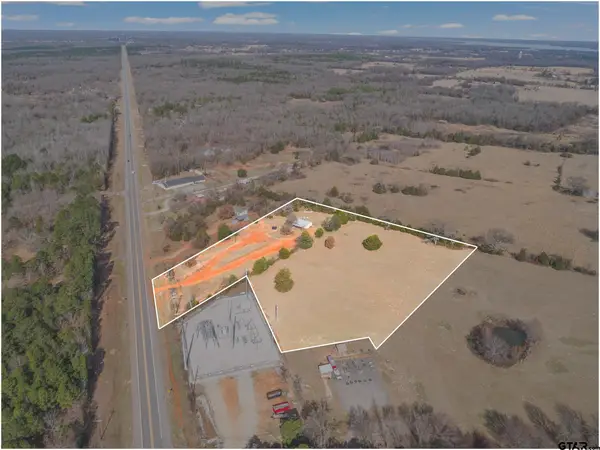 $129,000Pending3 beds 2 baths1,310 sq. ft.
7484 N US HWY 69, Alba, TX 75410
MLS# 26002001Listed by: CENTURY 21 FIRST GROUP - LINDALE $69,900Active1 beds 1 baths480 sq. ft.
205 Geronimo, Quitman, TX 75783
MLS# 21177240Listed by: FATHOM REALTY LLC $119,900Active2 beds 2 baths900 sq. ft.
215 Geronimo, Quitman, TX 75783
MLS# 21177316Listed by: FATHOM REALTY LLC $115,000Active4 beds 2 baths1,200 sq. ft.
309 McDaniel, Mineola, TX 75773
MLS# 26001962Listed by: MILLER HOMES GROUP $300,000Active3 beds 2 baths1,556 sq. ft.
2020 E Holly Trail, Holly Lake Ranch, TX 75675
MLS# 20260941Listed by: STATE REALTY $49,000Active2.65 Acres
0 Cr 3427, Hawkins, TX 75765
MLS# 21176867Listed by: COLDWELL BANKER AMERICAN DREAM $254,000Active3 beds 2 baths1,268 sq. ft.
310 Blackjack, Winnsboro, TX 75494
MLS# 26001944Listed by: UNITED COUNTRY CAIN AGENCY $85,000Active8.3 Acres
0000 CR 4586, Winnsboro, TX 75494
MLS# 26001924Listed by: NEWBERRY REAL ESTATE $55,000Active0.32 Acres
190 County Road 4826, Winnsboro, TX 75494
MLS# 21175897Listed by: EXP REALTY $299,900Active4 beds 3 baths2,295 sq. ft.
200 DAVID, Hawkins, TX 75765
MLS# 26001889Listed by: CENTURY 21 FIRST GROUP - LINDALE $325,000Pending3 beds 2 baths1,888 sq. ft.
182 County Road 2504, Mineola, TX 75773
MLS# 26001856Listed by: CENTURY 21 FIRST GROUP - MINEOLA $139,900Active2 beds 1 baths901 sq. ft.
510 Hogg Street, Mineola, TX 75773
MLS# 21174835Listed by: FATHOM REALTY $49,900Active0.7 Acres
TBD Cr 2940, Alba, TX 75410
MLS# 21174763Listed by: COLDWELL BANKER APEX, REALTORS $49,900Active0.7 Acres
TBD Fm 1799, Alba, TX 75410
MLS# 21174769Listed by: COLDWELL BANKER APEX, REALTORS
Local realty services provided by:CENTURY 21 Judge Fite Company, CENTURY 21 Middleton, CENTURY 21 Tevas, CENTURY 21 Platinum Partners
Information provided, in part, by North Texas Real Estate Information Systems, Inc. Last Updated March 31, 2026 Listings with the NTREIS logo are listed by brokerages other than CENTURY 21 Middleton.
Copyright 2026, Houston Realtors Information Service, Inc. All information provided is deemed reliable but is not guaranteed and should be independently verified. IDX information is provided exclusively for consumers' personal, non-commercial use, it may not be used for any purpose other than to identify prospective properties consumers may be interested in purchasing, and the data is deemed reliable but is not guaranteed accurate by the MLS.
Popular searches near Wood County, TX
Popular neighborhoods near Wood County, TX
- Azalea District, Tyler homes for sale
- Brick Streets District, Tyler homes for sale
- Bullard Place, Tyler homes for sale
- Butler College, Tyler homes for sale
- Cambridge, Tyler homes for sale
- Cascades, Tyler homes for sale
- Charnwood District, Tyler homes for sale
- Connally Heights, Tyler homes for sale
- Cumberland Ridge, Bullard homes for sale
- Downtown Tyler, Tyler homes for sale
- Eagle's Bluff, Bullard homes for sale
- East Side, Tyler homes for sale
- Emerald Bay, Bullard homes for sale
- Hollytree, Tyler homes for sale
- Lakeway Harbor, Flint homes for sale
- Pecan Valley Ranch, Bullard homes for sale
- The Cumberland Estates, Tyler homes for sale
- The Highlands, Tyler homes for sale
- The Villages, Flint homes for sale
- The Woods, Tyler homes for sale
Zip codes near Wood County, TX
- 75127 homes for sale
- 75140 homes for sale
- 75410 homes for sale
- 75431 homes for sale
- 75440 homes for sale
- 75451 homes for sale
- 75471 homes for sale
- 75480 homes for sale
- 75494 homes for sale
- 75497 homes for sale
- 75644 homes for sale
- 75704 homes for sale
- 75706 homes for sale
- 75755 homes for sale
- 75765 homes for sale
- 75771 homes for sale
- 75773 homes for sale
- 75783 homes for sale
- 75790 homes for sale
- 75792 homes for sale
Protect your home and budget from life's surprises with an Assurant Home Warranty, backed by a partner that supports you through every step of homeownership. Explore Plans.
©2026 Century 21 Real Estate LLC. All rights reserved. CENTURY 21®, the CENTURY 21 Logo and C21® are service marks owned by Century 21 Real Estate LLC. Century 21 Real Estate LLC fully supports the principles of the Fair Housing Act and the Equal Opportunity Act. Each office is independently owned and operated. Listing information is deemed reliable but not guaranteed accurate.