- Alexander Road, Alexander properties for sale
- Cloverdale, Little Rock properties for sale
- Dunbar School, Little Rock properties for sale
- Governor's Mansion, Little Rock properties for sale
- Hanger Hill, Little Rock properties for sale
- Love, Little Rock properties for sale
- Macarthur Park, Little Rock properties for sale
- Martin Luther King, Little Rock properties for sale
- Meadowbrook, Little Rock properties for sale
- OUR, Little Rock properties for sale
- Pettaway, Little Rock properties for sale
- Quapaw Quarter, Little Rock properties for sale
- South End, Little Rock properties for sale
- Stagecoach, Little Rock properties for sale
- Upper Baseline, Little Rock properties for sale
- Wakefield, Little Rock properties for sale
- West Baseline, Little Rock properties for sale
- Westwood, Little Rock properties for sale
- Windamere, Little Rock properties for sale
- Wright Avenue, Little Rock properties for sale
Woodson, AR - homes for sale
3 of 3 results displayed
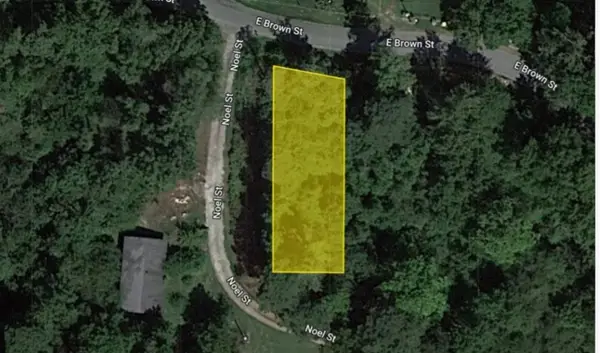 $7,495Active0.17 Acres
Lot 9 E Brown Street, Other AR, AR 72065
MLS# 1310123Listed by: REMAX REAL ESTATE RESULTS $7,495Active0.17 Acres
Lot 9 E Brown Street, Hensley, AR 72065
MLS# 25021567Listed by: RE/MAX REAL ESTATE RESULTS $40,000Active5 Acres
Address Withheld By Seller, Little Rock, AR 72206
MLS# 25003150Listed by: LIVWISE REALTY
Local realty services provided by:CENTURY 21 Lyons & Associates Real Estate, CENTURY 21 PORTFOLIO
Neighborhoods near Woodson, AR
Zip codes near Woodson, AR
- 72011 properties for sale
- 72022 properties for sale
- 72046 properties for sale
- 72065 properties for sale
- 72079 properties for sale
- 72103 properties for sale
- 72114 properties for sale
- 72117 properties for sale
- 72132 properties for sale
- 72142 properties for sale
- 72150 properties for sale
- 72168 properties for sale
- 72201 properties for sale
- 72202 properties for sale
- 72204 properties for sale
- 72205 properties for sale
- 72206 properties for sale
- 72207 properties for sale
- 72209 properties for sale
- 72211 properties for sale
Popular searches near Woodson, AR
- Banner properties for sale
- Barraque properties for sale
- Bolivar properties for sale
- East End properties for sale
- Hensley properties for sale
- Hurricane properties for sale
- Jefferson properties for sale
- Landmark properties for sale
- Little Rock properties for sale
- Mabelvale properties for sale
- Otter properties for sale
- Redfield properties for sale
- Sardis properties for sale
- Scott properties for sale
- Shannon Hills properties for sale
- Simpson properties for sale
- Smith properties for sale
- Sweet Home properties for sale
- Washington properties for sale
- Williams properties for sale
©2025 Century 21 Real Estate LLC. All rights reserved. CENTURY 21®, the CENTURY 21 Logo and C21® are service marks owned by Century 21 Real Estate LLC. Century 21 Real Estate LLC fully supports the principles of the Fair Housing Act and the Equal Opportunity Act. Each office is independently owned and operated. Listing information is deemed reliable but not guaranteed accurate.
©2025 Century 21 Real Estate LLC. All rights reserved. CENTURY 21®, the CENTURY 21 Logo and C21® are service marks owned by Century 21 Real Estate LLC. Century 21 Real Estate LLC fully supports the principles of the Fair Housing Act and the Equal Opportunity Act. Each office is independently owned and operated. Listing information is deemed reliable but not guaranteed accurate.