- 5401 North, Raleigh properties for sale
- Atlantic, Raleigh properties for sale
- Bedford At Falls River, Raleigh properties for sale
- Belvedere Park, Raleigh properties for sale
- Breezewood, Raleigh properties for sale
- Brentwood, Raleigh properties for sale
- East Raleigh, Raleigh properties for sale
- Forestville, Raleigh properties for sale
- Glenwood, Raleigh properties for sale
- Hedingham, Raleigh properties for sale
- Heritage, Wake Forest properties for sale
- Hi-Mount, Raleigh properties for sale
- Highland Creek, Raleigh properties for sale
- Lake Royale, Louisburg properties for sale
- Midtown Raleigh, Raleigh properties for sale
- North Hills, Raleigh properties for sale
- North Raleigh, Raleigh properties for sale
- Northeast Raleigh, Raleigh properties for sale
- Northwest Raleigh, Raleigh properties for sale
- Wakefield Plantation, Raleigh properties for sale
Youngsville, NC - homes for sale
63 of 63 results displayed
- New
 $914,900Active4 beds 4 baths3,296 sq. ft.
3918 Cedar Knolls Drive, Youngsville, NC 27596
MLS# 10136658Listed by: JULIE WRIGHT REALTY GROUP LLC - New
 $750,000Active4 beds 3 baths2,700 sq. ft.
35 Wheatfield Lane #37, Youngsville, NC 27596
MLS# 10136491Listed by: COLDWELL BANKER HPW - New
 $299,985Active3 beds 3 baths1,628 sq. ft.
421 Moose Meadow Way, Youngsville, NC 27596
MLS# 10136435Listed by: ESTEEM PROPERTIES  $280,985Pending3 beds 3 baths1,628 sq. ft.
417 Moose Meadow Way, Youngsville, NC 27596
MLS# 10136437Listed by: ESTEEM PROPERTIES- New
 $297,485Active3 beds 3 baths1,628 sq. ft.
413 Moose Meadow Way, Youngsville, NC 27596
MLS# 10136439Listed by: ESTEEM PROPERTIES  $275,000Pending4 beds 2 baths2,805 sq. ft.
112 N Nassau Street, Youngsville, NC 27596
MLS# 10136303Listed by: EXP REALTY, LLC - C $439,900Active5 beds 3 baths2,667 sq. ft.
110 Symmetry Loop, Youngsville, NC 27596
MLS# 10135622Listed by: IMAGINATION HOMES LLC $469,000Active4 beds 4 baths2,446 sq. ft.
430 Stephens Way, Youngsville, NC 27596
MLS# 10135456Listed by: COLDWELL BANKER HPW- Open Sat, 1:30 to 4:30pm
 $1,275,000Active4 beds 6 baths3,800 sq. ft.
35 Chestnut Oak Drive, Youngsville, NC 27596
MLS# 10134828Listed by: COLDWELL BANKER HPW  $435,000Active4 beds 4 baths2,542 sq. ft.
520 Husketh Road, Youngsville, NC 27596
MLS# 10133120Listed by: REAL BROKER, LLC- Open Sat, 1:30 to 4:30pm
 $950,000Active4 beds 4 baths3,801 sq. ft.
55 Broadleaf Lane, Youngsville, NC 27596
MLS# 10132066Listed by: COLDWELL BANKER HPW  $460,000Active3 beds 3 baths2,352 sq. ft.
103 Anderson Park Drive, Youngsville, NC 27596
MLS# 10131660Listed by: BLUE SKYE REALTY $290,120Pending3 beds 3 baths1,628 sq. ft.
1011 Knickerbocker Lane, Youngsville, NC 27596
MLS# 10131110Listed by: ESTEEM PROPERTIES $285,130Pending3 beds 3 baths1,628 sq. ft.
1009 Knickerbocker Lane, Youngsville, NC 27596
MLS# 10131112Listed by: ESTEEM PROPERTIES $296,110Pending3 beds 3 baths1,628 sq. ft.
1007 Knickerbocker Lane, Youngsville, NC 27596
MLS# 10131114Listed by: ESTEEM PROPERTIES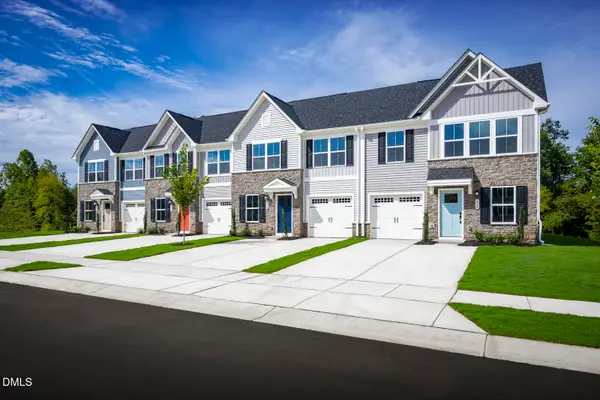 $294,610Pending3 beds 3 baths1,628 sq. ft.
1005 Knickerbocker Lane, Youngsville, NC 27596
MLS# 10131118Listed by: ESTEEM PROPERTIES $290,120Pending3 beds 3 baths1,628 sq. ft.
1003 Knickerbocker Lane, Youngsville, NC 27596
MLS# 10131119Listed by: ESTEEM PROPERTIES $299,520Pending3 beds 3 baths1,628 sq. ft.
1015 Knickerbocker Lane, Youngsville, NC 27596
MLS# 10131099Listed by: ESTEEM PROPERTIES $290,120Pending3 beds 3 baths1,628 sq. ft.
1013 Knickerbocker Lane, Youngsville, NC 27596
MLS# 10131109Listed by: ESTEEM PROPERTIES $1,125,000Active4 beds 4 baths3,881 sq. ft.
25 Chestnut Oak Drive, Youngsville, NC 27596
MLS# 10130741Listed by: LPT REALTY LLC- Open Sat, 1:30 to 4:30pm
 $1,250,000Active4 beds 4 baths3,934 sq. ft.
15 Chestnut Oak Drive, Youngsville, NC 27596
MLS# 10130752Listed by: COLDWELL BANKER HPW  $410,000Active3 beds 3 baths2,444 sq. ft.
140 Hickory Run Lane, Youngsville, NC 27596
MLS# 10128945Listed by: WINLAND REALTY, LLC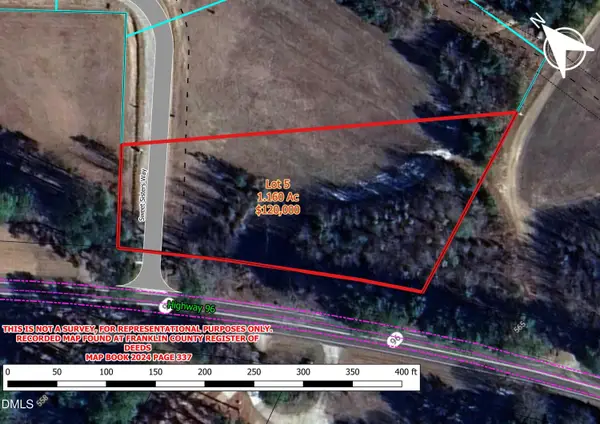 $120,000Pending1.16 Acres
5 Sweet Sisters Way, Youngsville, NC 27596
MLS# 10125416Listed by: JULIE WRIGHT REALTY GROUP LLC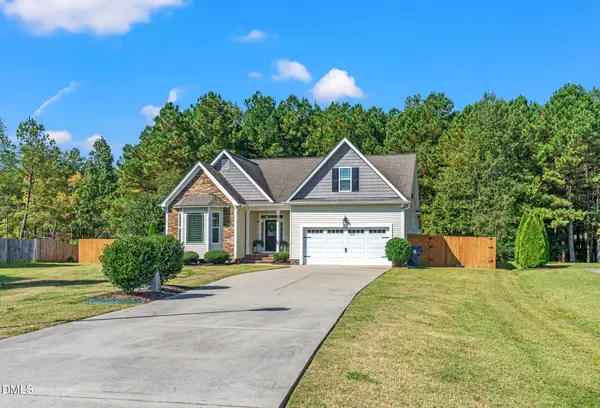 $475,000Pending3 beds 2 baths2,033 sq. ft.
30 Kinderkamack Rd. Road, Youngsville, NC 27596
MLS# 10124926Listed by: JULIE WRIGHT REALTY GROUP LLC $315,000Active4 beds 2 baths1,606 sq. ft.
146 Clark Court, Youngsville, NC 27596
MLS# 10123738Listed by: MAINSTAY BROKERAGE LLC $795,000Active4 beds 3 baths2,983 sq. ft.
3903 Cedar Knolls Drive Drive, Youngsville, NC 27596
MLS# 10122422Listed by: JULIE WRIGHT REALTY GROUP LLC $935,000Active4 beds 5 baths3,084 sq. ft.
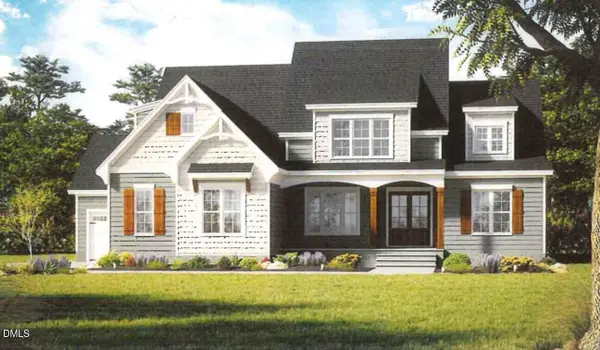
3922 Cedar Knolls Drive, Youngsville, NC 27596
MLS# 10120718Listed by: JULIE WRIGHT REALTY GROUP LLC- Open Sat, 1:30 to 4:30pm
 $960,000Pending4 beds 4 baths3,261 sq. ft.
25 Geranium Drive, Youngsville, NC 27596
MLS# 10120527Listed by: COLDWELL BANKER HPW  $925,000Pending4 beds 4 baths3,545 sq. ft.
3906 Cedar Knolls Drive, Youngsville, NC 27596
MLS# 10120212Listed by: JULIE WRIGHT REALTY GROUP LLC $565,000Active4 beds 3 baths3,109 sq. ft.
25 Paddy Lane, Youngsville, NC 27596
MLS# 10120111Listed by: REALTY ONE GROUP GREENER SIDE- Open Sat, 1:30 to 4:30pm
 $1,245,000Active4 beds 4 baths3,899 sq. ft.
65 Chestnut Oak Drive, Youngsville, NC 27596
MLS# 10119442Listed by: COLDWELL BANKER HPW  $880,000Active4 beds 4 baths3,091 sq. ft.
3919 Cedar Knolls Drive, Youngsville, NC 27596
MLS# 10119388Listed by: JULIE WRIGHT REALTY GROUP LLC $442,900Active3 beds 3 baths2,018 sq. ft.
40 Oscar Wilde Way, Youngsville, NC 27596
MLS# 10118820Listed by: MARK SPAIN REAL ESTATE $795,000Active3 beds 4 baths2,791 sq. ft.
3907 Cedar Knolls Drive #Lot 5, Youngsville, NC 27596
MLS# 10116164Listed by: JULIE WRIGHT REALTY GROUP LLC $392,000Active4 beds 2 baths2,105 sq. ft.
15 Iris Drive, Youngsville, NC 27596
MLS# 10115193Listed by: TRANSITION REALTY GROUP $600,000Active3 beds 3 baths2,678 sq. ft.
121 Mayfield Place, Youngsville, NC 27596
MLS# 10114326Listed by: EXP REALTY LLC $459,000Pending3 beds 3 baths2,550 sq. ft.
137 Sugarmaple Way, Youngsville, NC 27596
MLS# 10113271Listed by: COLDWELL BANKER HPW $375,000Active3 beds 2 baths1,685 sq. ft.
105 W Franklin Street, Youngsville, NC 27596
MLS# 10112174Listed by: FATHOM REALTY NC $475,000Active4 beds 4 baths2,762 sq. ft.
136 Sugarmaple Way, Youngsville, NC 27596
MLS# 10110676Listed by: COLDWELL BANKER HPW $635,451Pending4 beds 5 baths3,675 sq. ft.
135 Guardian Street, Youngsville, NC 27596
MLS# 10109261Listed by: COLDWELL BANKER HPW- Open Sat, 1:30 to 4:30pm
 $1,150,000Active4 beds 4 baths3,581 sq. ft.
65 Spanish Oak Drive, Youngsville, NC 27596
MLS# 10107702Listed by: COLDWELL BANKER HPW - Open Sat, 10am to 5pm
 $625,000Active4 beds 4 baths4,150 sq. ft.
115 Guardian Street, Youngsville, NC 27596
MLS# 10106685Listed by: COLDWELL BANKER HPW - Open Sat, 10am to 5pm
 $650,000Active5 beds 4 baths4,150 sq. ft.
105 Guardian Street, Youngsville, NC 27596
MLS# 10106579Listed by: COLDWELL BANKER HPW  $1,151,000Pending4 beds 4 baths3,393 sq. ft.
3916 Cedar Knolls Drive Drive, Youngsville, NC 27596
MLS# 10106370Listed by: JULIE WRIGHT REALTY GROUP LLC $610,662Pending4 beds 4 baths3,428 sq. ft.
85 Guardian Street, Youngsville, NC 27596
MLS# 10103433Listed by: COLDWELL BANKER HPW- Open Fri, 10am to 5pm
 $645,000Pending4 beds 4 baths4,150 sq. ft.
75 Guardian Street, Youngsville, NC 27596
MLS# 10103387Listed by: COLDWELL BANKER HPW - Open Fri, 10am to 5pm
 $625,000Pending5 beds 4 baths4,150 sq. ft.
60 Guardian Street, Youngsville, NC 27596
MLS# 10101845Listed by: COLDWELL BANKER HPW - Open Sat, 10am to 5pm
 $625,000Active4 beds 4 baths4,150 sq. ft.
40 Bold Drive, Youngsville, NC 27596
MLS# 10100926Listed by: COLDWELL BANKER HPW - Open Sat, 2 to 4pm
 $899,900Active4 beds 4 baths3,154 sq. ft.
3905 Cedar Knolls Drive, Youngsville, NC 27596
MLS# 10098107Listed by: JULIE WRIGHT REALTY GROUP LLC - Open Sat, 10am to 5pm
 $550,000Active5 beds 4 baths3,382 sq. ft.
40 Accord Drive, Youngsville, NC 27596
MLS# 10094983Listed by: COLDWELL BANKER HPW - Open Sat, 10am to 5pm
 $579,000Active5 beds 5 baths3,675 sq. ft.
15 Guardian Street, Youngsville, NC 27596
MLS# 10094960Listed by: COLDWELL BANKER HPW  $369,900Active3 beds 3 baths1,773 sq. ft.
230 Purple Aster St Street, Youngsville, NC 27596
MLS# 10092893Listed by: NORTHGROUP REAL ESTATE, INC. $899,990Active4 beds 3 baths3,242 sq. ft.
3920 Cedar Knolls Drive Drive #18, Youngsville, NC 27596
MLS# 10088011Listed by: JULIE WRIGHT REALTY GROUP LLC $859,900Pending5 beds 5 baths3,818 sq. ft.
70 Valebrook Court, Youngsville, NC 27596
MLS# 10087388Listed by: EASTWOOD CONSTRUCTION LLC- Open Sat, 10am to 5pm
 $575,000Active4 beds 5 baths3,675 sq. ft.
20 Bold Drive, Youngsville, NC 27596
MLS# 10086116Listed by: COLDWELL BANKER HPW  $985,000Pending4 beds 4 baths3,251 sq. ft.
95 Spanish Oak Drive, Youngsville, NC 27596
MLS# 10080762Listed by: COLDWELL BANKER HPW $775,000Pending4 beds 3 baths2,690 sq. ft.
3909 Cedar Knolls Drive #Lot 6, Youngsville, NC 27596
MLS# 10076138Listed by: JULIE WRIGHT REALTY GROUP LLC $829,900Active4 beds 4 baths3,281 sq. ft.
3925 Cedar Knolls Drive, Youngsville, NC 27596
MLS# 10131667Listed by: JULIE WRIGHT REALTY GROUP LLC $125,000Pending1.27 Acres
25 Sweet Sisters Way, Youngsville, NC 27596
MLS# 10125415Listed by: JULIE WRIGHT REALTY GROUP LLC $1,388,184Pending4 beds 6 baths4,394 sq. ft.
60 Chestnut Oak Drive, Youngsville, NC 27596
MLS# 10066679Listed by: COLDWELL BANKER HPW $525,000Pending4 beds 3 baths2,593 sq. ft.
416 S Cross Street, Youngsville, NC 27596
MLS# 10044036Listed by: COLDWELL BANKER HPW- Open Fri, 1 to 5pm
 $399,900Pending4 beds 3 baths2,642 sq. ft.
20 Nebbiolo Drive, Youngsville, NC 27596
MLS# 10032762Listed by: COLDWELL BANKER HPW  $629,900Pending4 beds 4 baths3,185 sq. ft.
120 Ironwood Boulevard #Gh 29, Youngsville, NC 27596
MLS# 2505454Listed by: EASTWOOD CONSTRUCTION LLC
Local realty services provided by:CENTURY 21 Total Real Estate Solutions
Listings marked with a Doorify MLS icon are provided courtesy of the Doorify MLS, of North Carolina, Internet Data Exchange Database. Brokers make an effort to deliver accurate information, but buyers should independently verify any information on which they will rely in a transaction. The listing broker shall not be responsible for any typographical errors, misinformation, or misprints, and they shall be held totally harmless from any damages arising from reliance upon this data. This data is provided exclusively for consumers’ personal, non-commercial use. Copyright 2025 Doorify MLS of North Carolina. All rights reserved.
Neighborhoods near Youngsville, NC
Zip codes near Youngsville, NC
- 27508 properties for sale
- 27522 properties for sale
- 27525 properties for sale
- 27544 properties for sale
- 27545 properties for sale
- 27549 properties for sale
- 27571 properties for sale
- 27587 properties for sale
- 27591 properties for sale
- 27596 properties for sale
- 27597 properties for sale
- 27604 properties for sale
- 27608 properties for sale
- 27609 properties for sale
- 27612 properties for sale
- 27613 properties for sale
- 27614 properties for sale
- 27615 properties for sale
- 27616 properties for sale
- 27617 properties for sale
Popular searches near Youngsville, NC
- Bartons Creek properties for sale
- Brassfield properties for sale
- Bunn properties for sale
- Creedmoor properties for sale
- Dunn properties for sale
- Franklinton properties for sale
- Franklinton Township properties for sale
- Harris properties for sale
- House Creek properties for sale
- Kittrell properties for sale
- Kittrell Township properties for sale
- Little River properties for sale
- Louisburg properties for sale
- Louisburg township properties for sale
- Neuse properties for sale
- New Light properties for sale
- Rolesville properties for sale
- Wake Forest properties for sale
- Wake Forest Township properties for sale
- Youngsville Township properties for sale
©2025 Century 21 Real Estate LLC. All rights reserved. CENTURY 21®, the CENTURY 21 Logo and C21® are service marks owned by Century 21 Real Estate LLC. Century 21 Real Estate LLC fully supports the principles of the Fair Housing Act and the Equal Opportunity Act. Each office is independently owned and operated. Listing information is deemed reliable but not guaranteed accurate.
©2025 Century 21 Real Estate LLC. All rights reserved. CENTURY 21®, the CENTURY 21 Logo and C21® are service marks owned by Century 21 Real Estate LLC. Century 21 Real Estate LLC fully supports the principles of the Fair Housing Act and the Equal Opportunity Act. Each office is independently owned and operated. Listing information is deemed reliable but not guaranteed accurate.