- Beaver homes for sale
- Beaver homes for sale
- Beryl homes for sale
- Beryl-Newcastle homes for sale
- Circleville homes for sale
- Elsinore homes for sale
- Enoch homes for sale
- Fillmore homes for sale
- Hinckley homes for sale
- Joseph homes for sale
- Kanosh homes for sale
- Marysvale homes for sale
- Meadow homes for sale
- Milford homes for sale
- Milford-Minersville homes for sale
- Oasis homes for sale
- Paragonah homes for sale
- Parowan homes for sale
- Sevier homes for sale
- Summit homes for sale
84713, UT - homes for sale
124 of 124 results displayed
- New
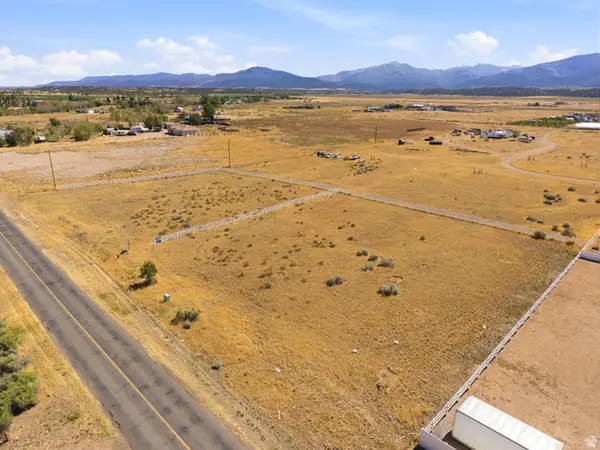 $220,000Active2 Acres
1836 N Highway 357 #1 & 2, Beaver, UT 84713
MLS# 2171583Listed by: REAL BROKER, LLC - New
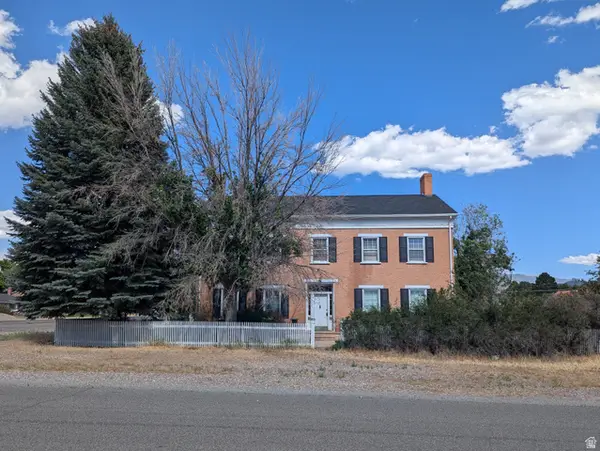 $395,000Active4 beds 2 baths3,208 sq. ft.
190 N 200 E, Beaver, UT 84713
MLS# 2170591Listed by: SKY REALTY - New
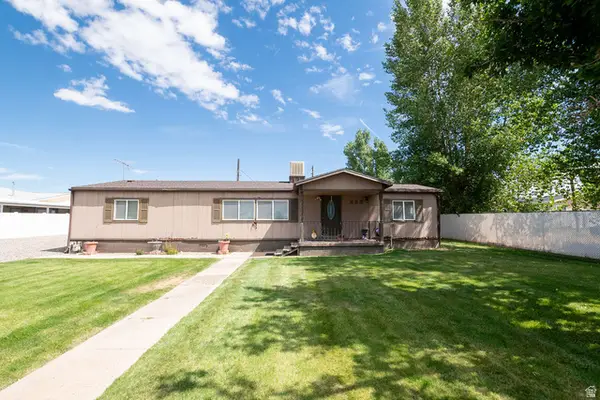 $389,000Active3 beds 2 baths1,647 sq. ft.
855 E 300 N, Beaver, UT 84713
MLS# 2170065Listed by: ERA BROKERS CONSOLIDATED (BEAVER BRANCH) 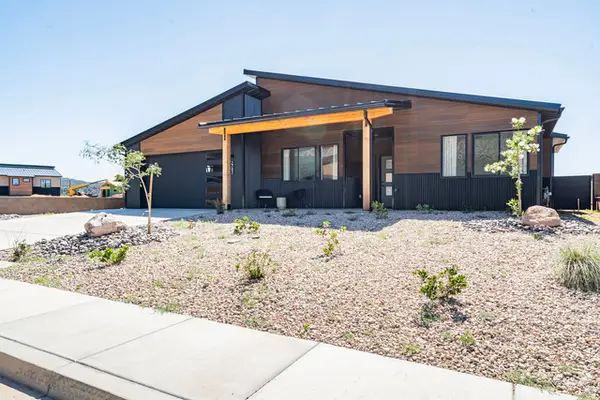 $499,000Active3 beds 2 baths1,574 sq. ft.
2702 S Mann Ln, Cedar City, UT 84720
MLS# 2167868Listed by: PRESTIGE REALTY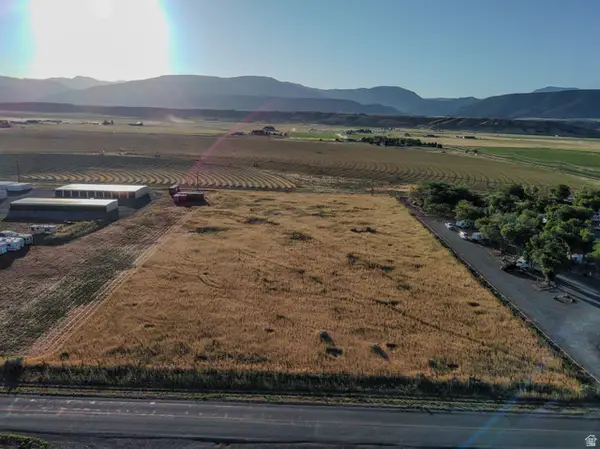 $495,000Active5.77 Acres
1500 N Hwy 357, Beaver, UT 84713
MLS# 2167743Listed by: ERA BROKERS CONSOLIDATED (BEAVER BRANCH) $135,000Active320 Acres
16300 S 23500 W, Fillmore, UT 84631
MLS# 2165696Listed by: SIGNATURE REAL ESTATE SERVICES INC $239,000Active2 beds 1 baths1,317 sq. ft.
390 W 100 N, Beaver, UT 84713
MLS# 2165569Listed by: ERA BROKERS CONSOLIDATED (BEAVER BRANCH) $1,415,000Active16 beds 9 baths7,212 sq. ft.
535 W 2530 N #23-28, Cedar City, UT 84720
MLS# 2165204Listed by: ELEMENT REAL ESTATE BROKERS LLC $248,000Active3 beds 2 baths1,270 sq. ft.
535 W 2530 N #35, Cedar City, UT 84721
MLS# 2163815Listed by: ELEMENT REAL ESTATE BROKERS LLC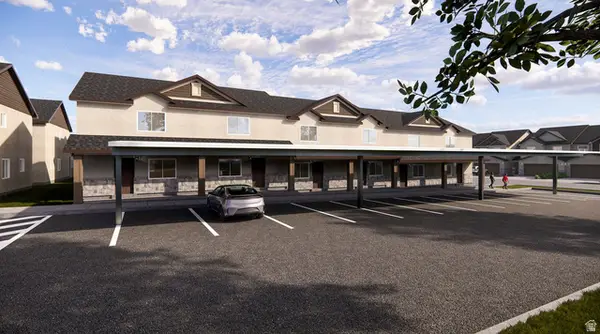 $243,000Active3 beds 2 baths1,270 sq. ft.
535 W 2530 N #36, Cedar City, UT 84721
MLS# 2163816Listed by: ELEMENT REAL ESTATE BROKERS LLC $223,000Active2 beds 2 baths986 sq. ft.
535 W 2530 N #37, Cedar City, UT 84721
MLS# 2163820Listed by: ELEMENT REAL ESTATE BROKERS LLC $1,415,000Active16 beds 9 baths7,104 sq. ft.
535 W 2530 N #41-46, Cedar City, UT 84721
MLS# 2163823Listed by: ELEMENT REAL ESTATE BROKERS LLC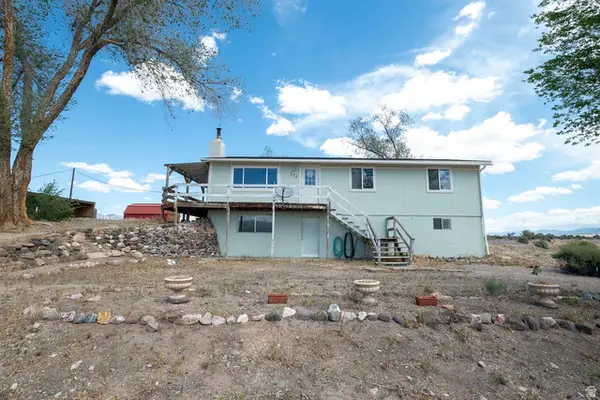 $469,900Active5 beds 2 baths2,256 sq. ft.
570 W Main St, Greenville, UT 84731
MLS# 2160811Listed by: ERA BROKERS CONSOLIDATED (BEAVER BRANCH)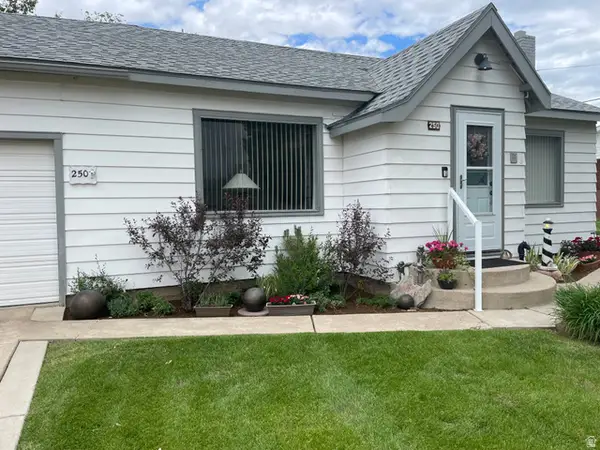 $369,900Active3 beds 1 baths1,372 sq. ft.
250 W 200 N, Beaver, UT 84713
MLS# 2159960Listed by: EQUITY REAL ESTATE (ADVANTAGE)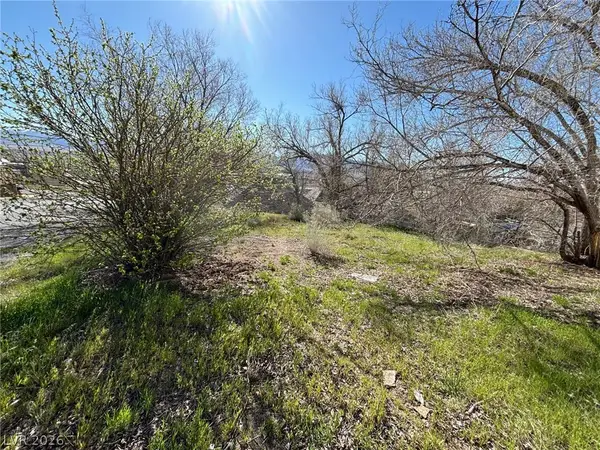 $23,500Active0.06 Acres
253 W 500 S, Other, UT 84751
MLS# 2774005Listed by: REALTY ONE GROUP, INC $670,000Active5 beds 3 baths4,700 sq. ft.
450 W 300 N, Milford, UT 84751
MLS# 2157719Listed by: INTERMOUNTAIN PROPERTIES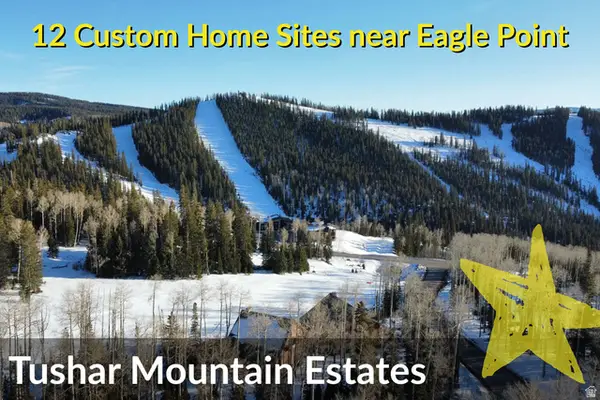 $295,000Active0.9 Acres
3 Tushar Mountain Ests #3, Beaver, UT 84713
MLS# 2156536Listed by: REALTY ABSOLUTE $295,000Active0.98 Acres
6 Tushar Mountain Ests #6, Beaver, UT 84713
MLS# 2156543Listed by: REALTY ABSOLUTE $225,000Active1 Acres
9 Tushar Mountain Ests #9, Beaver, UT 84713
MLS# 2156556Listed by: REALTY ABSOLUTE $195,000Active0.65 Acres
12 Tushar Mountain Ests #12, Beaver, UT 84713
MLS# 2156561Listed by: REALTY ABSOLUTE $859,900Active7 beds 5 baths6,178 sq. ft.
865 E 1800 N, Beaver, UT 84713
MLS# 2155833Listed by: ERA BROKERS CONSOLIDATED (BEAVER BRANCH) $169,000Active3 beds 2 baths1,052 sq. ft.
481 N 100 W #MP12, Milford, UT 84751
MLS# 2153573Listed by: FATHOM REALTY (ST GEORGE) $163,000Active3 beds 2 baths1,052 sq. ft.
481 N 100 W #MP13, Milford, UT 84751
MLS# 2153574Listed by: FATHOM REALTY (ST GEORGE) $159,000Active3 beds 2 baths1,052 sq. ft.
481 N 100 W #21, Milford, UT 84751
MLS# 2153575Listed by: FATHOM REALTY (ST GEORGE) $159,000Active3 beds 2 baths1,052 sq. ft.
481 N 100 W #22, Milford, UT 84751
MLS# 2153578Listed by: FATHOM REALTY (ST GEORGE) $159,000Active3 beds 2 baths1,052 sq. ft.
481 N 100 W #23, Milford, UT 84751
MLS# 2153579Listed by: FATHOM REALTY (ST GEORGE) $159,000Active3 beds 2 baths1,052 sq. ft.
481 N 100 W #31, Milford, UT 84751
MLS# 2153581Listed by: FATHOM REALTY (ST GEORGE) $163,000Active3 beds 2 baths1,052 sq. ft.
481 N 100 W #51, Milford, UT 84751
MLS# 2153582Listed by: FATHOM REALTY (ST GEORGE) $163,000Active3 beds 2 baths1,052 sq. ft.
481 N 100 W #52, Milford, UT 84751
MLS# 2153583Listed by: FATHOM REALTY (ST GEORGE) $163,000Active3 beds 2 baths1,052 sq. ft.
481 N 100 W #53, Milford, UT 84751
MLS# 2153588Listed by: FATHOM REALTY (ST GEORGE) $163,000Active3 beds 2 baths1,052 sq. ft.
481 N 100 W #54, Milford, UT 84751
MLS# 2153589Listed by: FATHOM REALTY (ST GEORGE) $145,000Pending320 Acres
24000 W 17300 S, Fillmore, UT 84631
MLS# 2151933Listed by: SIGNATURE REAL ESTATE SERVICES INC $299,900Active1 beds 1 baths885 sq. ft.
70 E Hwy 153 #a4, Beaver, UT 84713
MLS# 2151860Listed by: GRANT REAL ESTATE, LLC $385,000Active4 beds 3 baths2,704 sq. ft.
119 S 300 W, Milford, UT 84751
MLS# 2151096Listed by: EXP REALTY, LLC (SOUTHERN UTAH) $849,900Pending5 beds 4 baths4,642 sq. ft.
3125 E 3080 N Mt Belknap Pl, Beaver, UT 84713
MLS# 2149448Listed by: COLDWELL BANKER ADVANTAGE REAL ESTATE CORPORATION $545,000Active3 beds 3 baths1,927 sq. ft.
745 E 885 N, Beaver, UT 84713
MLS# 2148968Listed by: ERA BROKERS CONSOLIDATED (BEAVER BRANCH) $385,000Active5 beds 3 baths2,208 sq. ft.
191 E 1000 N, Beaver, UT 84713
MLS# 2147243Listed by: ERA BROKERS CONSOLIDATED (BEAVER BRANCH) $349,900Pending3 beds 1 baths1,482 sq. ft.
340 W 100 N, Beaver, UT 84713
MLS# 2147207Listed by: ERA BROKERS CONSOLIDATED (BEAVER BRANCH) $575,000Active30 Acres
1 Hwy 161 I-70, Exit 1, Fillmore, UT 84631
MLS# 2137777Listed by: SIGNATURE REAL ESTATE SERVICES INC $95,000Active0.45 Acres
495 N Main St, Beaver, UT 84713
MLS# 2146016Listed by: EXP REALTY, LLC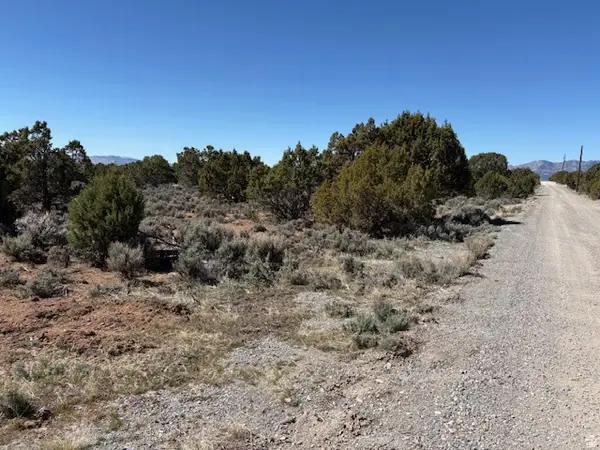 $249,999Pending10 Acres
3500 N 1050 E, Beaver, UT 84713
MLS# 2145939Listed by: ERA BROKERS CONSOLIDATED (BEAVER BRANCH)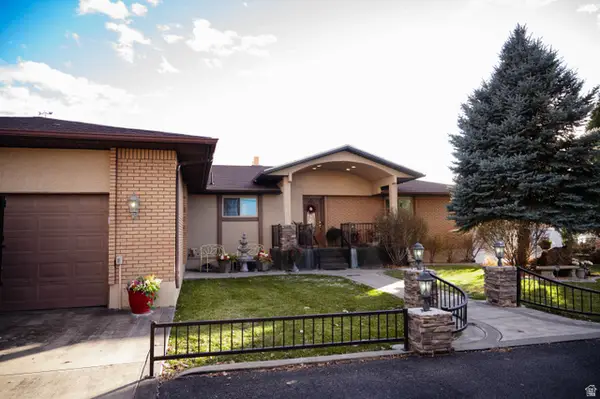 $549,000Active4 beds 3 baths4,058 sq. ft.
110 E 300 S, Beaver, UT 84713
MLS# 2146003Listed by: ERA BROKERS CONSOLIDATED (BEAVER BRANCH)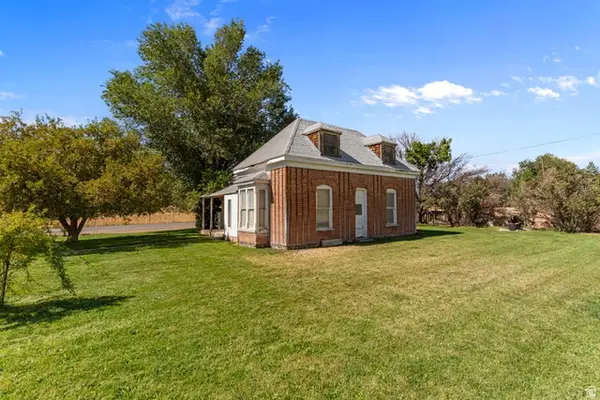 $155,000Pending3 beds 1 baths1,300 sq. ft.
482 W 100 N, Beaver, UT 84713
MLS# 2145657Listed by: REAL BROKER, LLC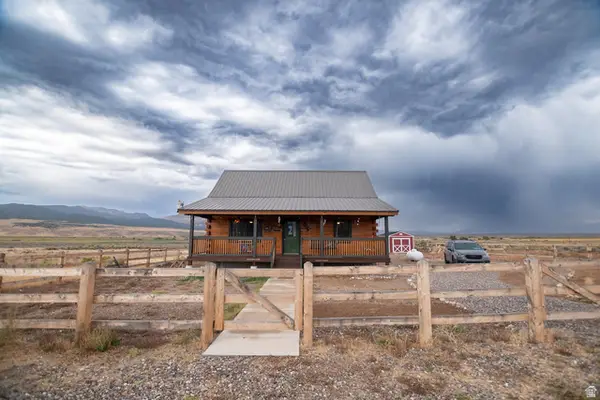 $379,000Active3 beds 3 baths2,229 sq. ft.
80 W 1050 S, Adamsville, UT 84731
MLS# 2145331Listed by: STRATUM REAL ESTATE GROUP PLLC (SOUTH BRANCH) $295,000Pending5 beds 4 baths3,227 sq. ft.
50 S 100 W, Beaver, UT 84713
MLS# 2145132Listed by: ERA BROKERS CONSOLIDATED (BEAVER BRANCH)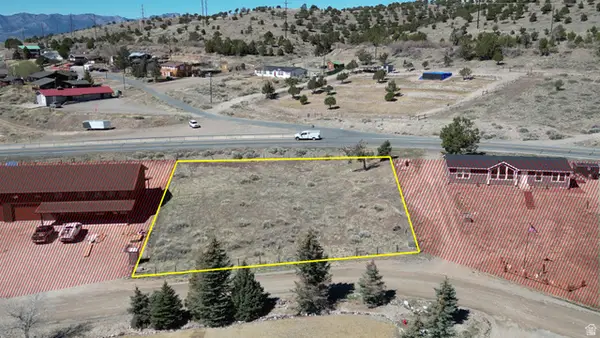 $95,000Pending0.59 Acres
1859 E 495 N #9, Beaver, UT 84713
MLS# 2145013Listed by: EXP REALTY, LLC (SOUTHERN UTAH) $120,000Pending5.42 Acres
29 R7w S4 #22, Beaver, UT 84713
MLS# 2143126Listed by: LRG COLLECTIVE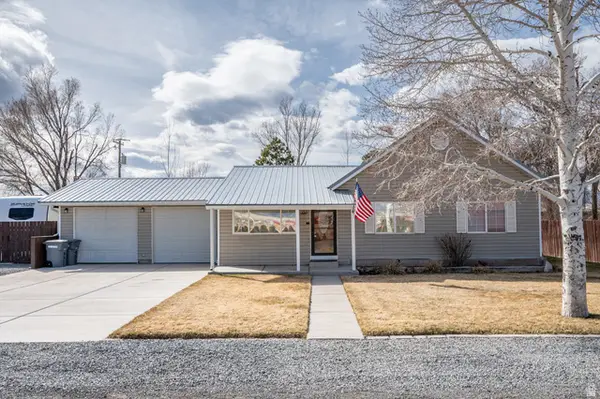 $295,000Pending3 beds 2 baths1,929 sq. ft.
251 N 300 W, Milford, UT 84751
MLS# 2142462Listed by: ERA REALTY CENTER INC $275,000Active0.68 Acres
1 Tushar Mountain Ests #1, Beaver, UT 84713
MLS# 2141287Listed by: REALTY ABSOLUTE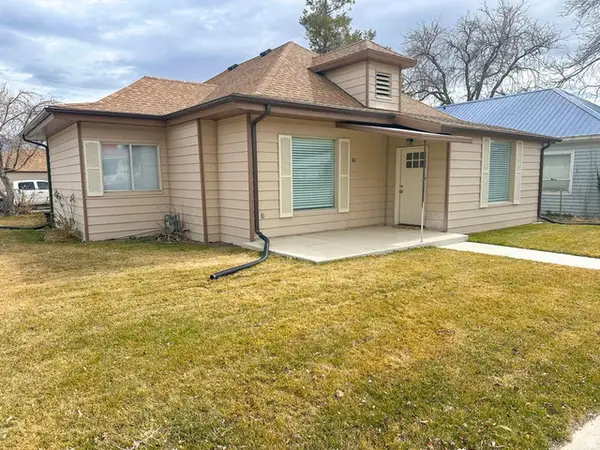 $300,000Pending3 beds 2 baths1,853 sq. ft.
82 N Main St, Milford, UT 84751
MLS# 2139949Listed by: D & B REAL ESTATE CEDAR CITY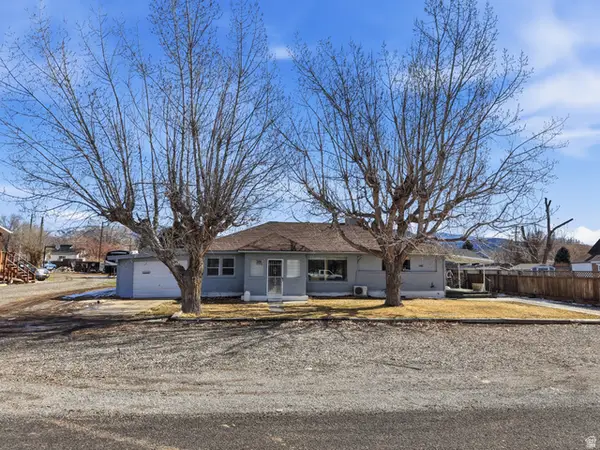 $320,000Pending4 beds 2 baths2,085 sq. ft.
360 N 300 E, Beaver, UT 84713
MLS# 2139430Listed by: REAL ESTATE ESSENTIALS $384,000Active3 beds 1 baths1,429 sq. ft.
25 N 400 W, Beaver, UT 84713
MLS# 2139017Listed by: ERA BROKERS CONSOLIDATED (BEAVER BRANCH) $449,900Pending3 beds 3 baths1,680 sq. ft.
331 W 900 S Greenville S, Beaver, UT 84713
MLS# 2138788Listed by: ERA BROKERS CONSOLIDATED (BEAVER BRANCH) $370,000Active3 beds 3 baths2,592 sq. ft.
405 N 1200 E, Beaver, UT 84713
MLS# 2137478Listed by: RED ROCK REAL ESTATE LLC $259,000Active2 beds 1 baths1,400 sq. ft.
495 N Main St, Beaver, UT 84713
MLS# 2137253Listed by: EXP REALTY, LLC $269,000Active3 beds 2 baths1,304 sq. ft.
290 N 100 St E, Beaver, UT 84713
MLS# 2137142Listed by: LRG COLLECTIVE $349,000Pending4 beds 2 baths1,868 sq. ft.
297 N 500 St W, Milford, UT 84751
MLS# 2136192Listed by: FATHOM REALTY (CEDAR CITY) $70,000Pending0.46 Acres
165 N 500 E, Beaver, UT 84713
MLS# 2134552Listed by: ERA BROKERS CONSOLIDATED (BEAVER BRANCH) $269,000Pending4 beds 1 baths1,452 sq. ft.
495 E 100 N, Beaver, UT 84713
MLS# 2134444Listed by: ERA BROKERS CONSOLIDATED (BEAVER BRANCH) $599,900Active5 beds 4 baths3,994 sq. ft.
135 E 200 N, Beaver, UT 84713
MLS# 2134448Listed by: CS REAL ESTATE GROUP PLLC $700,000Pending4 beds 2 baths2,450 sq. ft.
1380 E 5300 S, Milford, UT 84751
MLS# 2133890Listed by: SIGNATURE REAL ESTATE SERVICES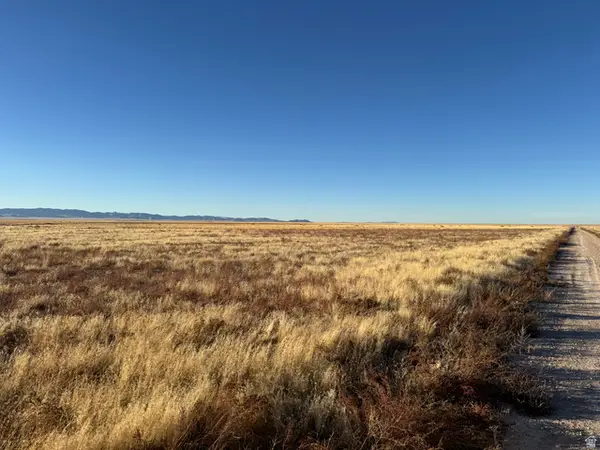 $128,000Pending320 Acres
13000 W 6500 S, Fillmore, UT 84631
MLS# 2133779Listed by: SIGNATURE REAL ESTATE SERVICES INC $339,000Pending3 beds 2 baths1,440 sq. ft.
225 N 1250 E, Beaver, UT 84713
MLS# 2133658Listed by: ERA BROKERS CONSOLIDATED (BEAVER BRANCH) $269,000Pending4 beds 2 baths1,456 sq. ft.
160 E 600 N, Beaver, UT 84713
MLS# 2133672Listed by: ERA BROKERS CONSOLIDATED (BEAVER BRANCH) $549,000Pending4 beds 3 baths3,607 sq. ft.
555 N 1000 E, Beaver, UT 84713
MLS# 2133629Listed by: ERA BROKERS CONSOLIDATED (BEAVER BRANCH) $85,900Pending0.51 Acres
2172 E Spring, Beaver, UT 84713
MLS# 2132896Listed by: ERA REALTY CENTER INC $429,000Active4 beds 2 baths3,672 sq. ft.
1943 E 425 N, Beaver, UT 84713
MLS# 2130428Listed by: ERA BROKERS CONSOLIDATED (BEAVER BRANCH)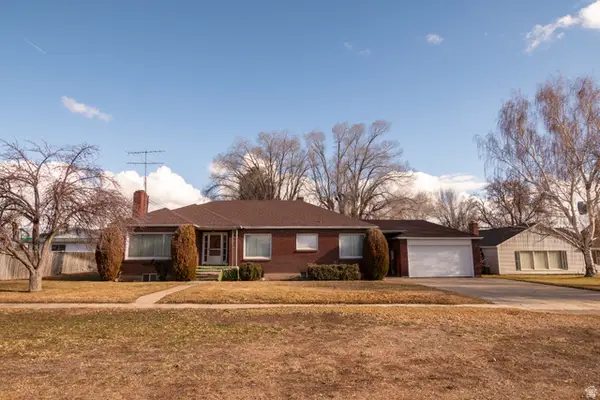 $385,000Active5 beds 2 baths3,398 sq. ft.
160 N 100 W, Beaver, UT 84713
MLS# 2130224Listed by: ERA BROKERS CONSOLIDATED (BEAVER BRANCH)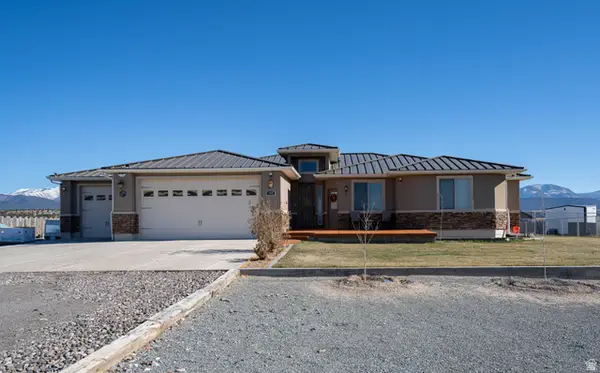 $795,000Pending4 beds 3 baths4,347 sq. ft.
2840 N Westward Dr, Beaver, UT 84713
MLS# 2129106Listed by: ERA BROKERS CONSOLIDATED (BEAVER BRANCH)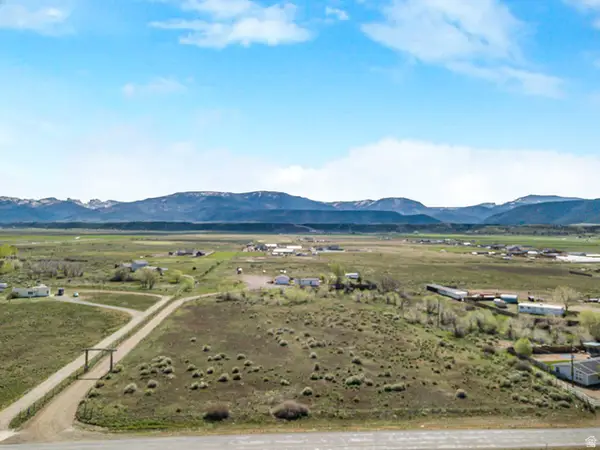 $199,000Active5.25 Acres
2000 N Hwy 357, Beaver, UT 84713
MLS# 2128863Listed by: ERA BROKERS CONSOLIDATED (BEAVER BRANCH)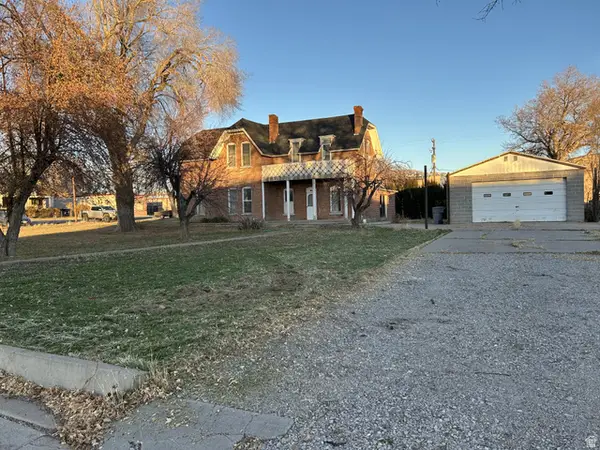 $169,900Pending3 beds 3 baths2,617 sq. ft.
95 W 100 N, Beaver, UT 84713
MLS# 2126200Listed by: REAL BROKER, LLC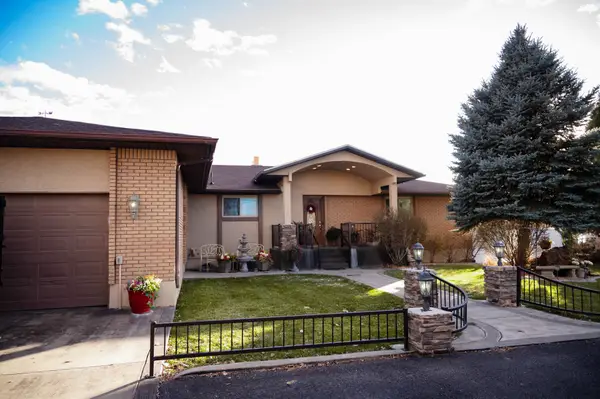 $799,000Active5 beds 3 baths4,058 sq. ft.
110 E 300 S, Beaver, UT 84713
MLS# 2125330Listed by: ERA BROKERS CONSOLIDATED (BEAVER BRANCH)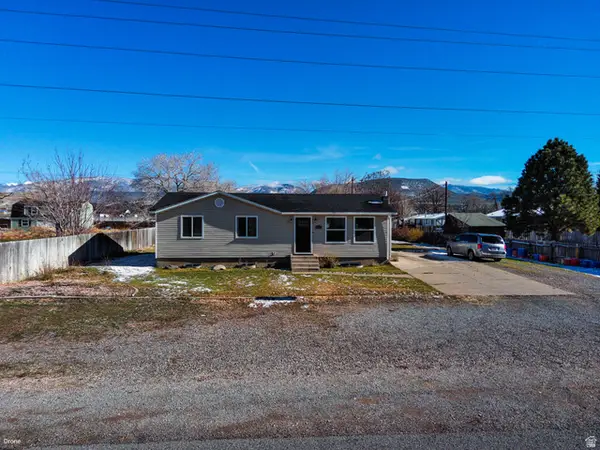 $399,900Pending5 beds 2 baths2,184 sq. ft.
342 N 600 E, Beaver, UT 84713
MLS# 2125154Listed by: ERA BROKERS CONSOLIDATED (BEAVER BRANCH) $225,000Pending3 beds 1 baths1,056 sq. ft.
528 W 300 N, Milford, UT 84751
MLS# 2127792Listed by: FATHOM REALTY (CEDAR CITY) $640,000Pending60 Acres
3025 N North Creek Rd, Beaver, UT 84713
MLS# 2122122Listed by: ERA BROKERS CONSOLIDATED (BEAVER BRANCH)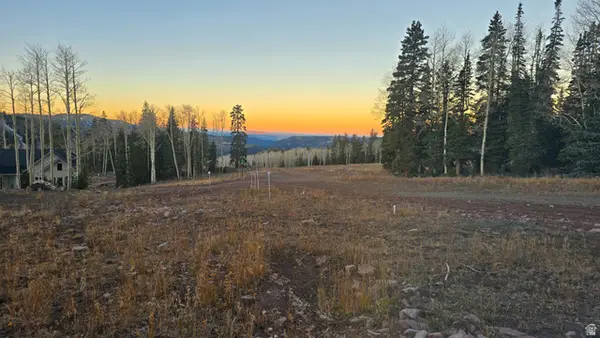 $600,000Active0.48 Acres
289 N Summit Dr #2, Beaver, UT 84713
MLS# 2119919Listed by: ASPEN EQUITY REAL ESTATE, LLC $325,000Pending3 beds 2 baths1,504 sq. ft.
295 N 600 W, Milford, UT 84751
MLS# 2117203Listed by: ERA BROKERS CONSOLIDATED (BEAVER BRANCH)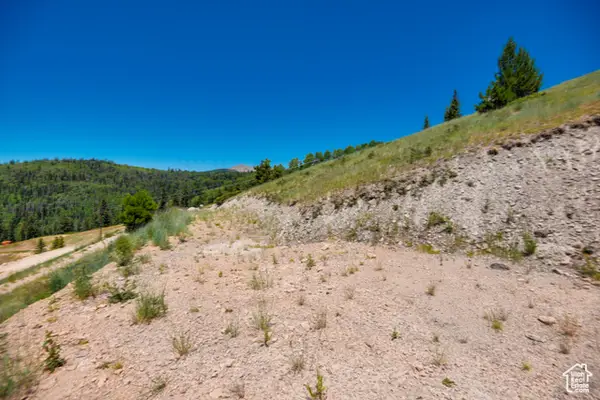 $175,000Active0.58 Acres
W Hyrum Dr #58, Beaver, UT 84713
MLS# 2127407Listed by: FATHOM REALTY (CEDAR CITY) $175,000Active0.5 Acres
W Hyrum Dr #56, Beaver, UT 84713
MLS# 2127410Listed by: FATHOM REALTY (CEDAR CITY)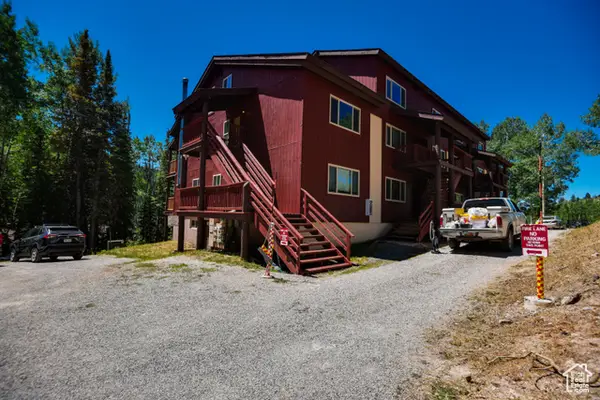 $325,000Active1 beds 1 baths704 sq. ft.
150 S West Cir #18-C, Beaver, UT 84713
MLS# 2127236Listed by: FATHOM REALTY (CEDAR CITY) $566,280Active2.6 Acres
1620 S 525 W, Beaver, UT 84713
MLS# 2115976Listed by: ERA BROKERS CONSOLIDATED (BEAVER BRANCH) $280,000Active3.56 Acres
1120 N 100 E, Beaver, UT 84713
MLS# 2114704Listed by: EXP REALTY, LLC (SOUTHERN UTAH)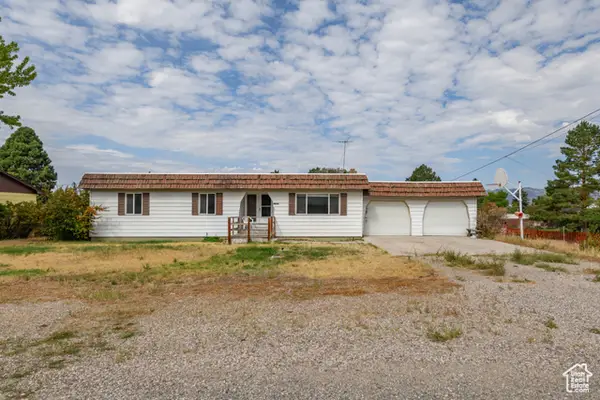 $299,864Pending6 beds 2 baths2,462 sq. ft.
145 N 400 E, Beaver, UT 84713
MLS# 2112312Listed by: KW ASCEND KELLER WILLIAMS REALTY $425,000Pending3 beds 2 baths1,248 sq. ft.
489 E 3700 N, Beaver, UT 84713
MLS# 2111626Listed by: ERA BROKERS CONSOLIDATED (BEAVER BRANCH) $69,000Pending0.36 Acres
70 E 600 N, Beaver, UT 84713
MLS# 2110860Listed by: ERA BROKERS CONSOLIDATED (BEAVER BRANCH) $60,000Pending0.27 Acres
565 N 100 E, Beaver, UT 84713
MLS# 2110874Listed by: ERA BROKERS CONSOLIDATED (BEAVER BRANCH) $449,000Active3 beds 3 baths1,081 sq. ft.
2373 E 190 Navajo Trl N, Beaver, UT 84713
MLS# 2108210Listed by: ERA BROKERS CONSOLIDATED (BEAVER BRANCH) $63,200Active79 Acres
24600 N 1300 W, Milford, UT 84751
MLS# 2107717Listed by: EXP REALTY, LLC (SOUTHERN UTAH) $75,000Active0.29 Acres
750 W 900 S, Milford, UT 84751
MLS# 2139648Listed by: ERA REALTY CENTER INC $760,000Active18.75 Acres
1630 N 900 E, Beaver, UT 84713
MLS# 2104539Listed by: ERA BROKERS CONSOLIDATED (BEAVER BRANCH) $474,000Active15.8 Acres
850 N 500 W, Milford, UT 84751
MLS# 2100457Listed by: ERA BROKERS CONSOLIDATED (BEAVER BRANCH) $1,601,250Active106.75 Acres
1500 N Hwy 257, Milford, UT 84751
MLS# 2100443Listed by: ERA BROKERS CONSOLIDATED (BEAVER BRANCH) $124,500Active4.15 Acres
300 W 900 N, Milford, UT 84751
MLS# 2100450Listed by: ERA BROKERS CONSOLIDATED (BEAVER BRANCH) $51,800Active1.48 Acres
250 W Copper, Milford, UT 84751
MLS# 2100208Listed by: ERA BROKERS CONSOLIDATED (BEAVER BRANCH) $479,000Pending3 beds 2 baths1,780 sq. ft.
365 N 800 E, Beaver, UT 84713
MLS# 2098453Listed by: ERA BROKERS CONSOLIDATED (BEAVER BRANCH) $266,400Active5.92 Acres
320 S 700 W, Milford, UT 84751
MLS# 2092788Listed by: ERA BROKERS CONSOLIDATED (BEAVER BRANCH) $480,000Active24.06 Acres
500 N 200 E, Milford, UT 84751
MLS# 2092757Listed by: ERA BROKERS CONSOLIDATED (BEAVER BRANCH) $168,000Active1.58 Acres
350 N 200 E #1-12, Milford, UT 84751
MLS# 2092769Listed by: ERA BROKERS CONSOLIDATED (BEAVER BRANCH) $420,000Active21.25 Acres
200 E 850 N, Milford, UT 84751
MLS# 2092560Listed by: ERA BROKERS CONSOLIDATED (BEAVER BRANCH) $575,000Pending40 Acres
Address Withheld By Seller, Beaver, UT 84713
MLS# 2092490Listed by: WHITETAIL PROPERTIES REAL ESTATE LLC $450,000Active4.2 Acres
920 W 900 S #1-15, Milford, UT 84751
MLS# 2091359Listed by: ERA BROKERS CONSOLIDATED (BEAVER BRANCH) $1,760,000Active88.94 Acres
1500 S Hwy 21, Milford, UT 84751
MLS# 2091332Listed by: ERA BROKERS CONSOLIDATED (BEAVER BRANCH) $3,652,250Active104.35 Acres
900 W 900 S, Milford, UT 84751
MLS# 2091349Listed by: ERA BROKERS CONSOLIDATED (BEAVER BRANCH) $1,060,000Active53.7 Acres
2000 S Hwy 21, Milford, UT 84751
MLS# 2091322Listed by: ERA BROKERS CONSOLIDATED (BEAVER BRANCH) $375,000Pending5 beds 3 baths3,282 sq. ft.
260 N 100 E, Beaver, UT 84713
MLS# 2086183Listed by: ERA BROKERS CONSOLIDATED (BEAVER BRANCH) $435,000Pending5 beds 2 baths2,867 sq. ft.
118 S 100 W, Milford, UT 84751
MLS# 2086134Listed by: REALTYPATH LLC (CORPORATE) $75,000Active0.28 Acres
Address Withheld By Seller, Milford, UT 84751
MLS# 2085090Listed by: ERA BROKERS CONSOLIDATED (BEAVER BRANCH) $479,900Pending4 beds 3 baths2,244 sq. ft.
1137 E 425 N, Beaver, UT 84713
MLS# 2083383Listed by: ERA BROKERS CONSOLIDATED (BEAVER BRANCH) $289,000Pending2 beds 2 baths1,680 sq. ft.
210 W 400 N, Beaver, UT 84713
MLS# 2115812Listed by: ERA BROKERS CONSOLIDATED (BEAVER BRANCH) $44,000Pending12.91 Acres
Address Withheld By Seller, Beaver, UT 84713
MLS# 1380681Listed by: COLDWELL BANKER COMMERCIAL ADVANTAGE $595,000Pending0.63 Acres
4 Elk #7, Beaver, UT 84713
MLS# 2073105Listed by: ASPEN EQUITY REAL ESTATE, LLC $425,000Active0.5 Acres
1 Elk #1, Beaver, UT 84713
MLS# 2070616Listed by: ASPEN EQUITY REAL ESTATE, LLC $375,000Active0.5 Acres
2 Elk #2, Beaver, UT 84713
MLS# 2070618Listed by: ASPEN EQUITY REAL ESTATE, LLC $144,900Active0.99 Acres
1700 E 200 N, Beaver, UT 84713
MLS# 2129325Listed by: ERA BROKERS CONSOLIDATED (BEAVER BRANCH) $499,000Pending2 beds 2 baths1,296 sq. ft.
2690 E Hwy 153, Beaver, UT 84713
MLS# 2061418Listed by: ERA BROKERS CONSOLIDATED (BEAVER BRANCH) $210,000Pending1 Acres
820 S Kents Lake Rd #5, Beaver, UT 84713
MLS# 2134838Listed by: ERA BROKERS CONSOLIDATED (BEAVER BRANCH) $329,000Active3 beds 2 baths1,814 sq. ft.
410 N Main St, Beaver, UT 84713
MLS# 2052143Listed by: ERA BROKERS CONSOLIDATED (BEAVER BRANCH) $169,000Active4.8 Acres
#9, Beaver, UT 84713
MLS# 2051094Listed by: RED ROCK REAL ESTATE LLC (CENTRAL) $99,000Pending0.57 Acres
1280 N 100 W #2, Beaver, UT 84713
MLS# 2029453Listed by: ERA BROKERS CONSOLIDATED (BEAVER BRANCH) $630,000Active0.63 Acres
7 Elk #7, Beaver, UT 84713
MLS# 2024604Listed by: ASPEN EQUITY REAL ESTATE, LLC $630,000Active0.68 Acres
8 Elk #8, Beaver, UT 84713
MLS# 2024609Listed by: ASPEN EQUITY REAL ESTATE, LLC $145,000Pending3 beds 2 baths1,256 sq. ft.
140 N 500 E, Beaver, UT 84713
MLS# 2007754Listed by: EQUITY REAL ESTATE (SOUTH VALLEY)
 $159,000Pending4.86 Acres
2316 N Oak Tree Ln, Beaver, UT 84713
MLS# 2018280Listed by: CENTURY 21 EVEREST (ST GEORGE) $645,000Pending2 beds 2 baths1,615 sq. ft.
118 Skyline Terrace Way E #9, Beaver, UT 84713
MLS# 1974533Listed by: ASPEN EQUITY REAL ESTATE, LLC
Local realty services provided by:CENTURY 21 Everest, CENTURY 21 1st Priority Realty
Popular searches near 84713
Popular neighborhoods near 84713
- Brookside, Veyo homes for sale
- Central, Central homes for sale
- Dammeron Valley, Dammeron Valley homes for sale
- Diamond Valley Acres, Saint George homes for sale
- New Harmony, New Harmony homes for sale
- Shonto Point, Ivins homes for sale
- Sky Ridge, Hurricane homes for sale
- The Ledges of St. George, Saint George homes for sale
- Winchester Hills, Saint George homes for sale
Protect your home and budget from life's surprises with an Assurant Home Warranty, backed by a partner that supports you through every step of homeownership. Explore Plans.
©2026 Century 21 Real Estate LLC. All rights reserved. CENTURY 21®, the CENTURY 21 Logo and C21® are service marks owned by Century 21 Real Estate LLC. Century 21 Real Estate LLC fully supports the principles of the Fair Housing Act and the Equal Opportunity Act. Each office is independently owned and operated. Listing information is deemed reliable but not guaranteed accurate.