- Arrowhead Lake, Milton homes for sale
- Catamount, Milton homes for sale
- Central Burlington, Burlington homes for sale
- Downtown Burlington, Burlington homes for sale
- East Milton, Milton homes for sale
- Five Avenues, Burlington homes for sale
- Hill Section, Burlington homes for sale
- Lamoille, Milton homes for sale
- Meadows Edge, Essex Junction homes for sale
- Milton Village Center, Milton homes for sale
- New North End, Burlington homes for sale
- Old North End, Burlington homes for sale
- Riverside, Burlington homes for sale
- Shelburne Center, Shelburne homes for sale
- South End, Burlington homes for sale
- South Village, South Burlington homes for sale
- Town Core, Milton homes for sale
- West Claremont, Claremont homes for sale
- West Lebanon, West Lebanon homes for sale
- West Side, Claremont homes for sale
Burlington, VT - homes for sale
150 of 150 results displayed
- New
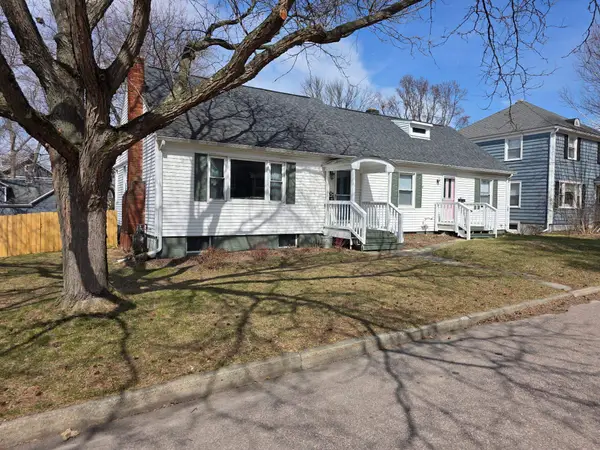
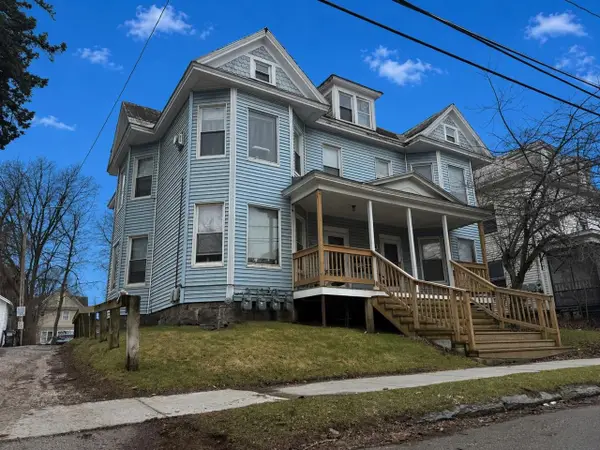
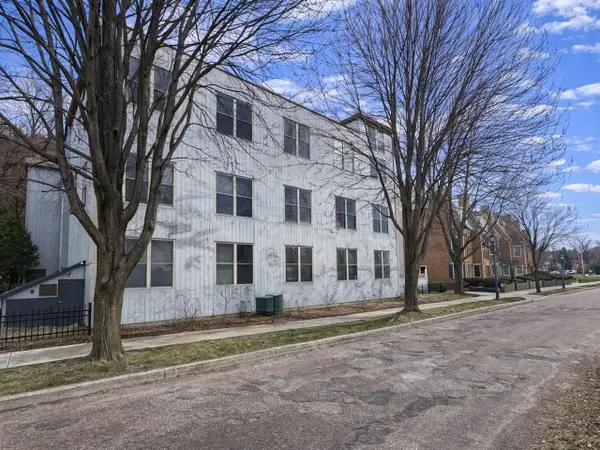
 $699,000Active4 beds -- baths2,172 sq. ft.
68-70 Morse Place, Burlington, VT 05405
MLS# 5085055Listed by: CENTURY 21 THE ONE
- New
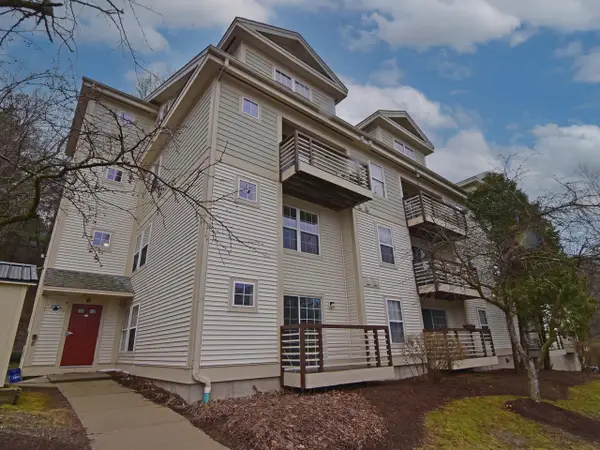
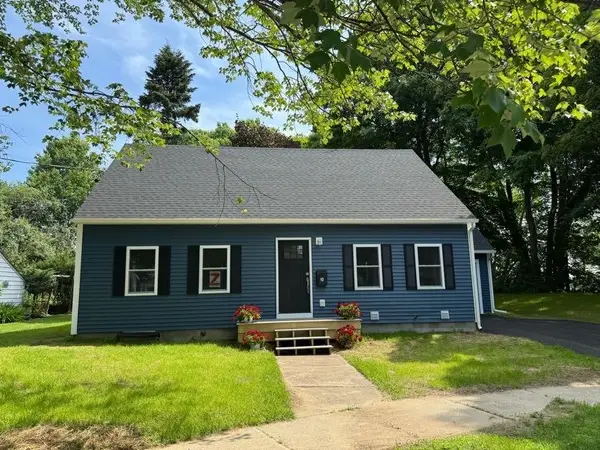
 $639,000Active3 beds 2 baths1,898 sq. ft.
21 Grey Meadow Drive, Burlington, VT 05408
MLS# 5084723Listed by: FLEX REALTY - New
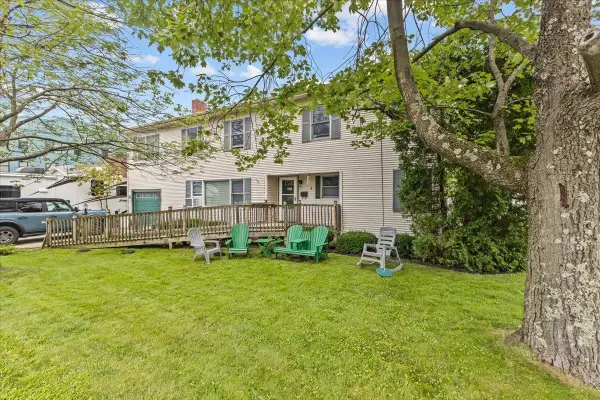
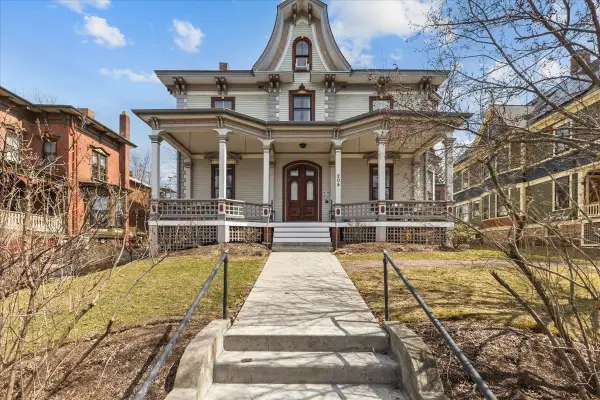
 $1,164,000Active14 beds 4 baths3,462 sq. ft.
36-38 South Union Street, Burlington, VT 05401
MLS# 5084598Listed by: GREATER BURLINGTON HOMES - New
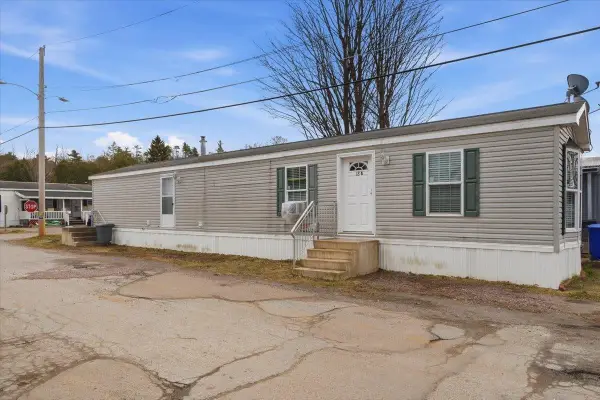
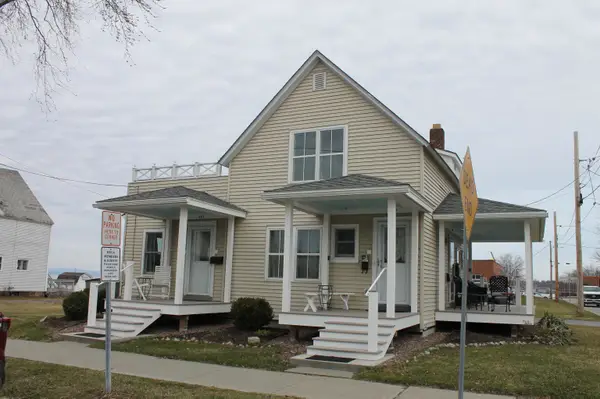
 $299,000Active2 beds 1 baths820 sq. ft.
243 Hildred Drive, Burlington, VT 05401
MLS# 5084447Listed by: COLDWELL BANKER HICKOK AND BOARDMAN - New
 $535,000Active3 beds 1 baths1,667 sq. ft.
265 Pearl Street #A1, Burlington, VT 05401
MLS# 5084403Listed by: VERMONT REAL ESTATE COMPANY - New
 $625,000Active6 beds 4 baths3,103 sq. ft.
330 Flynn Avenue, Burlington, VT 05401
MLS# 5084170Listed by: KELL AND COMPANY 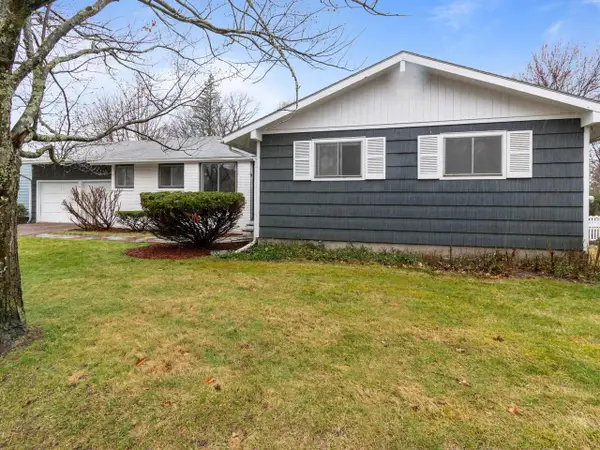 $625,000Pending3 beds 2 baths2,208 sq. ft.
194 Prospect Parkway, Burlington, VT 05401
MLS# 5084012Listed by: COLDWELL BANKER HICKOK AND BOARDMAN- New
 $865,000Active7 beds 4 baths4,243 sq. ft.
31-33 Hickok Place, Burlington, VT 05401
MLS# 5083977Listed by: COLDWELL BANKER HICKOK AND BOARDMAN - New
 $120,000Active2 beds 1 baths840 sq. ft.
18 Avenue A, Burlington, VT 05408
MLS# 5083988Listed by: KW VERMONT - New
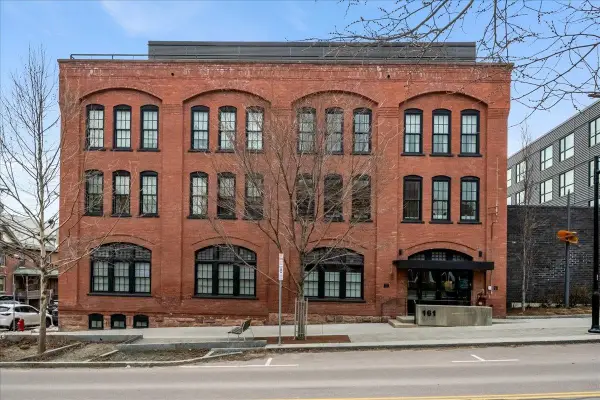 $449,900Active1 beds 1 baths917 sq. ft.
161 St. Paul Street #202, Burlington, VT 05401
MLS# 5083872Listed by: NEDDE REAL ESTATE - Open Sat, 1 to 3pmNew
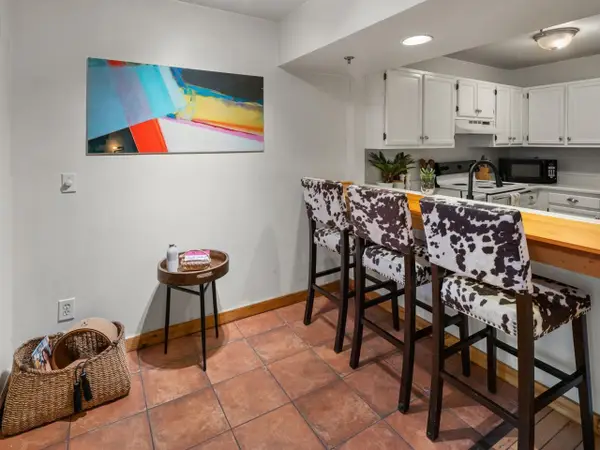 $320,000Active2 beds 1 baths738 sq. ft.
337 College Street #6, Burlington, VT 05401
MLS# 5082856Listed by: COLDWELL BANKER HICKOK AND BOARDMAN - New
 $425,000Active1 beds 1 baths840 sq. ft.
216 Lake Street #303, Burlington, VT 05401
MLS# 5083725Listed by: COLDWELL BANKER HICKOK AND BOARDMAN - New
 $376,000Active1 beds 1 baths585 sq. ft.
204 South Union Street #5, Burlington, VT 05401
MLS# 5083693Listed by: FOUR SEASONS SOTHEBY'S INT'L REALTY  $765,000Active3 beds 3 baths2,336 sq. ft.
51 Trail's Bend Drive #Lot 3, South Burlington, VT 05403
MLS# 5075290Listed by: SIGNATURE PROPERTIES OF VERMONT $765,000Active3 beds 3 baths2,336 sq. ft.
41 Trail's Bend Drive #Lot 4, South Burlington, VT 05403
MLS# 5075332Listed by: SIGNATURE PROPERTIES OF VERMONT- New
 $549,900Active3 beds 2 baths1,404 sq. ft.
24 Bennington Court, Burlington, VT 05408
MLS# 5083471Listed by: GERI REILLY REAL ESTATE - New
 $1,800,000Active3 beds 3 baths1,066 sq. ft.
56 Wright Avenue, Burlington, VT 05401
MLS# 5083392Listed by: BRIAN FRENCH REAL ESTATE - New
 $950,000Active2 beds 3 baths1,566 sq. ft.
545 South Prospect Street #35, Burlington, VT 05401
MLS# 5083255Listed by: FOUR SEASONS SOTHEBY'S INT'L REALTY  $6,950,000Active-- beds 18 baths16,481 sq. ft.
252-260 College Street, Burlington, VT 05401
MLS# 5083112Listed by: FLAT FEE REAL ESTATE $650,000Active3 beds 3 baths1,838 sq. ft.
72 Grey Meadow Drive, Burlington, VT 05408
MLS# 5083077Listed by: VERMONT REAL ESTATE COMPANY $390,000Pending2 beds 2 baths1,122 sq. ft.
65 Pine Ledge Court, Burlington, VT 05401
MLS# 5082989Listed by: POLLI PROPERTIES $644,600Active4 beds 3 baths2,880 sq. ft.
71 Lakewood Parkway, Burlington, VT 05408
MLS# 5082903Listed by: COLDWELL BANKER HICKOK AND BOARDMAN $615,000Active4 beds 2 baths2,136 sq. ft.
460-462 Colchester Avenue, Burlington, VT 05401
MLS# 5082809Listed by: COLDWELL BANKER HICKOK AND BOARDMAN $180,000Pending3 beds 1 baths1,248 sq. ft.
218 St. Paul Street, Burlington, VT 05401
MLS# 5082816Listed by: COLDWELL BANKER HICKOK AND BOARDMAN $489,900Active4 beds 2 baths1,558 sq. ft.
35 South Union Street, Burlington, VT 05401
MLS# 5082825Listed by: HENEY REALTORS - ELEMENT REAL ESTATE (MONTPELIER) $2,195,000Active4 beds 5 baths4,625 sq. ft.
78 Crescent Road, Burlington, VT 05401
MLS# 5082828Listed by: COLDWELL BANKER HICKOK AND BOARDMAN $399,000Active1 beds 1 baths1,310 sq. ft.
161 St Paul Street, Burlington, VT 05401
MLS# 5082625Listed by: ELEMENT REAL ESTATE $399,000Active0.51 Acres
6 Alexis Drive, Burlington, VT 05408
MLS# 5082559Listed by: CENTURY 21 THE ONE $599,000Active4 beds 3 baths1,967 sq. ft.
5 Birchwood Lane, Burlington, VT 05408
MLS# 5082568Listed by: COLDWELL BANKER HICKOK AND BOARDMAN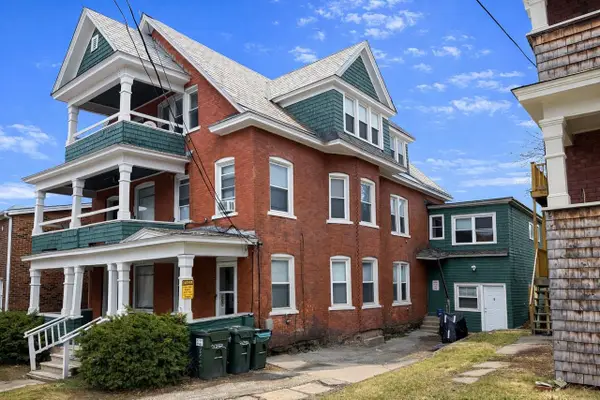 $1,325,000Active9 beds 6 baths4,773 sq. ft.
198-200 King Street, Burlington, VT 05401
MLS# 5082429Listed by: COLDWELL BANKER HICKOK AND BOARDMAN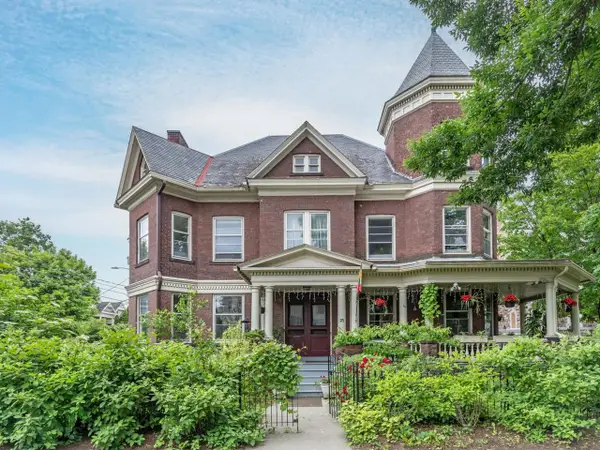 $1,595,000Active4 beds 3 baths3,450 sq. ft.
25 Buell Street, Burlington, VT 05401
MLS# 5082283Listed by: COLDWELL BANKER HICKOK AND BOARDMAN $2,475,000Active-- beds 16 baths8,736 sq. ft.
61 Elmwood Avenue, Burlington, VT 05401
MLS# 5082249Listed by: COLDWELL BANKER CARLSON REAL ESTATE $209,000Pending-- beds 2 baths1,764 sq. ft.
27 Archibald Street, Burlington, VT 05401
MLS# 5082165Listed by: VERMONT REAL ESTATE COMPANY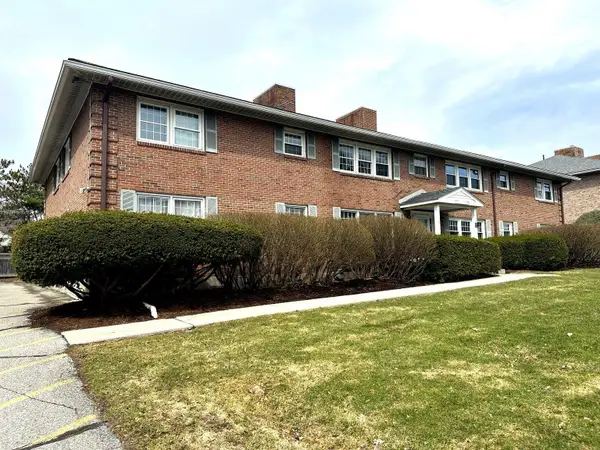 $325,000Active2 beds 1 baths912 sq. ft.
499 South Prospect Street, Burlington, VT 05401-3530
MLS# 5082133Listed by: BCK REAL ESTATE $1,975,000Active3 beds 3 baths4,382 sq. ft.
165 Crescent Road, Burlington, VT 05401
MLS# 5081583Listed by: COLDWELL BANKER HICKOK AND BOARDMAN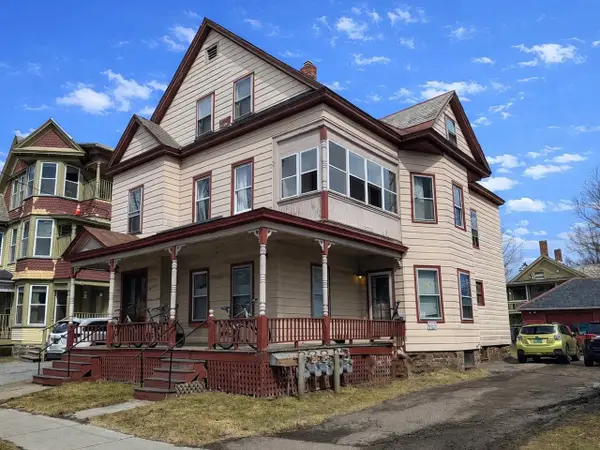 $850,000Active9 beds 4 baths2,484 sq. ft.
22-24 Converse Court, Burlington, VT 05401
MLS# 5082039Listed by: COLDWELL BANKER HICKOK AND BOARDMAN $698,000Pending2 beds 3 baths1,789 sq. ft.
36 Lake Forest Drive, Burlington, VT 05401
MLS# 5081956Listed by: FOUR SEASONS SOTHEBY'S INT'L REALTY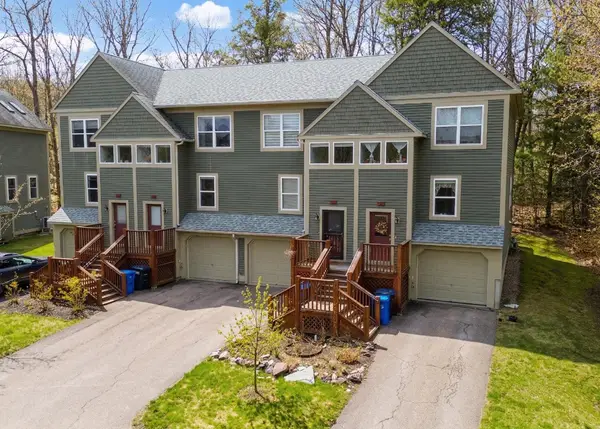 $489,900Active3 beds 1 baths1,899 sq. ft.
106 East Redrock Drive, Burlington, VT 05401
MLS# 5081914Listed by: NANCY JENKINS REAL ESTATE $326,000Pending3 beds 1 baths902 sq. ft.
37 South Williams Street #320, Burlington, VT 05401
MLS# 5081888Listed by: COLDWELL BANKER HICKOK AND BOARDMAN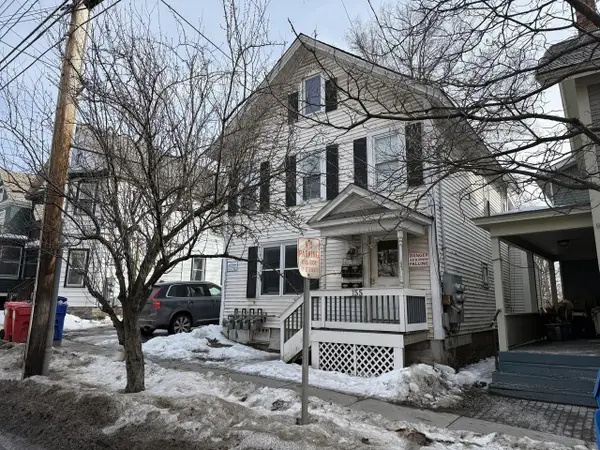 $730,000Active4 beds 4 baths2,132 sq. ft.
155 Maple Street, Burlington, VT 05401
MLS# 5081854Listed by: COLDWELL BANKER HICKOK AND BOARDMAN $479,000Active2 beds 2 baths1,252 sq. ft.
81 South Williams Street #403, Burlington, VT 05401
MLS# 5081793Listed by: ELEMENT REAL ESTATE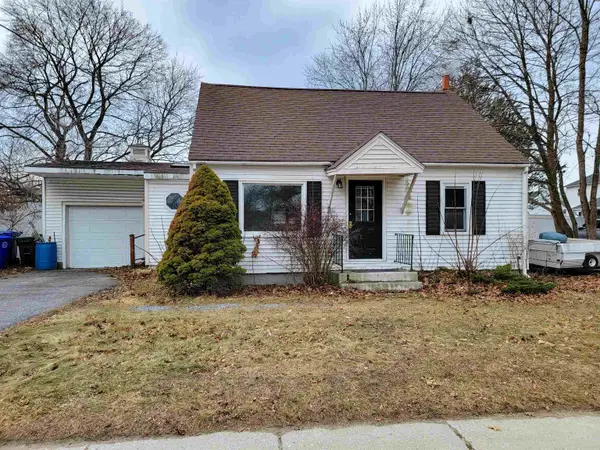 $325,000Active3 beds 2 baths1,702 sq. ft.
1813 North Avenue, Burlington, VT 05408
MLS# 5081773Listed by: PREFERRED PROPERTIES $789,000Pending4 beds 3 baths1,898 sq. ft.
4 University Road, Burlington, VT 05401
MLS# 5081578Listed by: REAL ESTATE ASSOCIATES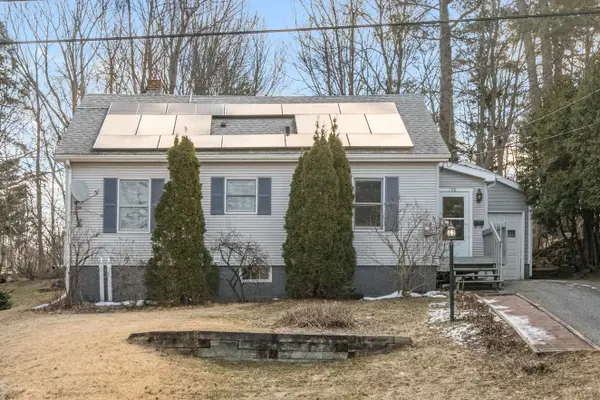 $549,900Active3 beds 1 baths1,508 sq. ft.
138 Foster Street, Burlington, VT 05401
MLS# 5081309Listed by: RIDGELINE REAL ESTATE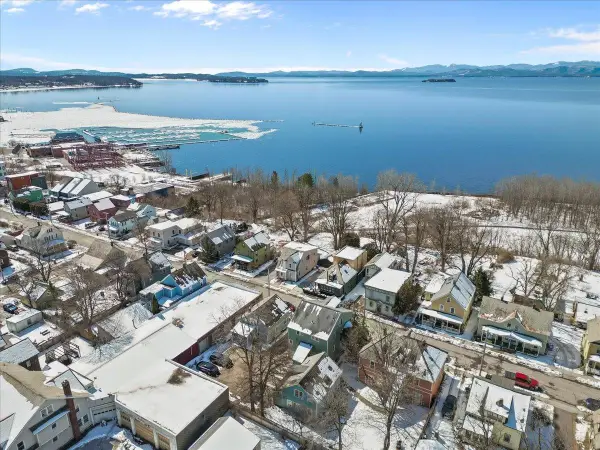 $317,500Active1 beds 1 baths553 sq. ft.
62 Lakeview Terrace #B, Burlington, VT 05401
MLS# 5081480Listed by: RE/MAX NORTH PROFESSIONALS - BURLINGTON $450,000Active1 beds 2 baths1,390 sq. ft.
89 College Street #Unit A-2, Burlington, VT 05401
MLS# 5081456Listed by: PURSUIT REAL ESTATE $219,000Active1 beds 1 baths688 sq. ft.
223 Hildred Drive, Burlington, VT 05401
MLS# 5081387Listed by: VERMONT REAL ESTATE COMPANY $595,000Active3 beds 2 baths1,706 sq. ft.
21 Cross Parkway, Burlington, VT 05408
MLS# 5081400Listed by: FLAT FEE REAL ESTATE $685,000Active4 beds 2 baths1,928 sq. ft.
579 South Willard Street, Burlington, VT 05401
MLS# 5080998Listed by: GERI REILLY REAL ESTATE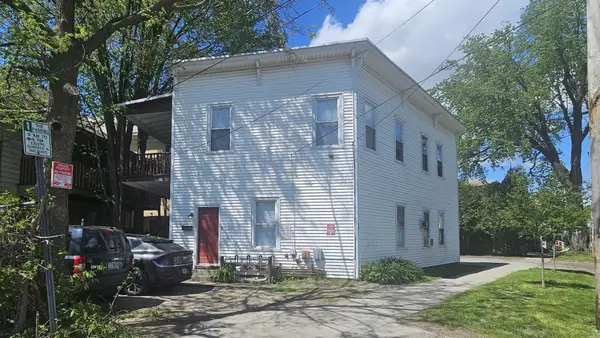 $799,000Active-- beds -- baths1,902 sq. ft.
25 Intervale Avenue, Burlington, VT 05401
MLS# 5081128Listed by: FLAT FEE REAL ESTATE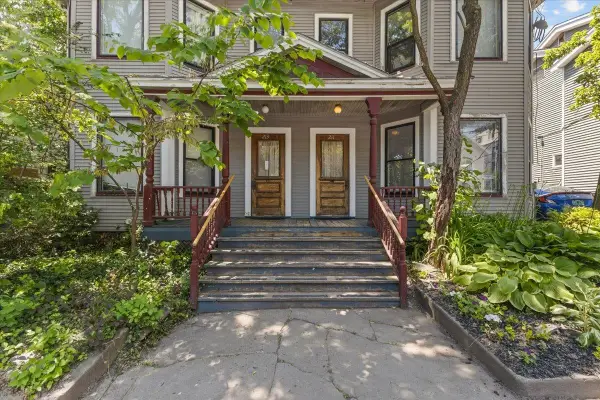 $939,000Active8 beds 4 baths3,680 sq. ft.
211-213 Saint Paul Street, Burlington, VT 05401
MLS# 5080980Listed by: FOUR SEASONS SOTHEBY'S INT'L REALTY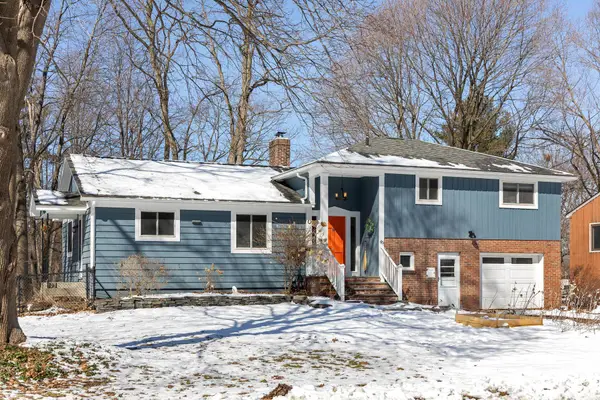 $755,000Pending4 beds 3 baths2,215 sq. ft.
45 Crescent Road, Burlington, VT 05401
MLS# 5080942Listed by: ELEMENT REAL ESTATE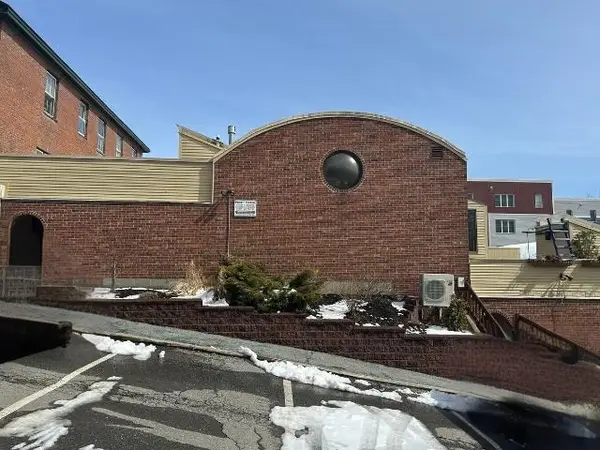 $369,000Active2 beds 1 baths1,750 sq. ft.
267 Pearl Street #A-2, Burlington, VT 05401
MLS# 5080886Listed by: STEINMETZ REALTY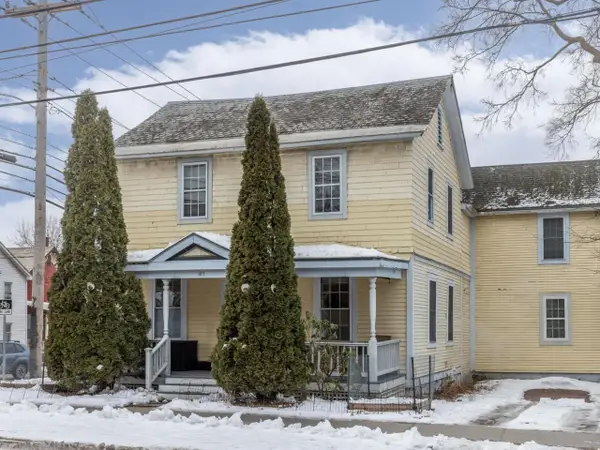 $330,000Pending2 beds 1 baths700 sq. ft.
103 Maple Street, Burlington, VT 05401
MLS# 5080815Listed by: COLDWELL BANKER HICKOK AND BOARDMAN $1,100,000Active3 beds 2 baths3,148 sq. ft.
308 College Street, Burlington, VT 05401
MLS# 5080820Listed by: GERI REILLY REAL ESTATE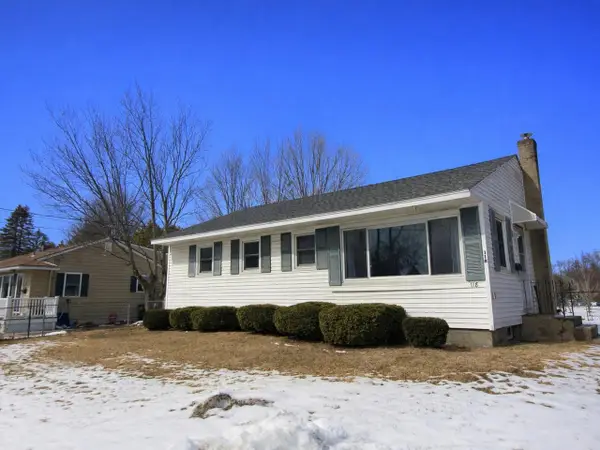 $348,600Pending2 beds 1 baths864 sq. ft.
118 Farrington Parkway, Burlington, VT 05408
MLS# 5080699Listed by: COLDWELL BANKER HICKOK AND BOARDMAN $949,000Active7 beds 5 baths3,036 sq. ft.
30-34 Greene Street, Burlington, VT 05401
MLS# 5080546Listed by: BHHS VERMONT REALTY GROUP/BURLINGTON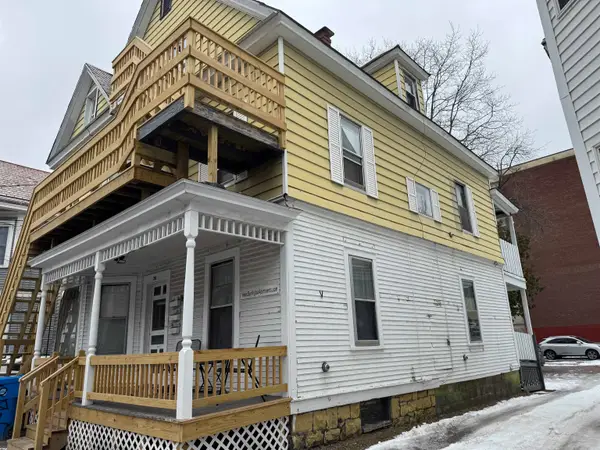 $699,000Active6 beds 3 baths2,188 sq. ft.
20 Greene Street, Burlington, VT 05401
MLS# 5080549Listed by: BHHS VERMONT REALTY GROUP/BURLINGTON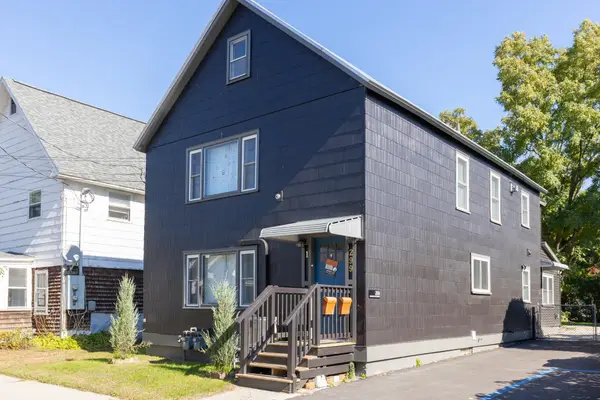 $675,000Active4 beds 2 baths2,410 sq. ft.
299 Manhattan Drive, Burlington, VT 05408
MLS# 5080551Listed by: FOUR SEASONS SOTHEBY'S INT'L REALTY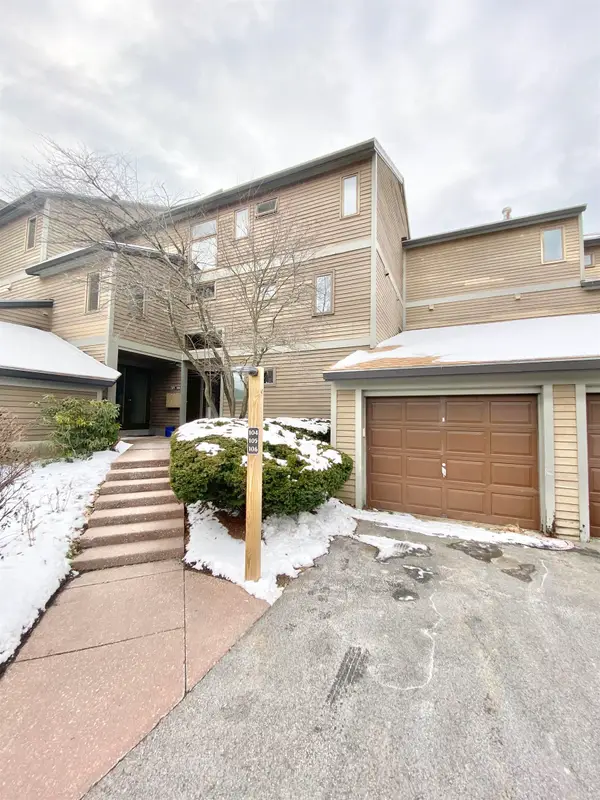 $399,000Pending2 beds 2 baths1,786 sq. ft.
54 East Redrock Drive #104, Burlington, VT 05401
MLS# 5080503Listed by: NORTHERN VERMONT REALTY GROUP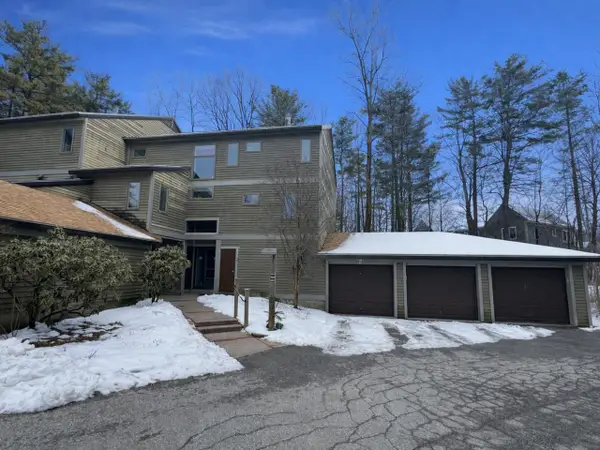 $335,000Active3 beds 3 baths1,936 sq. ft.
71 East Redrock Drive #103, Burlington, VT 05401
MLS# 5080474Listed by: COLDWELL BANKER HICKOK AND BOARDMAN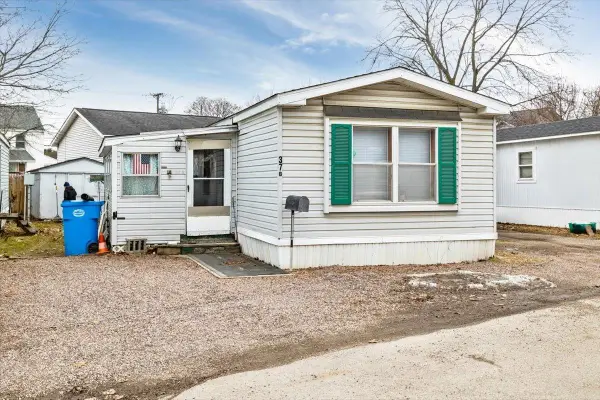 $119,000Active2 beds 1 baths1,064 sq. ft.
37 Avenue B, Burlington, VT 05408
MLS# 5080462Listed by: EXP REALTY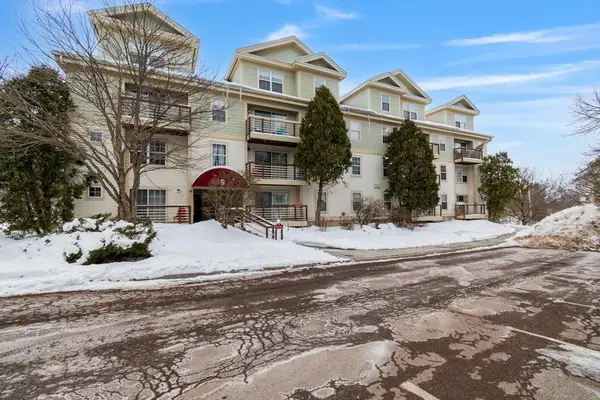 $323,500Active2 beds 1 baths1,000 sq. ft.
382 Hildred Drive, Burlington, VT 05401
MLS# 5080203Listed by: BLUE SLATE REALTY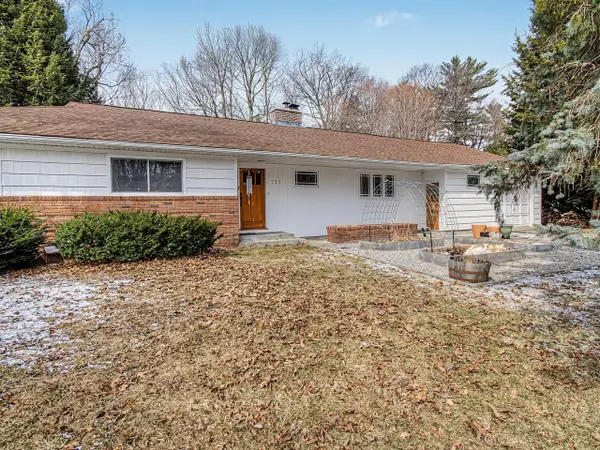 $799,000Pending4 beds 2 baths2,201 sq. ft.
777 South Prospect Street, Burlington, VT 05401
MLS# 5080104Listed by: COLDWELL BANKER HICKOK AND BOARDMAN $499,999Pending3 beds 1 baths1,316 sq. ft.
11 Poplar Street, Burlington, VT 05401
MLS# 5079895Listed by: COLDWELL BANKER HICKOK AND BOARDMAN $309,900Active2 beds 1 baths981 sq. ft.
433 1/2 Flynn Avenue, Burlington, VT 05401
MLS# 5079736Listed by: NANCY JENKINS REAL ESTATE $300,000Active1 beds 1 baths640 sq. ft.
297 College Street #4C, Burlington, VT 05401
MLS# 5079722Listed by: COLDWELL BANKER HICKOK AND BOARDMAN $275,000Active2 beds 2 baths1,088 sq. ft.
7 Ira Lane, Burlington, VT 05408
MLS# 5079654Listed by: NANCY JENKINS REAL ESTATE $399,000Pending3 beds 1 baths1,832 sq. ft.
50 Matthew Avenue, Burlington, VT 05408
MLS# 5079464Listed by: FLAT FEE REAL ESTATE $539,900Pending3 beds 3 baths1,504 sq. ft.
75 Cumberland Road, Burlington, VT 05408
MLS# 5078879Listed by: COLDWELL BANKER HICKOK AND BOARDMAN $300,000Active4 beds 2 baths2,028 sq. ft.
174-176 North Champlain Street, Burlington, VT 05401
MLS# 5078801Listed by: GERI REILLY REAL ESTATE $326,000Pending3 beds 1 baths884 sq. ft.
37 South Williams Street #313, Burlington, VT 05401
MLS# 5078660Listed by: COLDWELL BANKER HICKOK AND BOARDMAN $825,000Pending2 beds 2 baths1,379 sq. ft.
40 College Street #303, Burlington, VT 05401
MLS# 5078647Listed by: CENTURY 21 NORTH EAST $835,000Active7 beds 2 baths1,764 sq. ft.
44 Drew Street, Burlington, VT 05401
MLS# 5078652Listed by: COLDWELL BANKER HICKOK AND BOARDMAN $499,000Pending3 beds 1 baths1,344 sq. ft.
70 Dodds Court, Burlington, VT 05408
MLS# 5078300Listed by: ELEMENT REAL ESTATE $600,000Active6 beds 2 baths1,971 sq. ft.
187 North Champlain Street, Burlington, VT 05401
MLS# 5078488Listed by: COLDWELL BANKER HICKOK AND BOARDMAN $299,000Pending3 beds 1 baths1,128 sq. ft.
63 Fairmont Place, Burlington, VT 05408
MLS# 5078491Listed by: COLDWELL BANKER HICKOK AND BOARDMAN $1,180,000Active11 beds 5 baths3,575 sq. ft.
6-8 Chase Street, Burlington, VT 05401
MLS# 5078460Listed by: COLDWELL BANKER HICKOK AND BOARDMAN $399,900Pending2 beds 2 baths1,152 sq. ft.
8 Arthur Court, Burlington, VT 05401
MLS# 5078378Listed by: COLDWELL BANKER HICKOK AND BOARDMAN $319,900Active2 beds 1 baths873 sq. ft.
47 South Williams Street #111, Burlington, VT 05401
MLS# 5078293Listed by: COLDWELL BANKER HICKOK AND BOARDMAN $550,000Pending3 beds 1 baths1,228 sq. ft.
21 Clymer Street, Burlington, VT 05401
MLS# 5078290Listed by: COLDWELL BANKER HICKOK AND BOARDMAN $419,900Active5 beds 3 baths1,765 sq. ft.
446 Colchester Avenue, Burlington, VT 05401
MLS# 5078291Listed by: FLEX REALTY $795,000Active2 beds 2 baths1,456 sq. ft.
35 Cherry Street #302, Burlington, VT 05401
MLS# 5078077Listed by: LANDVEST, INC-BURLINGTON $489,000Pending2 beds 2 baths1,634 sq. ft.
91 Claire Pointe Road, Burlington, VT 05408
MLS# 5077997Listed by: COLDWELL BANKER HICKOK AND BOARDMAN $259,900Pending2 beds 1 baths1,000 sq. ft.
117 Hildred Drive, Burlington, VT 05401
MLS# 5077403Listed by: RE/MAX NORTH PROFESSIONALS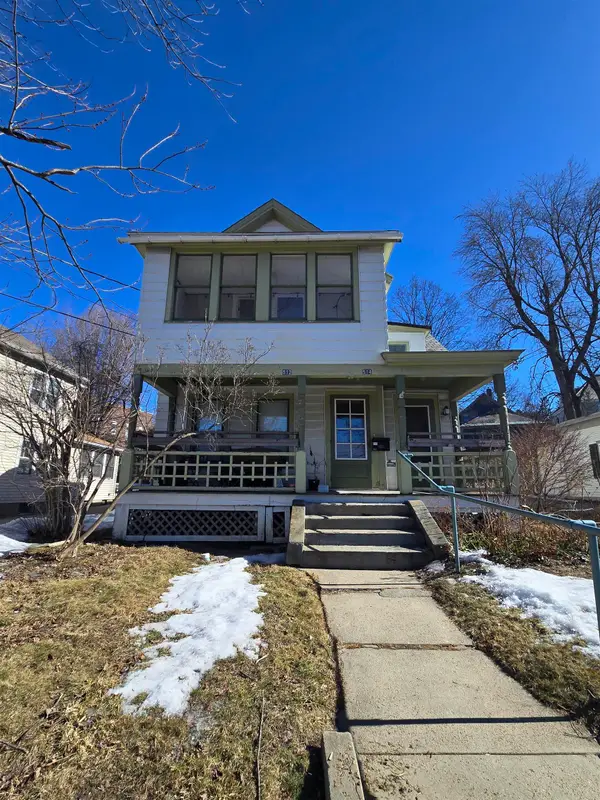 $659,000Active-- beds -- baths2,793 sq. ft.
512-514 Saint Paul Street, Burlington, VT 05401
MLS# 5077844Listed by: YELLOW SIGN COMMERCIAL INC.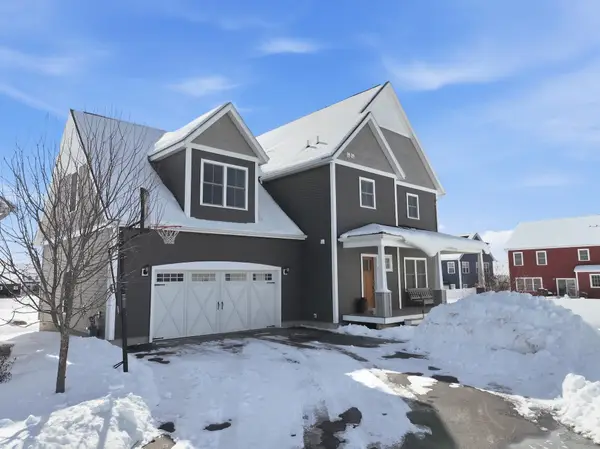 $735,000Pending3 beds 3 baths2,420 sq. ft.
35 Fall Street, South Burlington, VT 05403
MLS# 5077636Listed by: FOUR SEASONS SOTHEBY'S INT'L REALTY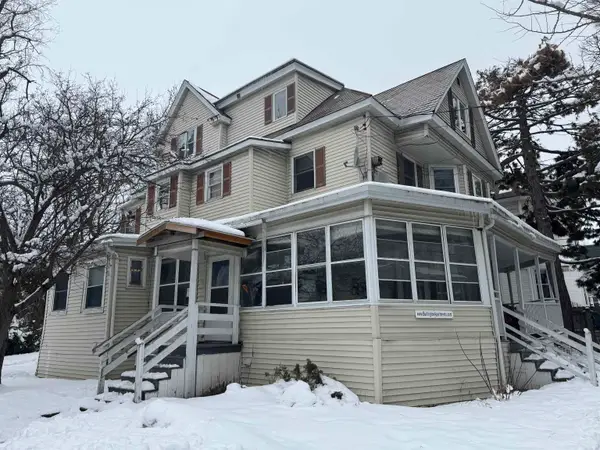 $749,000Active7 beds 3 baths2,849 sq. ft.
61 South Union Street, Burlington, VT 05401
MLS# 5077554Listed by: BHHS VERMONT REALTY GROUP/BURLINGTON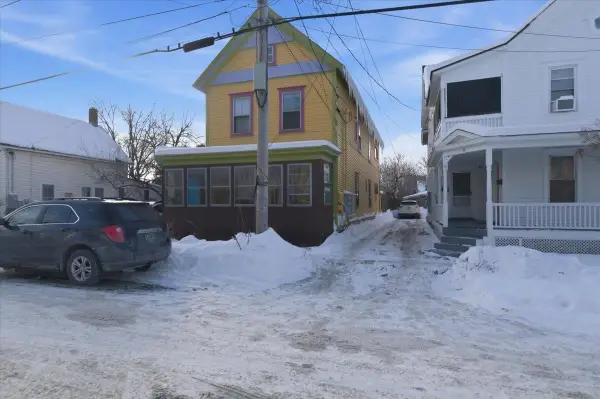 $489,000Active6 beds -- baths2,914 sq. ft.
27-29 Lafountain Street, Burlington, VT 05401
MLS# 5077455Listed by: FLEX REALTY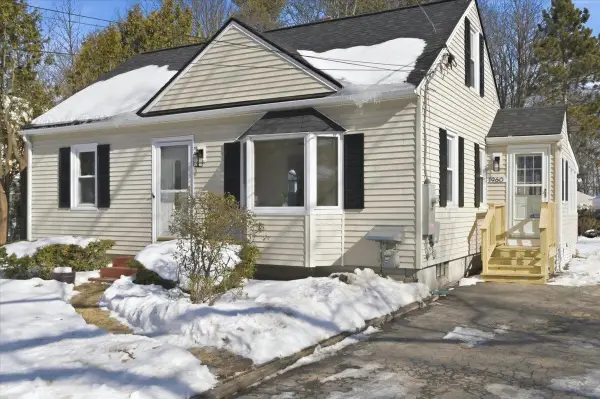 $469,000Pending4 beds 1 baths1,782 sq. ft.
1960 North Avenue, Burlington, VT 05408
MLS# 5078816Listed by: SIGNATURE PROPERTIES OF VERMONT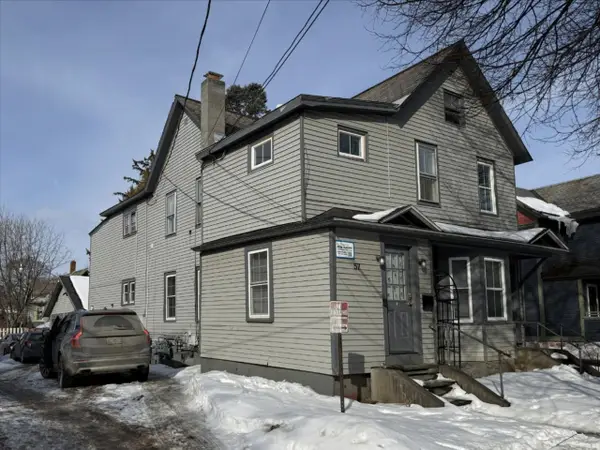 $1,025,000Pending7 beds 4 baths2,535 sq. ft.
55-57 North Willard Street, Burlington, VT 05401
MLS# 5077176Listed by: COLDWELL BANKER HICKOK AND BOARDMAN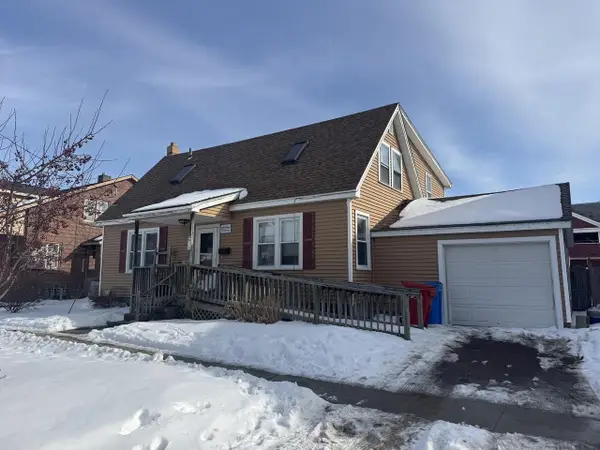 $575,000Pending4 beds 2 baths1,953 sq. ft.
36 Blodgett Street, Burlington, VT 05401
MLS# 5077103Listed by: COLDWELL BANKER HICKOK AND BOARDMAN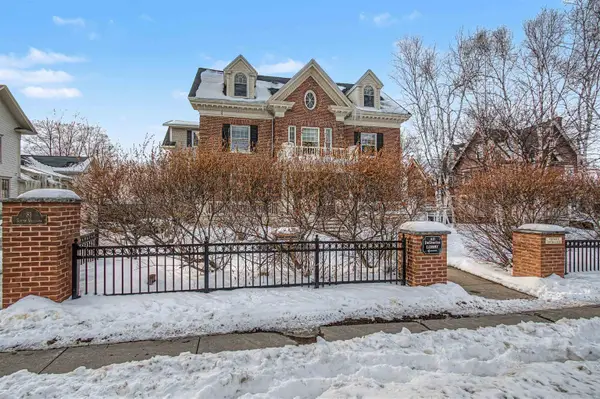 $369,900Active1 beds 1 baths744 sq. ft.
81 South Williams Street #303, Burlington, VT 05401
MLS# 5077124Listed by: POLLI PROPERTIES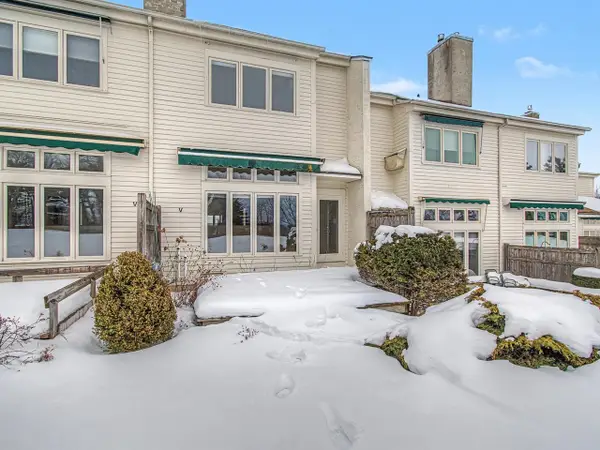 $679,000Active2 beds 3 baths1,802 sq. ft.
545 South Prospect Street #22, Burlington, VT 05401
MLS# 5076906Listed by: COLDWELL BANKER HICKOK AND BOARDMAN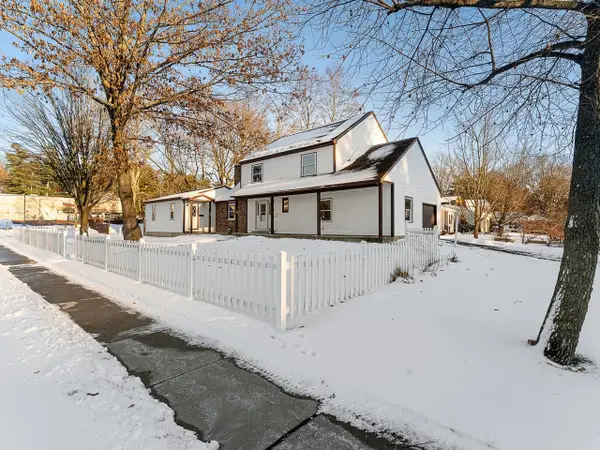 $695,000Active5 beds 4 baths2,967 sq. ft.
16 Lakewood Parkway, Burlington, VT 05408
MLS# 5076837Listed by: COLDWELL BANKER HICKOK AND BOARDMAN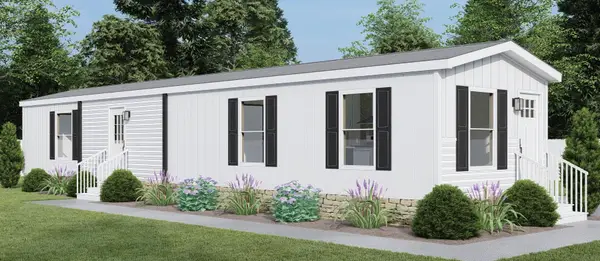 $101,041Active1 beds 1 baths670 sq. ft.
8 Avenue A #8 Ave A, Burlington, VT 05408
MLS# 5076339Listed by: EXP REALTY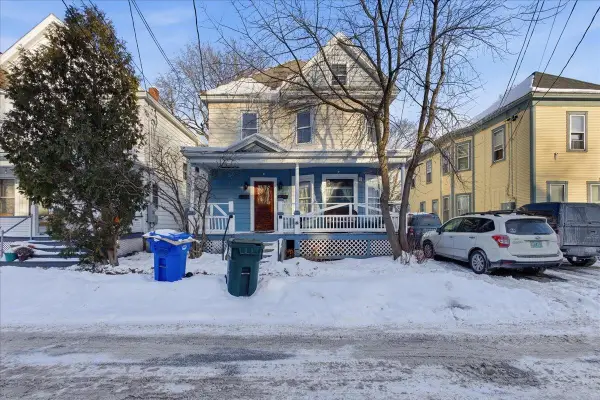 $774,900Active7 beds 3 baths2,619 sq. ft.
52 Isham Street, Burlington, VT 05401
MLS# 5076311Listed by: GERI REILLY REAL ESTATE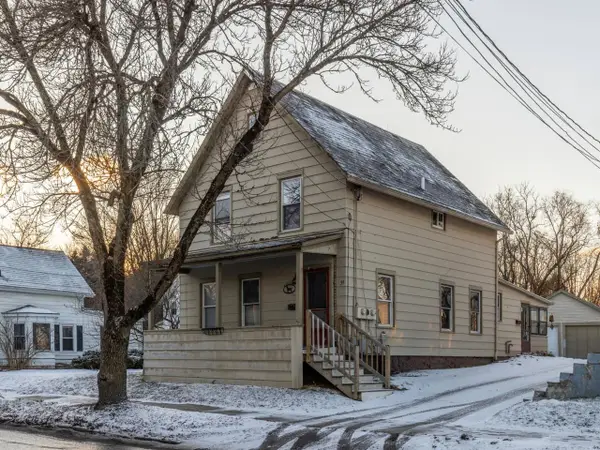 $465,000Pending3 beds 2 baths1,601 sq. ft.
39 Grove Street, Burlington, VT 05401
MLS# 5074972Listed by: COLDWELL BANKER HICKOK AND BOARDMAN $749,000Pending5 beds 4 baths3,457 sq. ft.
19 Woodlawn Road, Burlington, VT 05408
MLS# 5074651Listed by: VERMONT REAL ESTATE COMPANY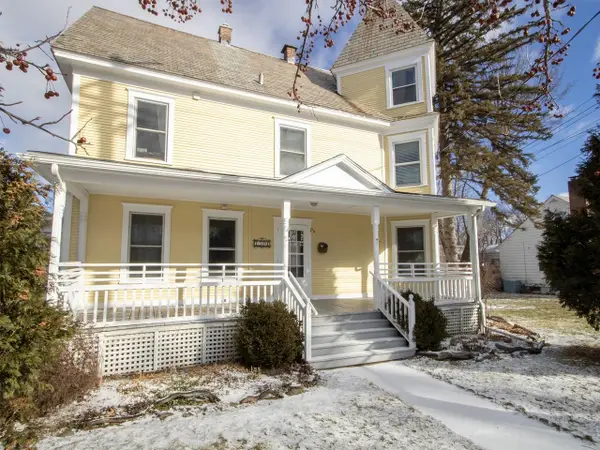 $340,000Active2 beds 2 baths1,278 sq. ft.
1304 North Avenue, Burlington, VT 05408
MLS# 5074587Listed by: COLDWELL BANKER HICKOK AND BOARDMAN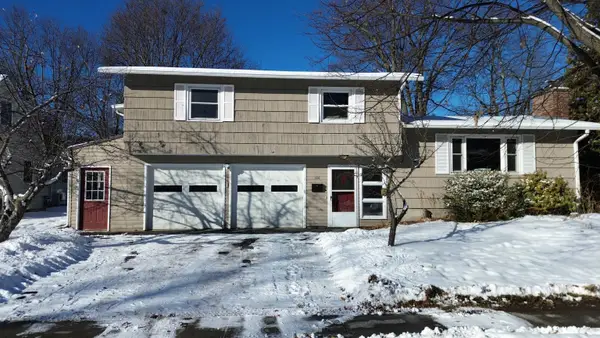 $749,999Active4 beds 3 baths2,464 sq. ft.
104 Lakewood Parkway, Burlington, VT 05408
MLS# 5073940Listed by: NANCY JENKINS REAL ESTATE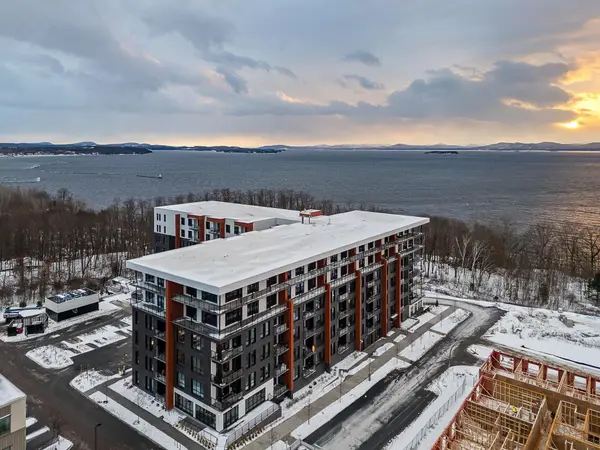 $958,000Active2 beds 2 baths1,295 sq. ft.
125 Cambrian Way #619, Burlington, VT 05401
MLS# 5073819Listed by: S.D. IRELAND PROPERTIES $760,000Active4 beds 3 baths2,604 sq. ft.
40 Prospect Parkway, Burlington, VT 05401
MLS# 5073766Listed by: WWW.HOMEZU.COM $435,000Pending3 beds 2 baths1,827 sq. ft.
68 Leonard Street, Burlington, VT 05408
MLS# 5073565Listed by: KW VERMONT $485,000Active4 beds 2 baths1,240 sq. ft.
406 Colchester Avenue, Burlington, VT 05401
MLS# 5073451Listed by: COLDWELL BANKER HICKOK AND BOARDMAN $265,000Active3 beds 1 baths1,404 sq. ft.
36 Vest Haven Drive, Burlington, VT 05408
MLS# 5073291Listed by: BHHS VERMONT REALTY GROUP/S BURLINGTON $369,900Active2 beds 2 baths960 sq. ft.
131 Main Street #302, Burlington, VT 05403
MLS# 5073276Listed by: FLAT FEE REAL ESTATE $825,000Active2 beds 2 baths1,148 sq. ft.
125 Cambrian Way #620, Burlington, VT 05401
MLS# 5073190Listed by: S.D. IRELAND PROPERTIES $975,000Active2 beds 2 baths1,323 sq. ft.
125 Cambrian Way #613, Burlington, VT 05401
MLS# 5073182Listed by: S.D. IRELAND PROPERTIES $675,000Active3 beds 3 baths1,499 sq. ft.
41 Adams Street, Burlington, VT 05401
MLS# 5071536Listed by: ELEMENT REAL ESTATE $375,000Pending5 beds 2 baths1,512 sq. ft.
1658 North Avenue, Burlington, VT 05408
MLS# 5071138Listed by: SIGNATURE PROPERTIES OF VERMONT $477,000Active1 beds 1 baths817 sq. ft.
125 Cambrian Way #602, Burlington, VT 05401
MLS# 5070744Listed by: S.D. IRELAND PROPERTIES $1,595,000Active3 beds 2 baths1,417 sq. ft.
125 Cambrian Way #607, Burlington, VT 05401
MLS# 5070748Listed by: S.D. IRELAND PROPERTIES $850,000Pending7 beds 6 baths3,224 sq. ft.
230 North Street, Burlington, VT 05401
MLS# 5070669Listed by: COLDWELL BANKER HICKOK AND BOARDMAN $517,500Pending4 beds 2 baths1,400 sq. ft.
410 Saint Paul Street, Burlington, VT 05401
MLS# 5069265Listed by: COLDWELL BANKER HICKOK AND BOARDMAN $515,000Active3 beds 1 baths1,380 sq. ft.
126 Foster Street, Burlington, VT 05401
MLS# 5068190Listed by: BHHS VERMONT REALTY GROUP/MORRISVILLE-STOWE $567,700Active1 beds 1 baths903 sq. ft.
125 Cambrian Way #606, Burlington, VT 05401
MLS# 5068113Listed by: S.D. IRELAND PROPERTIES $535,000Active2 beds 2 baths1,566 sq. ft.
545 South Prospect Street #21, Burlington, VT 05401
MLS# 5068120Listed by: COLDWELL BANKER HICKOK AND BOARDMAN $124,900Active2 beds 1 baths672 sq. ft.
37 Avenue C, Burlington, VT 05408
MLS# 5068090Listed by: KW VERMONT $435,000Active2 beds 2 baths1,057 sq. ft.
230 College Street #7, Burlington, VT 05401
MLS# 5067576Listed by: NANCY JENKINS REAL ESTATE $365,000Active2 beds 2 baths1,380 sq. ft.
117 Claire Pointe Road, Burlington, VT 05408
MLS# 5067370Listed by: PURSUIT REAL ESTATE $499,900Pending4 beds 2 baths1,504 sq. ft.
15 Blondin Circle, Burlington, VT 05408
MLS# 5067296Listed by: SIGNATURE PROPERTIES OF VERMONT $999,000Active4 beds 4 baths2,084 sq. ft.
476-478 Saint Paul Street, Burlington, VT 05401
MLS# 5067151Listed by: POLLI PROPERTIES $679,900Active3 beds 2 baths1,844 sq. ft.
125 Redrock Drive #201, Burlington, VT 05401
MLS# 5066193Listed by: KW VERMONT $274,900Pending3 beds 1 baths870 sq. ft.
285 Hildred Drive, Burlington, VT 05401
MLS# 5065369Listed by: COLDWELL BANKER HICKOK AND BOARDMAN $339,000Active1 beds 1 baths986 sq. ft.
20 Clarke Street #1, Burlington, VT 05401
MLS# 5064464Listed by: COLDWELL BANKER HICKOK AND BOARDMAN $799,000Pending4 beds 3 baths2,695 sq. ft.
42 Elmwood Avenue, Burlington, VT 05401
MLS# 5064262Listed by: KW VERMONT $2,500,000Active2.87 Acres
3181 North Avenue, Burlington, VT 05401
MLS# 5064074Listed by: YOUR JOURNEY REAL ESTATE $379,000Active2 beds 2 baths1,372 sq. ft.
105 Claire Pointe Road, Burlington, VT 05408
MLS# 5063604Listed by: COLDWELL BANKER HICKOK AND BOARDMAN $569,000Pending4 beds 1 baths1,400 sq. ft.
60 Hickok Place, Burlington, VT 05401
MLS# 5062434Listed by: ELEMENT REAL ESTATE $319,000Active4 beds 2 baths3,280 sq. ft.
46-48 North Avenue, Burlington, VT 05401-5219
MLS# 5062275Listed by: TRILLIONAIRE REALTY $619,000Pending5 beds 3 baths2,605 sq. ft.
44 Isham Street, Burlington, VT 05401
MLS# 5061782Listed by: BHHS VERMONT REALTY GROUP/BURLINGTON $470,000Active3 beds 2 baths1,899 sq. ft.
184 East Redrock Drive, Burlington, VT 05401
MLS# 5061785Listed by: COLDWELL BANKER HICKOK AND BOARDMAN $479,000Active4 beds 2 baths1,208 sq. ft.
63 Birch Court, Burlington, VT 05408
MLS# 5078817Listed by: SIGNATURE PROPERTIES OF VERMONT $499,000Pending3 beds 2 baths2,054 sq. ft.
183 Intervale Avenue, Burlington, VT 05401
MLS# 5061612Listed by: FLAT FEE REAL ESTATE $574,900Active3 beds 3 baths1,543 sq. ft.
206 Dale Road, Burlington, VT 05401
MLS# 5057399Listed by: SIGNATURE PROPERTIES OF VERMONT $574,900Active3 beds 3 baths1,543 sq. ft.
208 Dale Road, Burlington, VT 05401
MLS# 5057401Listed by: SIGNATURE PROPERTIES OF VERMONT $499,900Pending5 beds 3 baths2,473 sq. ft.
227 North Avenue, Burlington, VT 05401
MLS# 5053274Listed by: RE/MAX NORTH PROFESSIONALS $639,000Active3 beds 2 baths1,198 sq. ft.
19 Spruce Street, Burlington, VT 05401
MLS# 5052273Listed by: COLDWELL BANKER HICKOK AND BOARDMAN $1,395,000Active2 beds 2 baths1,612 sq. ft.
35 Cherry Street #Unit 404, Burlington, VT 05401
MLS# 5077993Listed by: FOUR SEASONS SOTHEBY'S INT'L REALTY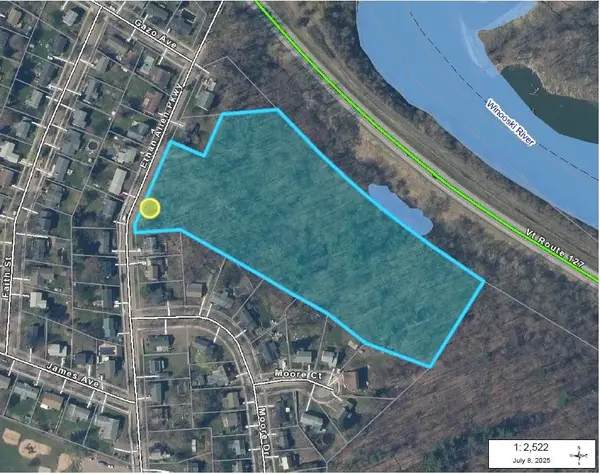 $399,900Active7.16 Acres
451 Ethan Allen Parkway, Burlington, VT 05408
MLS# 5050414Listed by: RE/MAX NORTH PROFESSIONALS - BURLINGTON $499,000Active4 beds 2 baths1,497 sq. ft.
37 Drew Street, Burlington, VT 05401
MLS# 5073215Listed by: COLDWELL BANKER HICKOK AND BOARDMAN $725,000Active5 beds 2 baths1,848 sq. ft.
94 Park Street, Burlington, VT 05401
MLS# 5046675Listed by: BHHS VERMONT REALTY GROUP/S BURLINGTON $1,120,000Active4 beds 3 baths3,336 sq. ft.
66 Dunder Road, Burlington, VT 05401
MLS# 5046427Listed by: COLDWELL BANKER HICKOK AND BOARDMAN $1,500,000Active2 beds 2 baths1,502 sq. ft.
125 Cambrian Way #605, Burlington, VT 05401
MLS# 5069129Listed by: S.D. IRELAND PROPERTIES $329,900Active1 beds 1 baths744 sq. ft.
131 Main Street #504, Burlington, VT 05401
MLS# 5078971Listed by: BRIAN FRENCH REAL ESTATE $675,000Pending6 beds 2 baths3,094 sq. ft.
103 Caroline Street, Burlington, VT 05401
MLS# 5031157Listed by: COLDWELL BANKER HICKOK AND BOARDMAN $1,124,000Pending8 beds 4 baths5,040 sq. ft.
197-203 North Winooski Avenue, Burlington, VT 05401
MLS# 5029628Listed by: KW VERMONT $259,000Active1 beds 1 baths447 sq. ft.
131 Main Street #509, Burlington, VT 05401
MLS# 5004108Listed by: BRIAN FRENCH REAL ESTATE $299,900Active2 beds 2 baths810 sq. ft.
131 Main Street #210, Burlington, VT 05401
MLS# 5032944Listed by: NANCY JENKINS REAL ESTATE
Local realty services provided by:CENTURY 21 Farm & Forest
Copyright 2026 Prime MLS, Inc. All rights reserved. This information is deemed reliable, but not guaranteed. The data relating to real estate displayed on this Site comes in part from the IDX Program of Prime MLS. The information being provided is for consumers’ personal, noncommercial use and may not be used for any purpose other than to identify prospective properties consumers may be interested in purchasing. Data last updated April 24, 2026
Neighborhoods near Burlington, VT
Zip codes near Burlington, VT
- 05401 homes for sale
- 05403 homes for sale
- 05404 homes for sale
- 05408 homes for sale
- 05445 homes for sale
- 05446 homes for sale
- 05452 homes for sale
- 05458 homes for sale
- 05461 homes for sale
- 05465 homes for sale
- 05468 homes for sale
- 05477 homes for sale
- 05482 homes for sale
- 05486 homes for sale
- 05494 homes for sale
- 05495 homes for sale
- 12903 homes for sale
- 12936 homes for sale
- 12944 homes for sale
- 12996 homes for sale
Popular searches near Burlington, VT
- Charlotte homes for sale
- Colchester homes for sale
- Essex homes for sale
- Essex Junction homes for sale
- Hinesburg homes for sale
- Jericho homes for sale
- Keeseville homes for sale
- Keeseville homes for sale
- Milton homes for sale
- Milton town homes for sale
- Shelburne town homes for sale
- Shelburne homes for sale
- South Burlington homes for sale
- South Hero homes for sale
- South Hero town homes for sale
- Williston homes for sale
- Willsboro homes for sale
- Willsboro town homes for sale
- Willsboro Point homes for sale
- Winooski homes for sale
Protect your home and budget from life's surprises with an Assurant Home Warranty, backed by a partner that supports you through every step of homeownership. Explore Plans.
©2026 Century 21 Real Estate LLC. All rights reserved. CENTURY 21®, the CENTURY 21 Logo and C21® are service marks owned by Century 21 Real Estate LLC. Century 21 Real Estate LLC fully supports the principles of the Fair Housing Act and the Equal Opportunity Act. Each office is independently owned and operated. Listing information is deemed reliable but not guaranteed accurate.