- Alford homes for sale
- Austerlitz homes for sale
- Canaan homes for sale
- Chatham town homes for sale
- Chatham homes for sale
- East Chatham homes for sale
- Ghent homes for sale
- Hancock homes for sale
- Lee homes for sale
- Lenox town homes for sale
- Lenox homes for sale
- Nassau town homes for sale
- New Lebanon homes for sale
- Niverville homes for sale
- Old Chatham homes for sale
- Pittsfield homes for sale
- Richmond homes for sale
- Stephentown homes for sale
- Stockbridge homes for sale
- West Stockbridge homes for sale
12029, NY - homes for sale
35 of 35 results displayed
 $795,000Pending4 beds 4 baths2,500 sq. ft.
91 Miller Road, Canaan, NY 12029
MLS# 20260630Listed by: COMPASS, HILLSDALE $595,000Pending3 beds 2 baths1,450 sq. ft.
95 Miller Road, Canaan, NY 12029
MLS# 20260632Listed by: COMPASS, HILLSDALE $445,000Active3 beds 1 baths1,008 sq. ft.
127 Queechy Shores, Canaan, NY 12029
MLS# 202611576Listed by: HOULIHAN LAWRENCE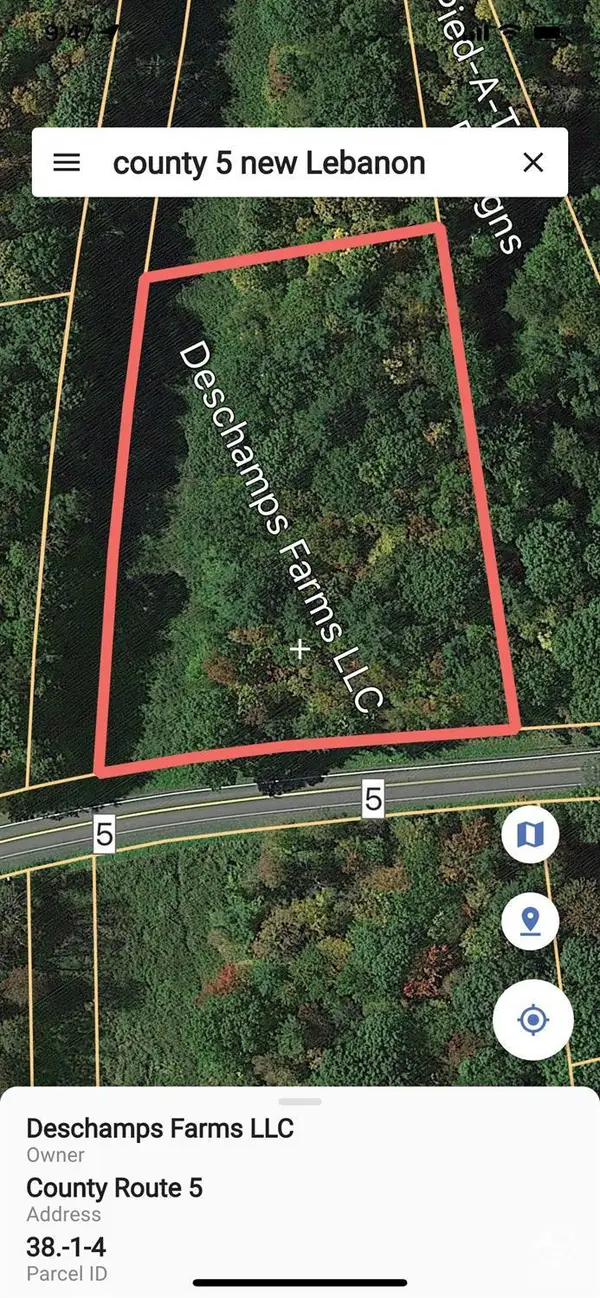 $45,000Active1.95 Acres
L4 County Route 5, Canaan, NY 12029
MLS# 20260075Listed by: BERKSHIRE HATHAWAY HOMESERVICE $925,000Active4 beds 3 baths2,100 sq. ft.
308 Shaker Ridge Drive, Canaan, NY 12029
MLS# 20260025Listed by: BERKSHIRE HATHAWAY HOMESERVICE $439,000Active3 beds 2 baths1,500 sq. ft.
13149 Ny-22 --, Canaan, NY 12029
MLS# 248425Listed by: WILLIAM PITT SOTHEBY'S - GT BARRINGTON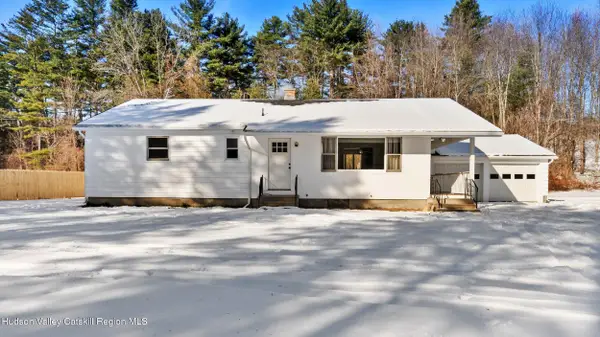 $439,000Active3 beds 2 baths1,500 sq. ft.
13149 New York 22, Canaan, NY 12029
MLS# 20256056Listed by: WILLIAM PITT SOTHEBYS INTN'L $1,450,000Active7 beds 6 baths7,316 sq. ft.
126 Shaker Ridge Dr, Canaan, NY 12029
MLS# 248230Listed by: HOULIHAN LAWRENCE, INC $399,000Active2 beds 2 baths1,200 sq. ft.
92 Cunningham Hill Road, Canaan, NY 12029
MLS# 20255599Listed by: GABEL REAL ESTATE $795,000Pending2 beds 1 baths9,405 sq. ft.
165 Queechy Lake Road, Canaan, NY 12029
MLS# 20255478Listed by: CORCORAN COUNTRY LIVING $214,000Active12.5 Acres
O Mercer Mountain Road, Canaan, NY 12029
MLS# 20254788Listed by: STONE HOUSE PROPERTIES, LLC $695,000Active3 beds 3 baths2,920 sq. ft.
3124-3100 County Route 9 --, Canaan, NY 12029
MLS# 247856Listed by: PREFERRED COUNTRY PROPERTIES $695,000Active3 beds 3 baths2,920 sq. ft.
3124-3100 County Route 9, Canaan, NY 12029
MLS# 202526629Listed by: PREFERRED COUNTRY PROPERTIES $695,000Active3 beds 3 baths2,920 sq. ft.
3124-3100 County Route 9, Canaan, NY 12029
MLS# 20254594Listed by: PREFERRED COUNTRY PROPERTIES $579,000Active3 beds 2 baths2,300 sq. ft.
1476 County Route 5, Canaan, NY 12029
MLS# 20254585Listed by: HOULIHAN LAWRENCE INC.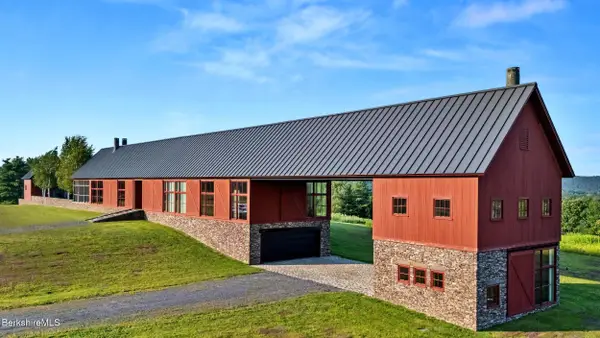 $12,500,000Active4 beds 6 baths6,829 sq. ft.
241 Cunningham Hill Rd, Canaan, NY 12029
MLS# 247484Listed by: WILLIAM PITT SOTHEBY'S - GT BARRINGTON $89,000Active20 Acres
0 Flints Crossing Road, Canaan, NY 12029
MLS# 20253768Listed by: BARNS & FARMS REALTY, LLC $89,000Active5 Acres
155 Shaver, Canaan, NY 12029
MLS# 20253762Listed by: BARNS & FARMS REALTY, LLC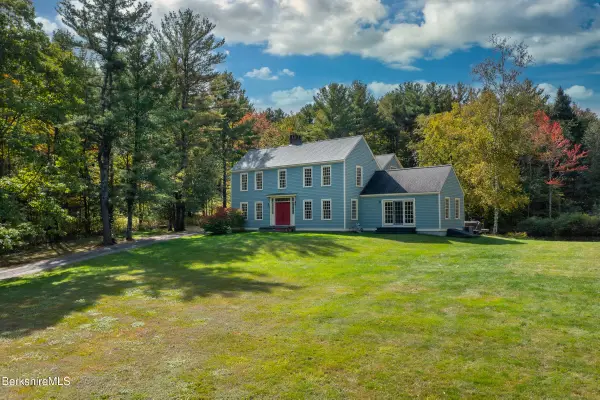 $841,500Pending3 beds 4 baths3,204 sq. ft.
2205 County Route 5 --, Canaan, NY 12029
MLS# 247338Listed by: WILLIAM PITT SOTHEBY'S - GT BARRINGTON $279,000Active17.05 Acres
13191 Route 22 Stop #80, Canaan, NY 12029
MLS# 247320Listed by: WILLIAM PITT SOTHEBY'S - GT BARRINGTON $869,000Active3 beds 3 baths4,377 sq. ft.
1977 State Route 295, Canaan, NY 12029
MLS# 20253384Listed by: COUNTRY LIFE REAL ESTATE, LLC $695,000Active2 beds 2 baths2,366 sq. ft.
156 Mercer Mountain Road, Canaan, NY 12029
MLS# 20253241Listed by: COZZOLINO REAL ESTATE INC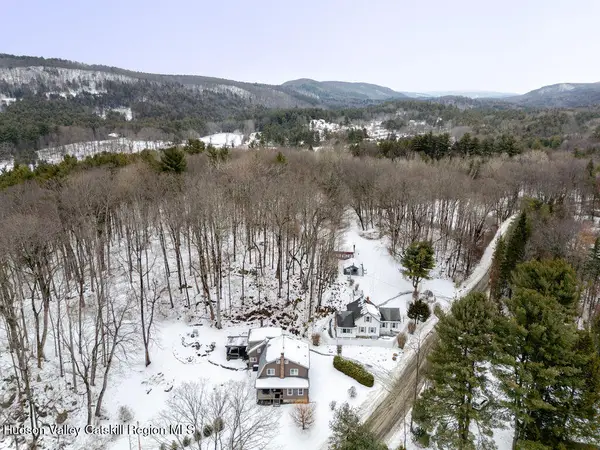 $1,275,000Pending7 beds 6 baths3,896 sq. ft.
91 And 95 Miller Road, Canaan, NY 12029
MLS# 20260628Listed by: COMPASS, HILLSDALE $399,000Pending3 beds 3 baths2,260 sq. ft.
33 Dermody Road, Canaan, NY 12029
MLS# 20252179Listed by: GILCREST PROPERTIES $1,880,000Active4 beds 1 baths1,443 sq. ft.
105 Norton Rd, Canaan, NY 12029
MLS# 246644Listed by: STONE HOUSE PROPERTIES, LLC $465,000Active60.13 Acres
0 County Rte 5 & I90, Canaan, NY 12029
MLS# 20251524Listed by: KW PLATFORM $1,880,000Active367 Acres
105 Norton Road, Canaan, NY 12037
MLS# 153457Listed by: STONE HOUSE PROPERTIES, LLC $99,500Pending11.4 Acres
0 Old Ghost Road, Canaan, NY 12029
MLS# 154524Listed by: THE KINDERHOOK GROUP, INC. $369,000Active5 beds 2 baths1,876 sq. ft.
4283 Ccrt 9 Ext, New Lebanon, NY 12125
MLS# 246363Listed by: BERKSHIRE HATHAWAY HOME SERVICE BLAKE $1,900,000Active9 beds 8 baths6,967 sq. ft.
Tbd Ny-22, Canaan, NY 12029
MLS# 20251072Listed by: CORCORAN COUNTRY LIVING $575,000Active5 beds 2 baths3,200 sq. ft.
105 Mcnamee Road, Canaan, NY 12029
MLS# 202610553Listed by: HOWARD HANNA CAPITAL INC $495,000Active3 beds 2 baths1,404 sq. ft.
263 Old Hudson Turnpike Turnpike, Canaan, NY 12029
MLS# 202530207Listed by: BERKSHIRE HATHAWAY HOME SERVICES BLAKE $1,450,000Active7 beds 6 baths6,005 sq. ft.
126 Shaker Ridge Drive, Canaan, NY 12029
MLS# 202529436Listed by: HOULIHAN LAWRENCE $99,500Pending11.4 Acres
L67 Old Ghost Road #Lot 6, New Lebanon, NY 12125
MLS# 202425654Listed by: THE KINDERHOOK GROUP, INC. $45,000Active1.95 Acres
L4 County Rte 5, Canaan, NY 12029
MLS# 202610256Listed by: BERKSHIRE HATHAWAY HOME SERVICES BLAKE
Local realty services provided by:CENTURY 21 Stoeckeler Real Estate, CENTURY 21 North East
Popular searches near 12029
Popular neighborhoods near 12029
- Arbor Hill, Albany homes for sale
- Bishop's Gate, Albany homes for sale
- Center Square, Albany homes for sale
- Delaware, Albany homes for sale
- Eastside, Troy homes for sale
- Elsmere, Glenmont homes for sale
- Glenmont, Glenmont homes for sale
- Helderberg, Albany homes for sale
- Hudson Park, Albany homes for sale
- Mansion, Albany homes for sale
- North Albany, Albany homes for sale
- Park South, Albany homes for sale
- Second Avenue, Albany homes for sale
- Sheridan Hollow, Albany homes for sale
- South End, Albany homes for sale
- South Troy, Troy homes for sale
- Ten Broeck Triangle, Albany homes for sale
- Washington Square, Albany homes for sale
- West Hill, Albany homes for sale
- Whitehall, Albany homes for sale
Counties near Canaan, 12029
- Albany County homes for sale
- Bennington County homes for sale
- Berkshire County homes for sale
- Capitol County homes for sale
- Columbia County homes for sale
- Dutchess County homes for sale
- Franklin County homes for sale
- Greene County homes for sale
- Hampden County homes for sale
- Hampshire County homes for sale
- Hartford County homes for sale
- Litchfield County homes for sale
- Montgomery County homes for sale
- Northwest Hills County homes for sale
- Rensselaer County homes for sale
- Saratoga County homes for sale
- Schenectady County homes for sale
- Schoharie County homes for sale
- Ulster County homes for sale
- Windham County homes for sale
Protect your home and budget from life's surprises with an Assurant Home Warranty, backed by a partner that supports you through every step of homeownership. Explore Plans.
©2026 Century 21 Real Estate LLC. All rights reserved. CENTURY 21®, the CENTURY 21 Logo and C21® are service marks owned by Century 21 Real Estate LLC. Century 21 Real Estate LLC fully supports the principles of the Fair Housing Act and the Equal Opportunity Act. Each office is independently owned and operated. Listing information is deemed reliable but not guaranteed accurate.