- Bowling Green, Fort Myers homes for sale
- Burnt Shore Marina, Burnt Store Marina homes for sale
- Cape Harbour, Cape Coral homes for sale
- Cross Creek Golf & Country Club, Fort Myers homes for sale
- Crown Colony, Fort Myers homes for sale
- Eagle Ridge, Fort Myers homes for sale
- Edison Park, Fort Myers homes for sale
- Gulf Harbour Yacht & Country Club, Fort Myers homes for sale
- Hamlet, Fort Myers homes for sale
- Heritage Palms, Fort Myers homes for sale
- Kelly Greens Golf & Country Club, Fort Myers homes for sale
- Lexington Country Club, Fort Myers homes for sale
- Lincoln Park, Fort Myers homes for sale
- Pelican Sound Golf & River Club, Estero homes for sale
- Poinciana Park, Fort Myers homes for sale
- Sanctuary at Wulfert Point, Sanibel homes for sale
- The Forest, Fort Myers homes for sale
- Valencia Terrace, Fort Myers homes for sale
- Villa Capri, Fort Myers homes for sale
- West Bay Club, Estero homes for sale
Captiva, FL - homes for sale
90 of 90 results displayed
 $3,575,000Active5 beds 7 baths5,000 sq. ft.
218 Useppa Island, Useppa Island, FL 33924
MLS# 2026007837Listed by: UIP PROPERTY COMPANY LLC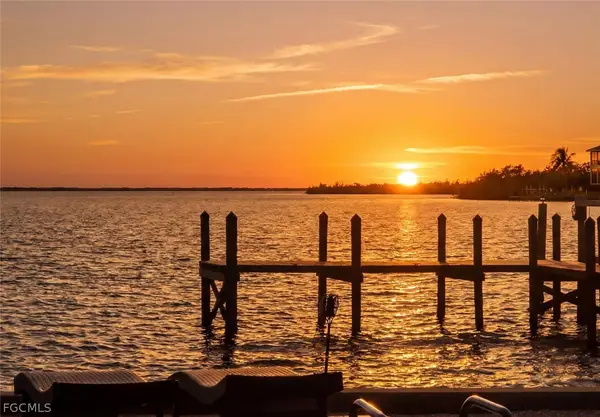 $5,000,000Active3 beds 3 baths2,414 sq. ft.
15153 Captiva Drive, Captiva, FL 33924
MLS# 2026010812Listed by: PREMIER SOTHEBY'S INT'L REALTY $1,500,000Active3 beds 2 baths1,034 sq. ft.
2030 Gulf Beach Villas, Captiva, FL 33924
MLS# 2026009229Listed by: ROYAL SHELL REAL ESTATE, INC. $1,900,000Active2 beds 2 baths1,203 sq. ft.
2122 Gulf Beach Villas, Captiva, FL 33924
MLS# 2026006103Listed by: JOHN R. WOOD PROPERTIES $295,000Active1 beds 2 baths684 sq. ft.
4122 Bayside Villas, Captiva, FL 33924
MLS# 2026010320Listed by: JOHN R. WOOD PROPERTIES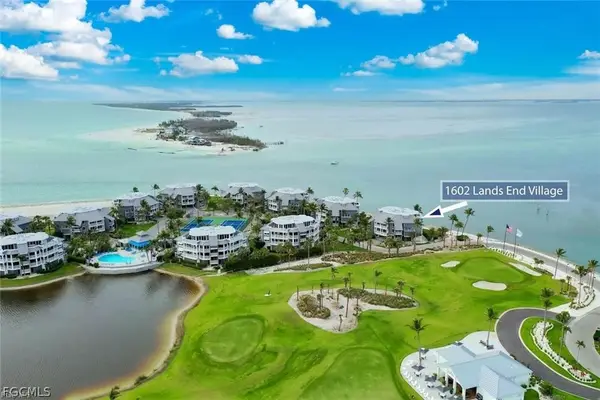 $2,494,000Active3 beds 3 baths2,444 sq. ft.
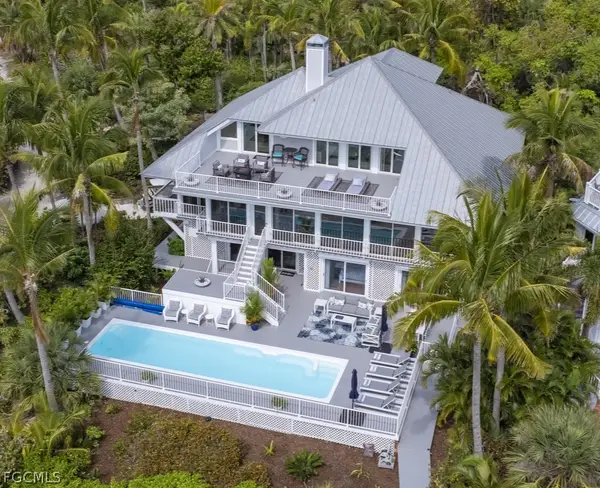
1602 Lands End Village, Captiva, FL 33924
MLS# 2026009643Listed by: KINGFISHER REAL ESTATE, INC.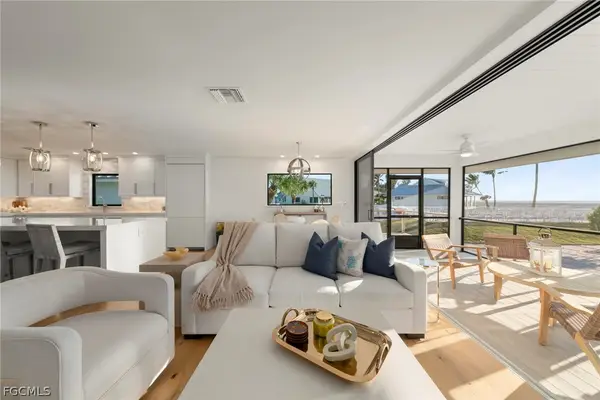 $3,495,000Active4 beds 4 baths1,618 sq. ft.
25 Beach Homes, Captiva, FL 33924
MLS# 2026007634Listed by: JOHN R. WOOD PROPERTIES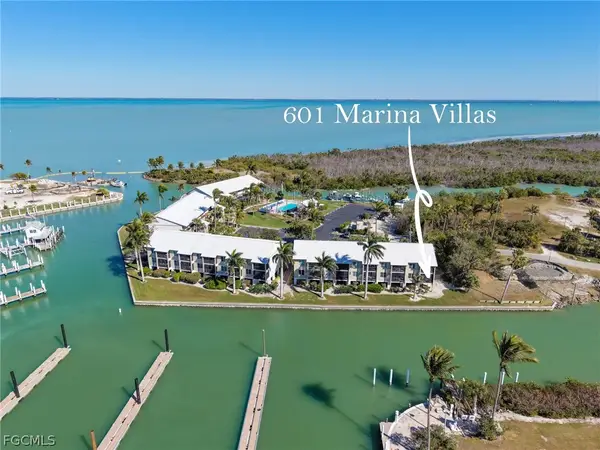 $699,000Pending2 beds 2 baths861 sq. ft.
601 Marina Villas, Captiva, FL 33924
MLS# 2026007264Listed by: JOHN R. WOOD PROPERTIES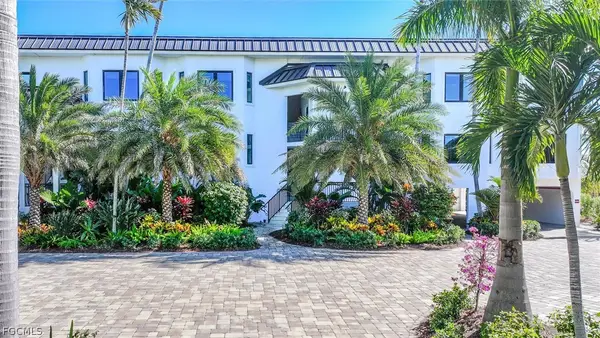 $3,575,000Active3 beds 4 baths2,606 sq. ft.
15067 Captiva Drive #2, Captiva, FL 33924
MLS# 2026009398Listed by: ROYAL SHELL REAL ESTATE, INC.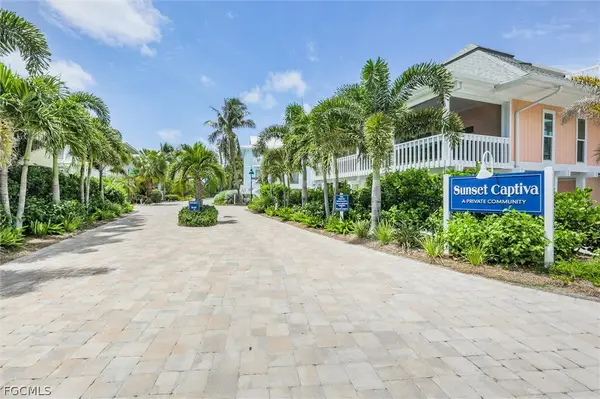 $1,600,000Pending2 beds 2 baths1,655 sq. ft.
38 Sea Hibiscus Court, Captiva, FL 33924
MLS# 2026009215Listed by: ROYAL SHELL REAL ESTATE, INC. $6,250,000Active3 beds 4 baths2,200 sq. ft.
11551 Wightman Lane, Captiva, FL 33924
MLS# 2026008158Listed by: ROYAL SHELL REAL ESTATE, INC. $6,900,000Active6 beds 7 baths4,900 sq. ft.
16611 Captiva Drive, Captiva, FL 33924
MLS# 2026008164Listed by: ROYAL SHELL REAL ESTATE, INC. $285,000Active0 Acres
Boat Slip #3, Upper Captiva, FL 33924
MLS# 2026006617Listed by: RESORT PROPERTIES INTERNATIONA $275,000Active0 Acres
Boat Slip #2, Upper Captiva, FL 33924
MLS# 225049832Listed by: RESORT PROPERTIES INTERNATIONA $18,900,000Active6 beds 7 baths8,596 sq. ft.
16950 Captiva Drive, Captiva, FL 33924
MLS# 2026006271Listed by: PREMIER SOTHEBY'S INT'L REALTY $1,795,000Active2 beds 2 baths1,397 sq. ft.
1641 Lands End Village, Captiva, FL 33924
MLS# 2026002162Listed by: KINGFISHER REAL ESTATE, INC. $5,500,000Active1.07 Acres
16970 Captiva Drive, Captiva, FL 33924
MLS# 2026003811Listed by: COMPASS FLORIDA LLC $1,250,000Pending2 beds 2 baths1,652 sq. ft.
1655 Lands End Village, Captiva, FL 33924
MLS# 2026002157Listed by: PFEIFER REALTY GROUP LLC $2,995,000Active3 beds 3 baths2,038 sq. ft.
6 Beach Homes, Captiva, FL 33924
MLS# 2026002502Listed by: KINGFISHER REAL ESTATE, INC. $549,000Active1 beds 2 baths684 sq. ft.
5122 Bayside Villas, Captiva, FL 33924
MLS# 2026002394Listed by: TIMBERS FL REAL ESTATE COMPANY $3,495,000Active2 beds 3 baths1,680 sq. ft.
1 Sunset Captiva Lane, Captiva, FL 33924
MLS# 2026002023Listed by: ROYAL SHELL REAL ESTATE, INC. $1,249,000Active3 beds 3 baths1,500 sq. ft.
2121 Gulf Beach Villas, Captiva, FL 33924
MLS# 2026000907Listed by: JOHN R. WOOD PROPERTIES $2,150,000Active3 beds 3 baths1,521 sq. ft.
11506 Wightman Lane, Captiva, FL 33924
MLS# 2025024676Listed by: BERKSHIRE HATHAWAY FLORIDA $1,850,000Active2 beds 2 baths1,344 sq. ft.
11510 Murmond Lane, Captiva, FL 33924
MLS# 2025024701Listed by: BERKSHIRE HATHAWAY FLORIDA $489,000Active1 beds 2 baths684 sq. ft.
4112 Bayside Villas #4112, Captiva, FL 33924
MLS# 2025024921Listed by: KELLER WILLIAMS REALTY FORT MYERS $489,000Active1 beds 2 baths684 sq. ft.
4216 Bayside Villas, Captiva, FL 33924
MLS# 2025024926Listed by: KELLER WILLIAMS REALTY FORT MYERS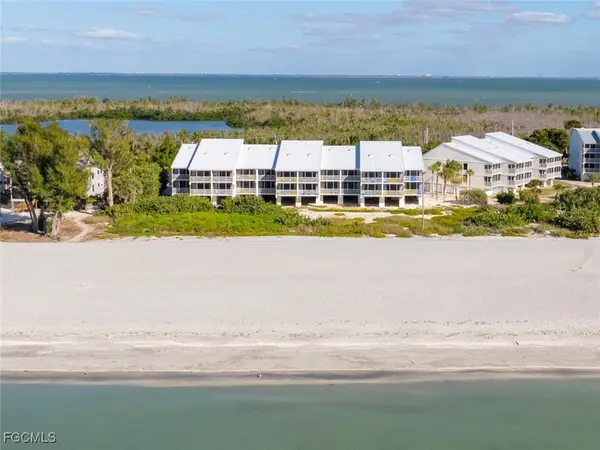 $1,050,000Active2 beds 2 baths1,043 sq. ft.
2004 Gulf Beach Villas, Captiva, FL 33924
MLS# 2025026121Listed by: MICHAEL SAUNDERS & COMPANY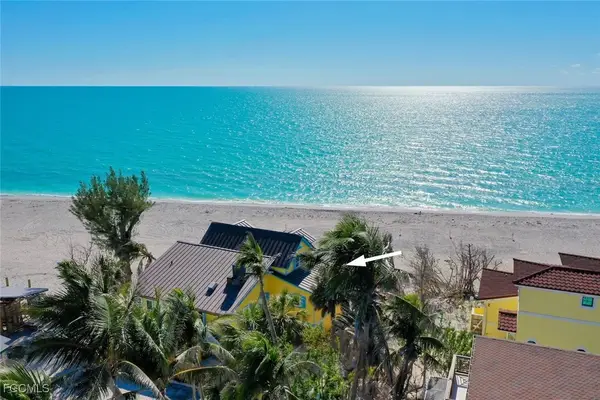 $3,500,000Active3 beds 3 baths1,844 sq. ft.
11555 Wightman Lane, Captiva, FL 33924
MLS# 2025026412Listed by: JOHN R. WOOD PROPERTIES $2,750,000Active3 beds 3 baths2,530 sq. ft.
16813 Captiva Drive, Captiva, FL 33924
MLS# 2025026419Listed by: JOHN R. WOOD PROPERTIES $4,749,000Active6 beds 7 baths4,857 sq. ft.
15160 Captiva Drive, Captiva, FL 33924
MLS# 2025024133Listed by: JOHN R. WOOD PROPERTIES $1,125,000Active2 beds 2 baths1,043 sq. ft.
2315 Beach Villas, Captiva, FL 33924
MLS# 225083701Listed by: DOMAINREALTY.COM LLC $1,595,000Active2 beds 2 baths960 sq. ft.
1403 Beach Cottages, Captiva, FL 33924
MLS# 2025024577Listed by: ROYAL SHELL REAL ESTATE, INC. $649,000Active1 beds 2 baths906 sq. ft.
3132 Tennis Villas, Captiva, FL 33924
MLS# 2025020197Listed by: JOHN R. WOOD PROPERTIES $3,750,000Active5 beds 7 baths5,287 sq. ft.
218 Useppa Island, Useppa Island, FL 33924
MLS# 2025023738Listed by: HOME SOLD REALTY LLC $309,000Active1 beds 1 baths580 sq. ft.
3224 Tennis Villas, Captiva, FL 33924
MLS# 2025021070Listed by: ROYAL SHELL REAL ESTATE, INC. $9,450,000Active3 beds 4 baths3,152 sq. ft.
941 South Seas Plantation Road, Captiva, FL 33924
MLS# 2025020264Listed by: ROYAL SHELL REAL ESTATE, INC. $4,250,000Active6 beds 5 baths4,861 sq. ft.
16309 Captiva Drive, Captiva, FL 33924
MLS# 2025020755Listed by: PREMIER SOTHEBY'S INT'L REALTY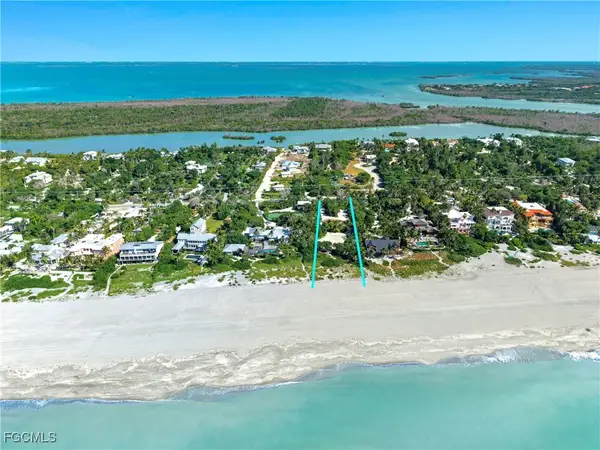 $6,500,000Active1.06 Acres
16548 Captiva Drive, Captiva, FL 33924
MLS# 2025013467Listed by: ROYAL SHELL REAL ESTATE, INC.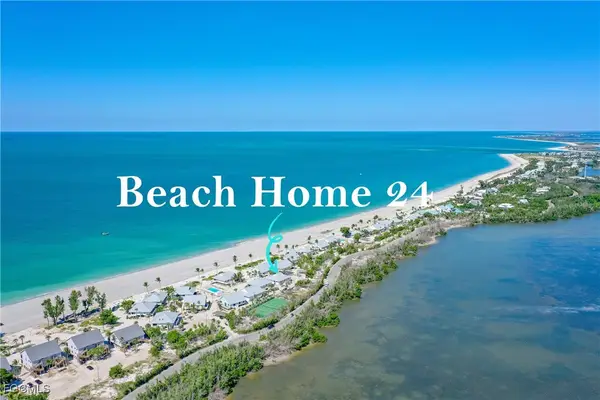 $4,850,000Active4 beds 5 baths2,392 sq. ft.
24 Beach Homes, Captiva, FL 33924
MLS# 2025017647Listed by: JOHN R. WOOD PROPERTIES $544,900Active1 beds 2 baths684 sq. ft.
5232 Bayside Villas, Captiva, FL 33924
MLS# 2025017415Listed by: JOHN R. WOOD PROPERTIES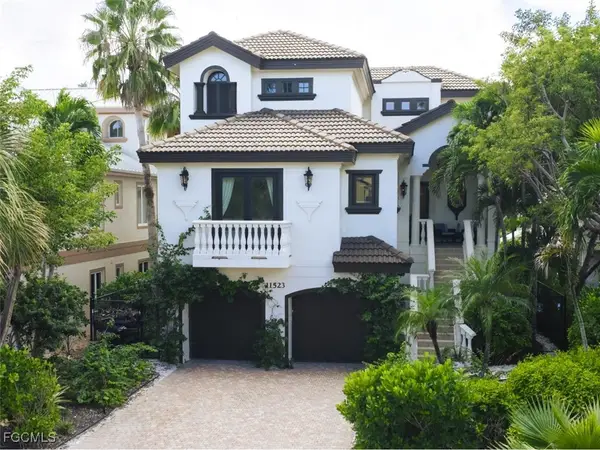 $3,795,000Active5 beds 6 baths3,555 sq. ft.
11523 Andy Rosse Lane, Captiva, FL 33924
MLS# 2025014469Listed by: MICHAEL SAUNDERS & COMPANY $330,000Active1 beds 1 baths580 sq. ft.
3124 Tennis Villas, Captiva, FL 33924
MLS# 2025016437Listed by: ROYAL SHELL REAL ESTATE, INC. $3,395,000Active5 beds 5 baths4,356 sq. ft.
1124 Longifolia Court, Captiva, FL 33924
MLS# 2025001507Listed by: ROYAL SHELL REAL ESTATE, INC. $289,000Active1 beds 1 baths586 sq. ft.
3117 Tennis Villas, Captiva, FL 33924
MLS# 2025016323Listed by: ROYAL SHELL REAL ESTATE, INC.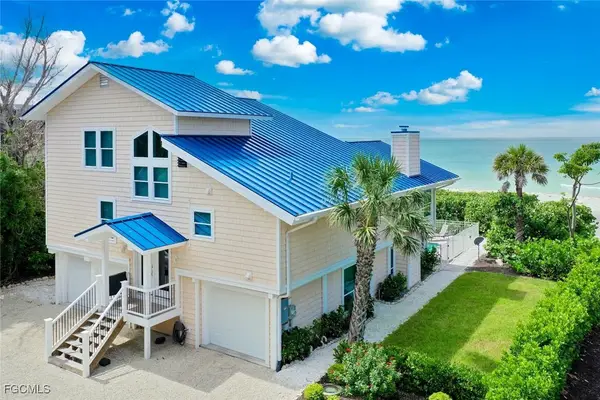 $3,995,000Active4 beds 4 baths2,980 sq. ft.
15301 Captiva Drive, Captiva, FL 33924
MLS# 2025015074Listed by: KINGFISHER REAL ESTATE, INC. $11,900,000Active5 beds 6 baths5,751 sq. ft.
15735/737 Captiva Drive, Captiva, FL 33924
MLS# 2025013848Listed by: KINGFISHER REAL ESTATE, INC. $1,199,000Active2 beds 2 baths1,397 sq. ft.
1659 Lands End Village, Captiva, FL 33924
MLS# 2025011943Listed by: PREMIER SOTHEBY'S INT'L REALTY $445,000Active1 beds 2 baths684 sq. ft.
5132 Bayside Villas, Captiva, FL 33924
MLS# 2025012075Listed by: JOHN R. WOOD PROPERTIES $590,000Active1 beds 1 baths687 sq. ft.
2623 Beach Villas, Captiva, FL 33924
MLS# 2025005706Listed by: JOHN R. WOOD PROPERTIES $11,500,000Active6 beds 8 baths6,292 sq. ft.
17030 Captiva Drive, Captiva, FL 33924
MLS# 2025006303Listed by: ROYAL SHELL REAL ESTATE, INC.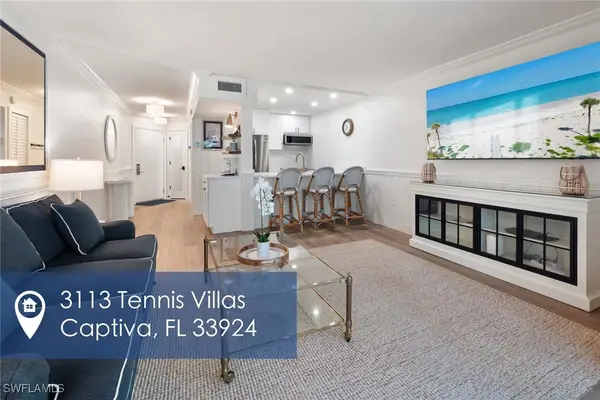 $399,900Active1 beds 1 baths586 sq. ft.
3113 Tennis Villas, Captiva, FL 33924
MLS# 225058564Listed by: DOMAINREALTY.COM LLC $6,950,000Active5 beds 7 baths3,915 sq. ft.
15009 Binder Drive, Captiva, FL 33924
MLS# 2026000903Listed by: JOHN R. WOOD PROPERTIES $2,694,000Active3 beds 3 baths2,444 sq. ft.
1602 Lands End Village, Captiva, FL 33924
MLS# 225044989Listed by: KINGFISHER REAL ESTATE, INC. $6,600,000Active6 beds 7 baths4,000 sq. ft.
16500 Captiva Drive, Captiva, FL 33924
MLS# 2025017576Listed by: ROYAL SHELL REAL ESTATE, INC. $10,900,000Active5 beds 6 baths5,059 sq. ft.
16730 Captiva Drive, Captiva, FL 33924
MLS# 225040906Listed by: ROYAL SHELL REAL ESTATE, INC. $1,375,000Active2 beds 2 baths1,318 sq. ft.
15123 Captiva Drive #104, Captiva, FL 33924
MLS# 2025015133Listed by: KINGFISHER REAL ESTATE, INC. $5,500,000Active5 beds 5 baths3,890 sq. ft.
16205 Captiva Drive, Captiva, FL 33924
MLS# 226006390Listed by: COLDWELL BANKER REALTY $330,000Active1 beds 1 baths586 sq. ft.
3136 Tennis Villas, Captiva, FL 33924
MLS# 2026001551Listed by: JOHN R. WOOD PROPERTIES $4,900,000Active3 beds 3 baths2,096 sq. ft.
19 Beach Homes, Captiva, FL 33924
MLS# 2026010269Listed by: JOHN R. WOOD PROPERTIES $2,599,000Active3 beds 3 baths1,130 sq. ft.
1411 Beach Cottages #1411, Captiva, FL 33924
MLS# 225031126Listed by: JOHN R. WOOD PROPERTIES $6,900,000Active5 beds 5 baths4,608 sq. ft.
16886 Captiva Drive, Captiva, FL 33924
MLS# 225026465Listed by: KINGFISHER REAL ESTATE, INC. $414,500Active1 beds 1 baths586 sq. ft.
3222 Tennis Villas, Captiva, FL 33924
MLS# 225030193Listed by: JOHN R. WOOD PROPERTIES $4,800,000Active3 beds 3 baths2,373 sq. ft.
16543 Captiva Drive, Captiva, FL 33924
MLS# 225029219Listed by: ROYAL SHELL REAL ESTATE, INC. $3,500,000Pending3 beds 4 baths3,028 sq. ft.
16891 Captiva Drive, Captiva, FL 33924
MLS# 225019730Listed by: KINGFISHER REAL ESTATE, INC. $12,500,000Active5 beds 6 baths5,843 sq. ft.
16530 Captiva Drive, Captiva, FL 33924
MLS# 225024734Listed by: ROYAL SHELL REAL ESTATE, INC. $599,999Active2 beds 2 baths894 sq. ft.
3233 Tennis Villas, Captiva, FL 33924
MLS# 225021477Listed by: JOHN R. WOOD PROPERTIES $4,695,000Pending3 beds 4 baths3,258 sq. ft.
16475 Captiva Drive, CAPTIVA, FL 33924
MLS# A4638952Listed by: DOUGLAS ELLIMAN FLORIDA,LLC $475,000Active1 beds 2 baths684 sq. ft.
5136 Bayside Villas, Captiva, FL 33924
MLS# 225015381Listed by: PELICAN'S NEST REALTY SERVICES $5,250,000Active4 beds 3 baths2,897 sq. ft.
15899 Captiva Drive, Captiva, FL 33924
MLS# 225013345Listed by: ROYAL SHELL REAL ESTATE, INC. $12,000,000Active1.2 Acres
15819 Captiva Drive, Captiva, FL 33924
MLS# 225009365Listed by: ROYAL SHELL REAL ESTATE, INC. $9,450,000Active6 beds 7 baths5,346 sq. ft.
16777 Captiva Drive, Captiva, FL 33924
MLS# 224082961Listed by: KINGFISHER REAL ESTATE, INC. $4,999,500Active3 beds 3 baths2,414 sq. ft.
15153 Captiva Drive W, Captiva, FL 33924
MLS# 2025021654Listed by: KINGFISHER REAL ESTATE, INC. $610,000Active1 beds 1 baths687 sq. ft.
2117 Gulf Beach Villas, Captiva, FL 33924
MLS# 225008378Listed by: ROYAL SHELL REAL ESTATE, INC.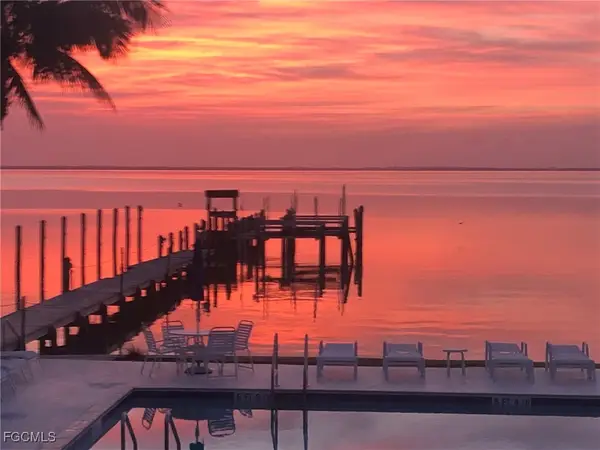 $1,375,000Active2 beds 2 baths1,200 sq. ft.
11400 Old Lodge Lane #1C, Captiva, FL 33924
MLS# 225011517Listed by: MICHAEL SAUNDERS & COMPANY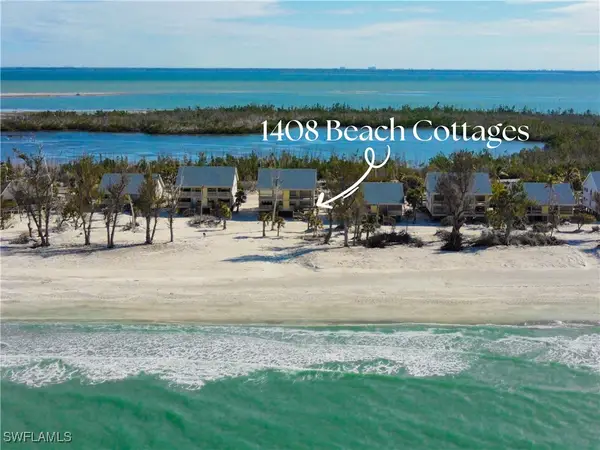 $1,650,000Active2 beds 2 baths960 sq. ft.
1408 Beach Cottages, Captiva, FL 33924
MLS# 224105072Listed by: JOHN R. WOOD PROPERTIES $9,700,000Active5 beds 5 baths4,134 sq. ft.
16770 Captiva Drive, Captiva, FL 33924
MLS# 2025014681Listed by: JOHN R. WOOD PROPERTIES $499,000Active1 beds 2 baths684 sq. ft.
5120 Bayside Villas, Captiva, FL 33924
MLS# 224104502Listed by: JOHN R. WOOD PROPERTIES $1,550,000Active3 beds 3 baths2,300 sq. ft.
1666 Lands End Village, Captiva, FL 33924
MLS# 224103346Listed by: KINGFISHER REAL ESTATE, INC. $410,000Active1 beds 1 baths586 sq. ft.
3213 Tennis Villas, Captiva, FL 33924
MLS# 225027882Listed by: KINGFISHER REAL ESTATE, INC.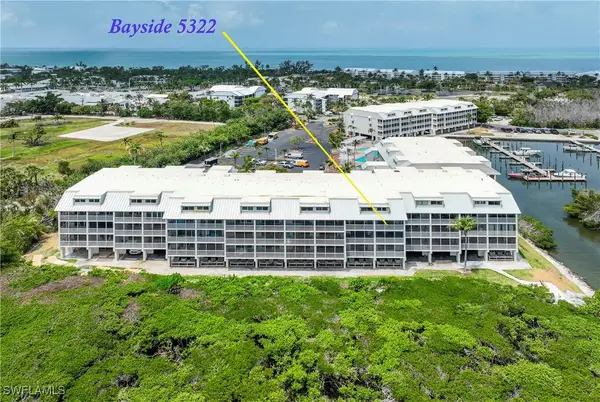 $1,100,000Active3 beds 3 baths1,496 sq. ft.
5321 Bayside Villas #22, Captiva, FL 33924
MLS# 224043873Listed by: ROYAL SHELL REAL ESTATE, INC. $1,499,000Active2 beds 2 baths1,323 sq. ft.
15123 Captiva Drive #103, Captiva, FL 33924
MLS# 224020201Listed by: KINGFISHER REAL ESTATE, INC.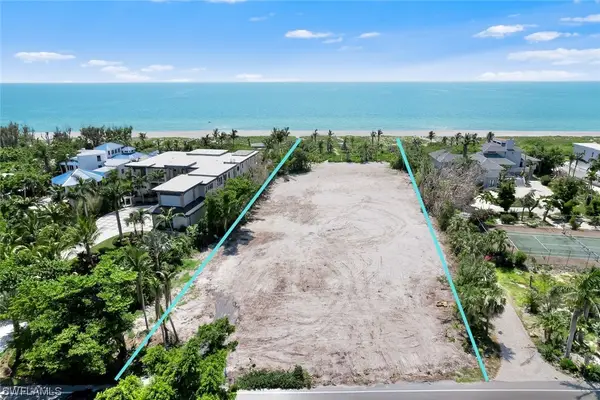 $12,000,000Active2 Acres
16280 Captiva Drive, Captiva, FL 33924
MLS# 223058783Listed by: ROYAL SHELL REAL ESTATE, INC. $3,489,000Active5 beds 5 baths3,485 sq. ft.
15557 Captiva Drive, Captiva, FL 33924
MLS# 223085708Listed by: ROYAL SHELL REAL ESTATE, INC. $5,700,000Active6 beds 8 baths5,598 sq. ft.
16979 Captiva Drive, Captiva, FL 33924
MLS# 224097316Listed by: KINGFISHER REAL ESTATE, INC. $720,000Active2 beds 2 baths900 sq. ft.
3134 Tennis Villas, Captiva, FL 33924
MLS# 223076501Listed by: ROYAL SHELL REAL ESTATE, INC. $1,295,000Active3 beds 3 baths1,410 sq. ft.
15411 Captiva Drive #3B, Captiva, FL 33924
MLS# 223053885Listed by: KINGFISHER REAL ESTATE, INC. $3,250,000Active2 beds 2 baths1,344 sq. ft.
17170 Captiva Drive, Captiva, FL 33924
MLS# 223036615Listed by: ROYAL SHELL REAL ESTATE, INC. $5,950,000Active5 beds 4 baths3,681 sq. ft.
16632 Captiva Drive, Captiva, FL 33924
MLS# 2026002529Listed by: KINGFISHER REAL ESTATE, INC. $3,495,000Active6 beds 6 baths4,248 sq. ft.
11505 Gore Lane, Captiva, FL 33924
MLS# 222081534Listed by: JOHN R. WOOD PROPERTIES $7,950,000Active6 beds 6 baths5,813 sq. ft.
16512 Captiva Drive, Captiva, FL 33924
MLS# 222057371Listed by: ROYAL SHELL REAL ESTATE, INC.
Local realty services provided by:CENTURY 21 Results, CENTURY 21 Real Estate Champions
The information being provided by Stellar Mls is for the consumer's personal, non-commercial use and may not be used for any purpose other than to identify prospective properties consumer may be interested in purchasing. Any information relating to real estate for sale referenced on this web site comes from the Internet Data Exchange (IDX) program of the Stellar Mls. CENTURY 21 Real Estate Champions is not a Multiple Listing Service (MLS), nor does it offer MLS access. This website is a service of CENTURY 21 Real Estate Champions, a broker participant of Stellar Mls. This web site may reference real estate listing(s) held by a brokerage firm other than the broker and/or agent who owns this web site.
The accuracy of all information, regardless of source, including but not limited to open house information, square footages and lot sizes, is deemed reliable but not guaranteed and should be personally verified through personal inspection by and/or with the appropriate professionals. The data contained herein is copyrighted by Stellar Mls and is protected by all applicable copyright laws. Any unauthorized dissemination of this information is in violation of copyright laws and is strictly prohibited.
Properties in listings may have been sold or may no longer be available.
Copyright 2026 Stellar Mls. All rights reserved.
Neighborhoods near Captiva, FL
Zip codes near Captiva, FL
- 33901 homes for sale
- 33903 homes for sale
- 33904 homes for sale
- 33907 homes for sale
- 33908 homes for sale
- 33909 homes for sale
- 33912 homes for sale
- 33914 homes for sale
- 33919 homes for sale
- 33921 homes for sale
- 33922 homes for sale
- 33924 homes for sale
- 33931 homes for sale
- 33946 homes for sale
- 33956 homes for sale
- 33957 homes for sale
- 33966 homes for sale
- 33990 homes for sale
- 33991 homes for sale
- 33993 homes for sale
Popular searches near Captiva, FL
- Boca Grande homes for sale
- Bokeelia homes for sale
- Burnt Store Marina homes for sale
- Cape Coral homes for sale
- Cypress Lake homes for sale
- Estero Island homes for sale
- Fort Myers Beach homes for sale
- Harlem Heights homes for sale
- Iona homes for sale
- Matlacha homes for sale
- Matlacha Isles-Matlacha Shores homes for sale
- McGregor homes for sale
- Pine Island homes for sale
- Pine Island Center homes for sale
- Pineland homes for sale
- Punta Rassa homes for sale
- St James City homes for sale
- Sanibel homes for sale
- Sanibel Island homes for sale
- Whiskey Creek homes for sale
Protect your home and budget from life's surprises with an Assurant Home Warranty, backed by a partner that supports you through every step of homeownership. Explore Plans.
©2026 Century 21 Real Estate LLC. All rights reserved. CENTURY 21®, the CENTURY 21 Logo and C21® are service marks owned by Century 21 Real Estate LLC. Century 21 Real Estate LLC fully supports the principles of the Fair Housing Act and the Equal Opportunity Act. Each office is independently owned and operated. Listing information is deemed reliable but not guaranteed accurate.