- Barrett Creek, Marietta homes for sale
- Barrett Greene, Marietta homes for sale
- Bent Water, North Paulding homes for sale
- Brookstone, Acworth homes for sale
- Carter Grove Plantation, Cartersville homes for sale
- City of Marietta, Marietta homes for sale
- Hardage Farm, Marietta homes for sale
- Hickory at Shiloh, Kennesaw homes for sale
- Lakefield Manor, Marietta homes for sale
- Legacy Park, Kennesaw homes for sale
- Overlook, Kennesaw homes for sale
- Pine Tree Country Club, Kennesaw homes for sale
- Ridenour, Kennesaw homes for sale
- Seven Hills, Dallas homes for sale
- Shiloh Valley, Kennesaw homes for sale
- The Adares, Adairsville homes for sale
- The Enclave at Laura Creek, Marietta homes for sale
- The Woodlands, Woodstock homes for sale
- Vista Lake, Dallas homes for sale
- Wexford, Roswell homes for sale
Cartersville, GA - homes for sale
61 of 61 results displayed
 $259,900Active3 beds 3 baths1,302 sq. ft.
139 Chastain Dr, Cartersville, GA 30120
MLS# 7693617Listed by: REALTY OF AMERICA, LLC
 $259,900Active3 beds 3 baths1,302 sq. ft.
145 Chastain Dr, Cartersville, GA 30120
MLS# 7693631Listed by: REALTY OF AMERICA, LLC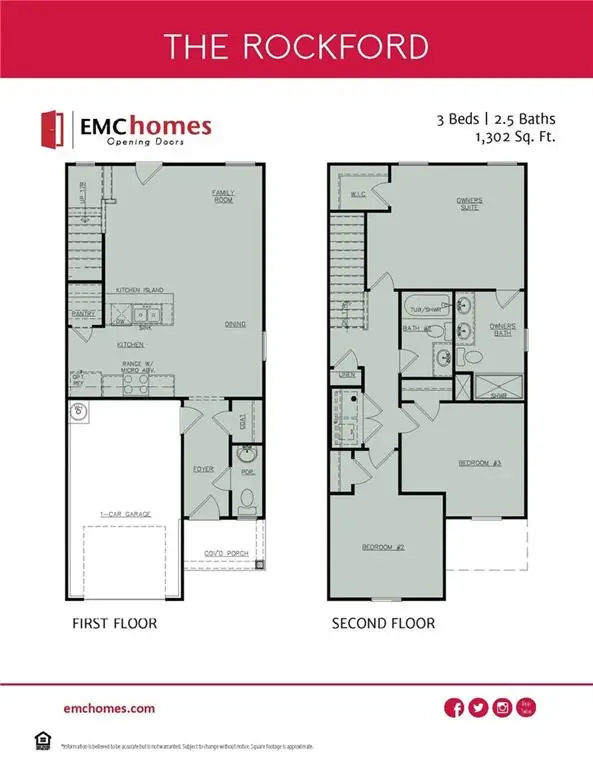 $259,900Active3 beds 3 baths1,302 sq. ft.
147 Chastain Dr, Cartersville, GA 30120
MLS# 7693634Listed by: REALTY OF AMERICA, LLC $259,900Active3 beds 3 baths1,302 sq. ft.
149 Chastain Dr, Cartersville, GA 30120
MLS# 7693641Listed by: REALTY OF AMERICA, LLC- New
 $399,925Active4 beds 3 baths2,130 sq. ft.
701 Mistwood Way, Cartersville, GA 30120
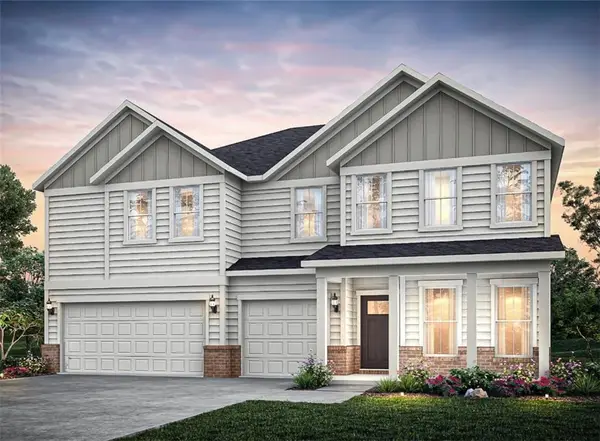
MLS# 10788279Listed by: Ashton Woods Realty  $418,180Active4 beds 4 baths
613 Elwick Lane, Cartersville, GA 30120
MLS# 10784861Listed by: Ashton Woods Realty $415,790Active5 beds 3 baths2,511 sq. ft.
337 Belmont Drive, Cartersville, GA 30120
MLS# 10783915Listed by: D.R. Horton Realty of Georgia, Inc. $417,130Active5 beds 4 baths
607 Elwick Lane Se, Cartersville, GA 30120
MLS# 10777355Listed by: Ashton Woods Realty $335,000Active3 beds 2 baths1,432 sq. ft.
15 Plantation Drive Ne, Cartersville, GA 30121
MLS# 10772906Listed by: eXp Realty- Open Thu, 11am to 5pm
 $435,790Active5 beds 3 baths2,804 sq. ft.
353 Belmont Drive, Cartersville, GA 30120
MLS# 7776531Listed by: D.R. HORTON REALTY OF GEORGIA INC - Open Thu, 11am to 5pm
 $450,790Active5 beds 3 baths3,209 sq. ft.
357 Belmont Drive, Cartersville, GA 30120
MLS# 7776536Listed by: D.R. HORTON REALTY OF GEORGIA INC  $374,990Active4 beds 3 baths1,879 sq. ft.
258 Summit Height Drive, Cartersville, GA 30121
MLS# 7748618Listed by: ASHER REALTY, INC $384,790Active4 beds 4 baths1,774 sq. ft.
381 Belmont Drive, Cartersville, GA 30120
MLS# 10770359Listed by: D.R. Horton Realty of Georgia, Inc. $244,900Active3 beds 3 baths1,629 sq. ft.
213 Pisgah Crossing #7, Cartersville, GA 30120
MLS# 10768094Listed by: SDC Realty $269,900Active3 beds 3 baths1,627 sq. ft.
100 Sylvie Drive #1, Cartersville, GA 30121
MLS# 7771711Listed by: SDC REALTY, LLC. $257,900Active3 beds 3 baths1,627 sq. ft.
100 Sylvie Drive #1, Cartersville, GA 30120
MLS# 10765753Listed by: SDC Realty $349,900Active4 beds 3 baths
707 Mistwood Way Se, Cartersville, GA 30120
MLS# 10764814Listed by: Ashton Woods Realty $609,900Active5 beds 4 baths2,570 sq. ft.
28 Bridgestone Way Se, Cartersville, GA 30120
MLS# 10763686Listed by: Atlanta Communities $450,790Active5 beds 3 baths3,209 sq. ft.
349 Belmont Drive, Cartersville, GA 30120
MLS# 10760297Listed by: D.R. Horton Realty of Georgia, Inc. $374,900Active5 beds 4 baths
608 Elwick Lane Se, Cartersville, GA 30120
MLS# 10759901Listed by: Ashton Woods Realty $263,800Active3 beds 3 baths1,627 sq. ft.
210 Clara Crossing #13, Cartersville, GA 30121
MLS# 7766068Listed by: SDC REALTY, LLC. $414,790Active5 beds 3 baths2,511 sq. ft.
351 Belmont Drive, Cartersville, GA 30120
MLS# 10757786Listed by: D.R. Horton Realty of Georgia, Inc. $296,630Active2 beds 2 baths1,624 sq. ft.
24 Harmony Circle, Cartersville, GA 30120
MLS# 7764083Listed by: WINDSONG REALTY, LLC $307,010Active2 beds 3 baths1,732 sq. ft.
118 Harmony Circle, Cartersville, GA 30120
MLS# 7763770Listed by: WINDSONG REALTY, LLC $293,555Pending2 beds 2 baths1,596 sq. ft.
120 Harmony Circle, Cartersville, GA 30120
MLS# 7763777Listed by: WINDSONG REALTY, LLC $329,990Active2 beds 2 baths
146 Sunflower Circle, Cartersville, GA 30121
MLS# 7758645Listed by: ASHER REALTY, INC $319,990Active2 beds 2 baths
138 Sunflower Circle Ne, Cartersville, GA 30121
MLS# 7758660Listed by: ASHER REALTY, INC- Open Sat, 11am to 5pm
 $387,990Active3 beds 3 baths2,024 sq. ft.
200 Daisy Court, Cartersville, GA 30121
MLS# 7758669Listed by: ASHER REALTY, INC  $244,850Active3 beds 3 baths1,627 sq. ft.
159 Oconee Road #254, Cartersville, GA 30120
MLS# 10738438Listed by: SDC Realty $414,790Active5 beds 3 baths2,511 sq. ft.
341 Belmont Drive, Cartersville, GA 30120
MLS# 10738496Listed by: D.R. Horton Realty of Georgia, Inc. $493,790Active5 beds 3 baths3,209 sq. ft.
333 Belmont Drive, Cartersville, GA 30120
MLS# 10738506Listed by: D.R. Horton Realty of Georgia, Inc. $263,560Active3 beds 3 baths1,629 sq. ft.
209 Pisgah Crossing #5, Cartersville, GA 30120
MLS# 10738381Listed by: SDC Realty $234,750Active3 beds 3 baths1,443 sq. ft.
158 Oconee Road #272, Cartersville, GA 30120
MLS# 10738418Listed by: SDC Realty $297,035Pending2 beds 2 baths1,627 sq. ft.
26 Harmony Circle, Cartersville, GA 30120
MLS# 7755691Listed by: WINDSONG REALTY, LLC $308,510Active2 beds 2 baths1,627 sq. ft.
28 Harmony Circle, Cartersville, GA 30120
MLS# 7755044Listed by: WINDSONG REALTY, LLC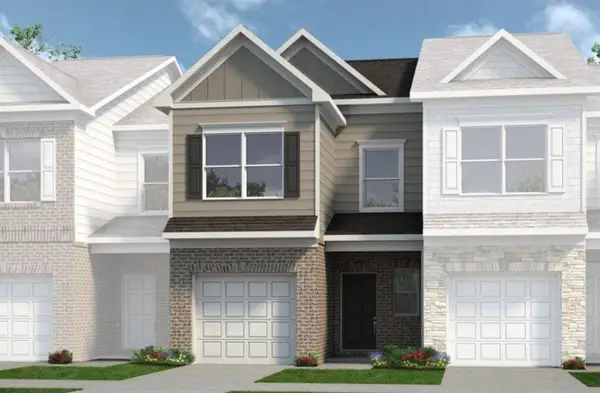 $253,900Active3 beds 3 baths1,443 sq. ft.
208 Clara Crossing #12, Cartersville, GA 30121
MLS# 7748526Listed by: SDC REALTY, LLC. $389,990Active4 beds 3 baths2,186 sq. ft.
256 Summit Height Drive, Cartersville, GA 30121
MLS# 7748456Listed by: ASHER REALTY, INC $379,990Active4 beds 3 baths1,866 sq. ft.
260 Summit Height Drive, Cartersville, GA 30121
MLS# 7748641Listed by: ASHER REALTY, INC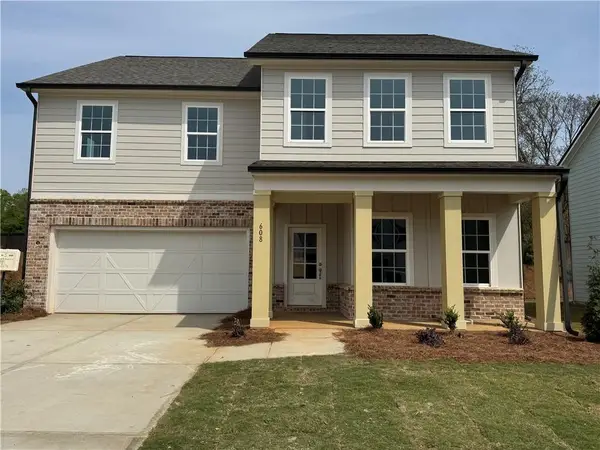 $374,900Pending5 beds 4 baths2,774 sq. ft.
608 Elwick Lane Se, Cartersville, GA 30120
MLS# 7748629Listed by: ASHTON WOODS REALTY, LLC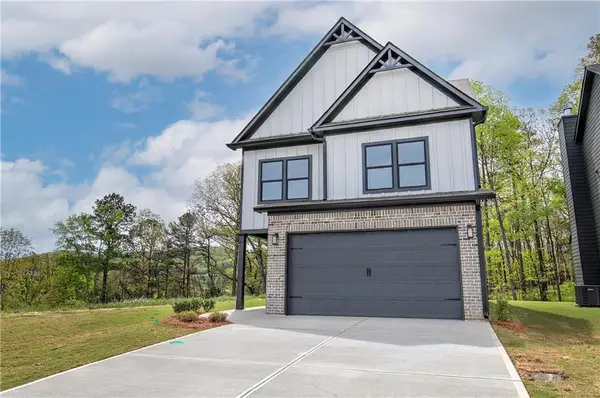 $379,990Pending4 beds 3 baths1,866 sq. ft.
266 Summit Height Drive, Cartersville, GA 30121
MLS# 7748416Listed by: ASHER REALTY, INC- Open Sat, 2 to 5pm
 $499,530Active5 beds 4 baths3,853 sq. ft.
115 Jane Boulevard Nw, Cartersville, GA 30120
MLS# 7741012Listed by: PULTE REALTY OF GEORGIA, INC.  $439,745Active4 beds 3 baths2,220 sq. ft.
4 Commons Way, Cartersville, GA 30120
MLS# 7737709Listed by: CHAFIN REALTY, INC. $249,565Active3 beds 3 baths1,443 sq. ft.
162 Oconee Road #270, Cartersville, GA 30120
MLS# 10710214Listed by: SDC Realty $249,900Active3 beds 3 baths1,629 sq. ft.
155 Oconee Road #252, Cartersville, GA 30120
MLS# 10703774Listed by: SDC Realty $374,900Active3 beds 3 baths1,574 sq. ft.
20 Beaureguard Street, Cartersville, GA 30120
MLS# 10701507Listed by: LakePoint Realty Group $432,290Active5 beds 3 baths2,804 sq. ft.
362 Belmont Drive, Cartersville, GA 30120
MLS# 10701348Listed by: D.R. Horton Realty of Georgia, Inc. $374,990Active4 beds 3 baths1,879 sq. ft.
264 Summit Height Drive, Cartersville, GA 30121
MLS# 7715500Listed by: ASHER REALTY, INC $259,900Active3 beds 3 baths
149 Chastain Drive, Cartersville, GA 30120
MLS# 10665674Listed by: Realty of America $259,900Active3 beds 3 baths
139 Chastain Drive, Cartersville, GA 30120
MLS# 10665637Listed by: Realty of America $259,900Active3 beds 3 baths
143 Chastain Drive, Cartersville, GA 30120
MLS# 10665659Listed by: Realty of America $259,900Active3 beds 3 baths
145 Chastain Drive, Cartersville, GA 30120
MLS# 10665666Listed by: Realty of America $259,900Active3 beds 3 baths
147 Chastain Drive, Cartersville, GA 30120
MLS# 10665671Listed by: Realty of America $849,900Active3 beds 4 baths
178 W Main Street #204, Cartersville, GA 30120
MLS# 10644940Listed by: Professional Realty Group, Inc $379,990Pending3 beds 3 baths1,582 sq. ft.
201 Daisy Court, Cartersville, GA 30121
MLS# 7652680Listed by: ASHER REALTY, INC $859,900Active3 beds 4 baths2,411 sq. ft.
178 W Main Street #102, Cartersville, GA 30120
MLS# 7696600Listed by: PROFESSIONAL REALTY GROUP $412,990Active3 beds 3 baths2,025 sq. ft.
141 Sunflower Circle, Cartersville, GA 30121
MLS# 7631104Listed by: ASHER REALTY, INC $769,900Active4 beds 4 baths2,815 sq. ft.
208 Belmont Drive Se, Cartersville, GA 30120
MLS# 7312075Listed by: ATLANTA COMMUNITIES REAL ESTATE BROKERAGE $509,900Active4 beds 4 baths3,100 sq. ft.
13 Cranford Circle, Cartersville, GA 30120
MLS# 7306261Listed by: ATLANTA COMMUNITIES REAL ESTATE BROKERAGE $499,900Active4 beds 3 baths2,088 sq. ft.
10 Lakewood Court Se, Cartersville, GA 30120
MLS# 7236868Listed by: KFH REALTY, LLC. $669,900Active4 beds 4 baths3,300 sq. ft.
217 Belmont Drive Se, Cartersville, GA 30120
MLS# 7155978Listed by: KFH REALTY, LLC. $669,900Active4 beds 4 baths3,248 sq. ft.
10 Plantation Ridge Se, Cartersville, GA 30120
MLS# 7156096Listed by: KFH REALTY, LLC.
Local realty services provided by:CENTURY 21 Crowe Realty, CENTURY 21 Realty 1 Professionals
2026 Georgia MLS. All rights reserved. Information Deem Reliable But Not Guaranteed June 23, 2026 METROMLS Member Broker: Angela Whitmire
Neighborhoods near Cartersville, GA
Zip codes near Cartersville, GA
- 30066 homes for sale
- 30101 homes for sale
- 30102 homes for sale
- 30103 homes for sale
- 30104 homes for sale
- 30114 homes for sale
- 30120 homes for sale
- 30121 homes for sale
- 30132 homes for sale
- 30137 homes for sale
- 30139 homes for sale
- 30144 homes for sale
- 30145 homes for sale
- 30152 homes for sale
- 30161 homes for sale
- 30171 homes for sale
- 30178 homes for sale
- 30183 homes for sale
- 30184 homes for sale
- 30189 homes for sale
Popular searches near Cartersville, GA
- Acworth homes for sale
- Acworth-Kennesaw homes for sale
- Adairsville homes for sale
- Aragon homes for sale
- Canton homes for sale
- Emerson homes for sale
- Euharlee homes for sale
- Euharlee-Taylorsville homes for sale
- Fairmount homes for sale
- Holly Springs homes for sale
- Kennesaw homes for sale
- Kingston homes for sale
- North Paulding homes for sale
- Rockmart homes for sale
- Rydal homes for sale
- Taylorsville homes for sale
- Waleska homes for sale
- White homes for sale
- White-Pine Log homes for sale
- Woodstock homes for sale
Protect your home and budget from life's surprises with an Assurant Home Warranty, backed by a partner that supports you through every step of homeownership. Explore Plans.
©2026 Century 21 Real Estate LLC. All rights reserved. CENTURY 21®, the CENTURY 21 Logo and C21® are service marks owned by Century 21 Real Estate LLC. Century 21 Real Estate LLC fully supports the principles of the Fair Housing Act and the Equal Opportunity Act. Each office is independently owned and operated. Listing information is deemed reliable but not guaranteed accurate.