- Champaign homes for sale
- Champaign City homes for sale
- Cunningham homes for sale
- Hensley homes for sale
- Lake Of The Woods homes for sale
- Mahomet homes for sale
- Mahomet Township homes for sale
- Philo homes for sale
- Philo Township homes for sale
- Rantoul Township homes for sale
- St Joseph homes for sale
- St. Joseph Township homes for sale
- Savoy homes for sale
- Sidney homes for sale
- Somer homes for sale
- Thomasboro homes for sale
- Tolono Township homes for sale
- Tolono homes for sale
- Urbana Township homes for sale
- Urbana homes for sale
Champaign County, IL - homes for sale
300 of 640 results displayed
- New
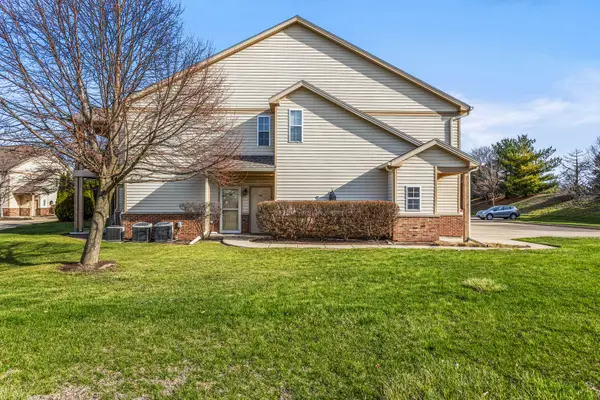
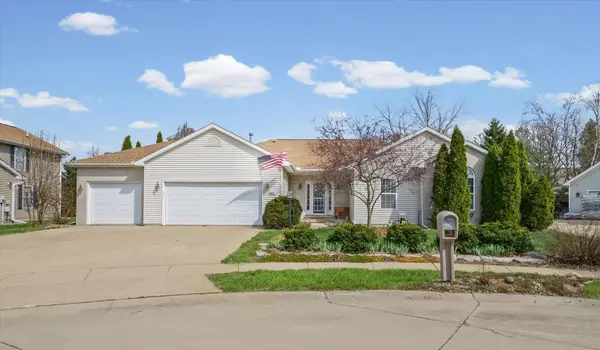 $370,000Active3 beds 3 baths2,240 sq. ft.
3004 Countrybend Lane, Champaign, IL 61822
MLS# 12604797Listed by: HAPP REALTY
- New
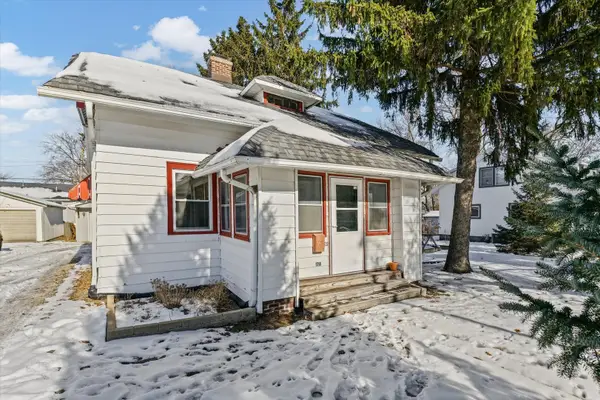 $209,900Active3 beds 2 baths1,608 sq. ft.
1710 W Church Street, Champaign, IL 61821
MLS# 12606513Listed by: REALTY SELECT ONE - New
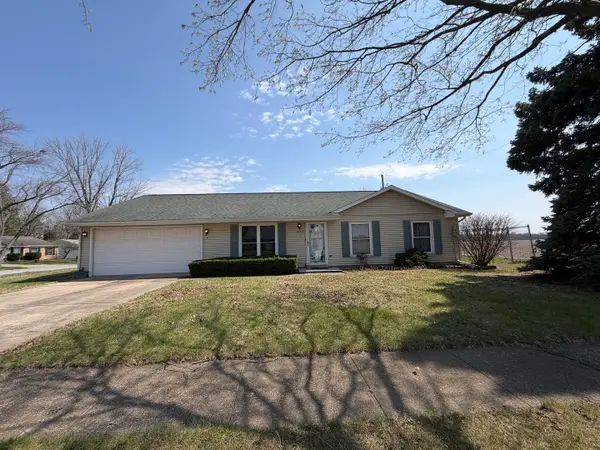
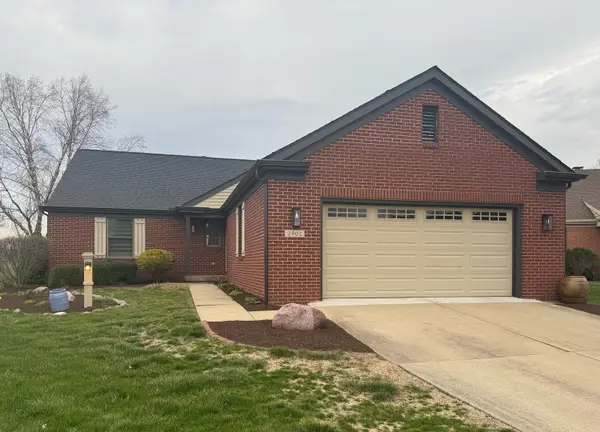
 $370,000Active4 beds 3 baths2,248 sq. ft.
2807 Willow Bend Road, Champaign, IL 61822
MLS# 12562811Listed by: COLDWELL BANKER R.E. GROUP - New
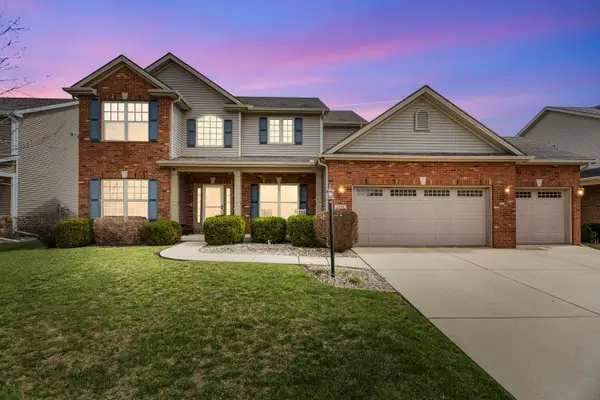
 $210,000Active4 beds 2 baths1,676 sq. ft.
1002 Goldenview Drive, Champaign, IL 61821
MLS# 12574985Listed by: RYAN DALLAS REAL ESTATE - New
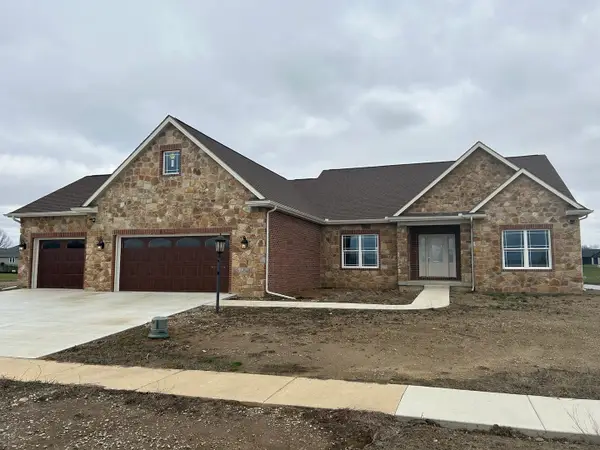
 $850,000Active5 beds 5 baths2,518 sq. ft.
1614 English Oak Drive, Champaign, IL 61822
MLS# 12588743Listed by: COLDWELL BANKER R.E. GROUP - Open Sat, 10am to 12pmNew
 $465,000Active4 beds 4 baths2,394 sq. ft.
2116 Leahs Lane, Champaign, IL 61822
MLS# 12599873Listed by: REAL BROKER, LLC - New
 $325,000Active4 beds 2 baths1,650 sq. ft.
203 E Church Street, Gifford, IL 61847
MLS# 12606097Listed by: TOWN & COUNTRY REALTY,LLP - New
 $179,900Active2 beds 1 baths966 sq. ft.
1311 W Hill Street, Champaign, IL 61821
MLS# 12606092Listed by: CHAMPAIGN COUNTY REALTY - New
 $249,999Active3 beds 2 baths1,248 sq. ft.
408 E Marshall Street, Tolono, IL 61880
MLS# 12600580Listed by: THE REAL ESTATE GROUP,INC - New
 $399,000Active4 beds 3 baths2,275 sq. ft.
1801 Cindy Lynn Street, Urbana, IL 61802
MLS# 12600766Listed by: TRAUTMAN REAL ESTATE AGENCY & APPRAISAL LLC - New
 $210,000Active2 beds 2 baths1,197 sq. ft.
401 E Main Street, Royal, IL 61871
MLS# 12605069Listed by: CLINGAN,JIM AUCTION&REALTY,INC - New
 $449,900Active4 beds 4 baths2,511 sq. ft.
205 E Sherwin Circle, Urbana, IL 61802
MLS# 12602071Listed by: KELLER WILLIAMS-TREC - New
 $279,900Active3 beds 2 baths1,909 sq. ft.
609 E Sunnycrest Court, Urbana, IL 61801
MLS# 12566184Listed by: KELLER WILLIAMS-TREC - New
 $179,900Active3 beds 1 baths1,192 sq. ft.
1612 Cornell Drive, Champaign, IL 61821
MLS# 12600786Listed by: TRAUTMAN REAL ESTATE AGENCY & APPRAISAL LLC - New
 $640,000Active-- beds -- baths
Address Withheld By Seller, Mahomet, IL 61853
MLS# 12604868Listed by: CHAMPAIGN COUNTY REALTY - New
 $320,000Active-- beds -- baths
Address Withheld By Seller, Mahomet, IL 61853
MLS# 12590049Listed by: CHAMPAIGN COUNTY REALTY - New
 $320,000Active-- beds -- baths
2737a County Road 380 E, Mahomet, IL 61853
MLS# 12590070Listed by: CHAMPAIGN COUNTY REALTY - New
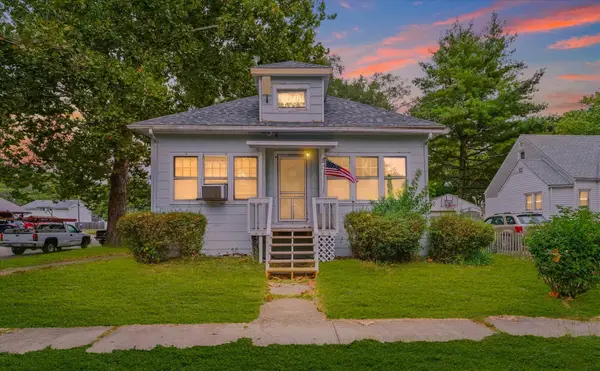 $155,000Active3 beds 2 baths1,645 sq. ft.
801 E Sangamon Avenue, Rantoul, IL 61866
MLS# 12604537Listed by: KELLER WILLIAMS-TREC - New
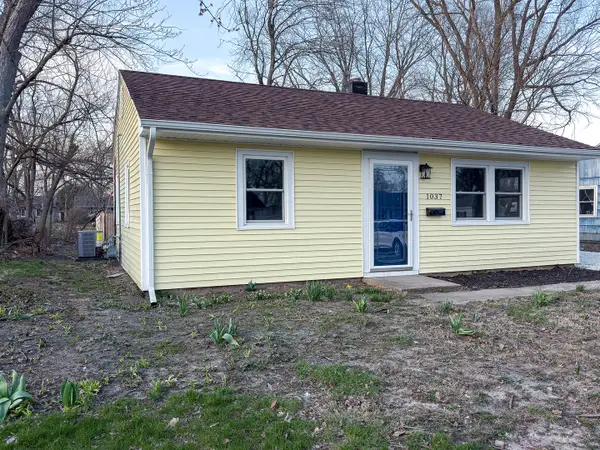 $117,500Active2 beds 1 baths766 sq. ft.
1037 Eastview Drive, Rantoul, IL 61866
MLS# 12557050Listed by: THE REAL ESTATE GROUP,INC - New
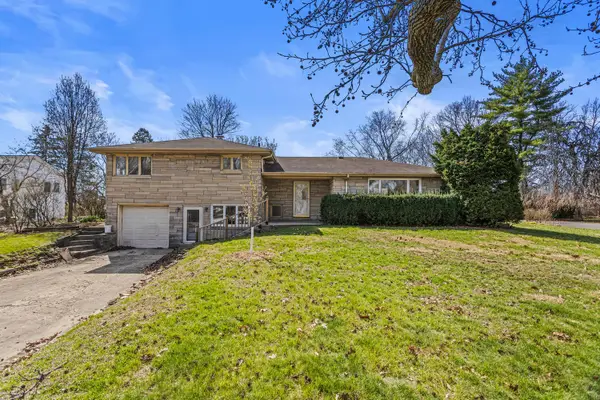 $199,900Active3 beds 2 baths2,015 sq. ft.
1708 Park Haven Drive, Champaign, IL 61820
MLS# 12600837Listed by: REAL BROKER, LLC - New
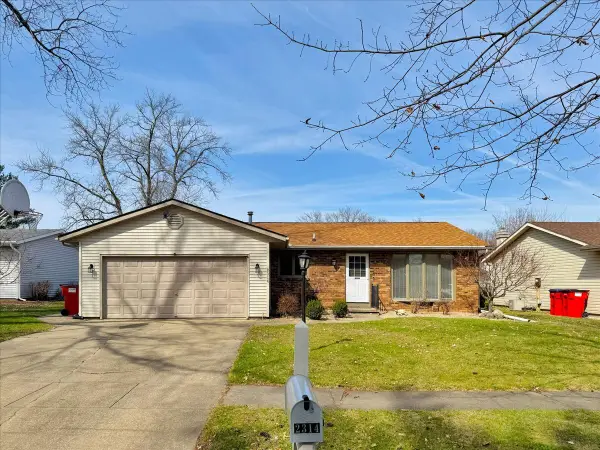 $319,900Active4 beds 3 baths1,928 sq. ft.
2314 Aspen Drive, Champaign, IL 61821
MLS# 12575457Listed by: TRAUTMAN REAL ESTATE AGENCY & APPRAISAL LLC - New
 $195,000Active3 beds 1 baths1,053 sq. ft.
2705 Willowpark Drive, Champaign, IL 61821
MLS# 12598515Listed by: KELLER WILLIAMS-TREC  $289,000Pending3 beds 2 baths1,619 sq. ft.
1224 Foothill Drive, Champaign, IL 61821
MLS# 12593802Listed by: RE/MAX REALTY ASSOCIATES-CHA- New
 $264,900Active3 beds 2 baths1,629 sq. ft.
408 E Victory Street, Sidney, IL 61877
MLS# 12604040Listed by: TAYLOR REALTY ASSOCIATES - New
 $89,900Active3 beds 2 baths
595 Bureau Street, Mahomet, IL 61853
MLS# 12598664Listed by: RE/MAX REALTY ASSOCIATES-CHA - New
 $189,900Active2 beds 2 baths1,244 sq. ft.
3604 Thornhill Drive #3604, Champaign, IL 61822
MLS# 12603580Listed by: COLDWELL BANKER R.E. GROUP - New
 $425,000Active3 beds 2 baths1,830 sq. ft.
2902 Greystone Place, Champaign, IL 61822
MLS# 12601215Listed by: THE REAL ESTATE GROUP,INC 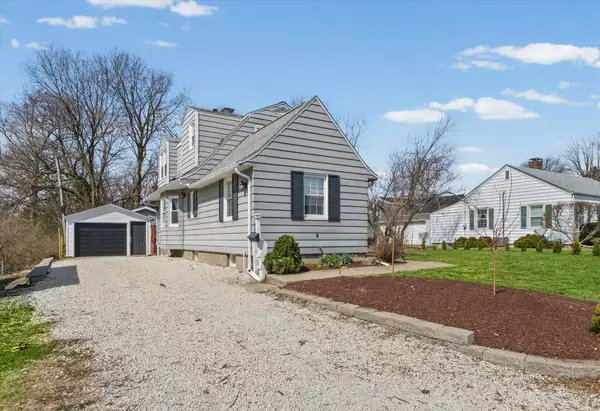 $230,000Pending3 beds 2 baths1,640 sq. ft.
605 S Russell, Champaign, IL 61821
MLS# 12601564Listed by: LANDMARK REAL ESTATE- New
 $769,000Active6 beds 4 baths2,218 sq. ft.
3020 Beringer Circle, Urbana, IL 61802
MLS# 12603647Listed by: CHAMPAIGN COUNTY REALTY - New
 $160,000Active3 beds 1 baths1,025 sq. ft.
2703 Lawndale Drive, Champaign, IL 61821
MLS# 12603651Listed by: JOEL WARD HOMES, INC - New
 $210,000Active4 beds 2 baths1,471 sq. ft.
309 S Coler Avenue, Urbana, IL 61801
MLS# 12603714Listed by: JOEL WARD HOMES, INC  $339,900Pending4 beds 2 baths2,049 sq. ft.
202 W Iowa Street, Urbana, IL 61801
MLS# 12589315Listed by: KELLER WILLIAMS-TREC- New
 $449,000Active5 beds 3 baths2,116 sq. ft.
110 S Lombard Street, Mahomet, IL 61853
MLS# 12603362Listed by: TAYLOR REALTY ASSOCIATES - New
 $370,000Active2 beds 1 baths780 sq. ft.
911 N Elm Street, Champaign, IL 61820
MLS# 12603534Listed by: JOEL WARD HOMES, INC - New
 $129,000Active3 beds 1 baths1,065 sq. ft.
1307 Hedge Road, Champaign, IL 61821
MLS# 12599113Listed by: RYAN DALLAS REAL ESTATE  $249,900Pending3 beds 2 baths1,560 sq. ft.
207 Timberview Drive, Mahomet, IL 61853
MLS# 12599188Listed by: KELLER WILLIAMS-TREC- New
 $240,000Active4 beds 2 baths1,647 sq. ft.
1608 W Springfield, Champaign, IL 61821
MLS# 12586103Listed by: KELLER WILLIAMS-TREC - New
 $225,000Active4 beds 2 baths
1805-1807 Jeanne Street, Champaign, IL 61821
MLS# 12602801Listed by: JOEL WARD HOMES, INC - New
 $190,000Active3 beds 3 baths1,140 sq. ft.
3836 Balmoral Drive #3836, Champaign, IL 61822
MLS# 12483449Listed by: KELLER WILLIAMS-TREC  $485,000Pending4 beds 3 baths3,440 sq. ft.
2804 Wedgewood Drive, Champaign, IL 61822
MLS# 12592145Listed by: REAL BROKER, LLC- New
 $240,000Active3 beds 2 baths1,071 sq. ft.
708 W High Street, Urbana, IL 61801
MLS# 12602904Listed by: JOEL WARD HOMES, INC  $295,000Pending3 beds 2 baths1,908 sq. ft.
1112 W Park Avenue, Champaign, IL 61821
MLS# 12580337Listed by: COLDWELL BANKER R.E. GROUP- New
 $230,000Active4 beds 2 baths
1210-1212 Julie Drive, Champaign, IL 61821
MLS# 12602711Listed by: JOEL WARD HOMES, INC - New
 $493,000Active5 beds 4 baths3,191 sq. ft.
2208 O Donnell Drive, Champaign, IL 61821
MLS# 12592746Listed by: COLDWELL BANKER R.E. GROUP - New
 $574,900Active3 beds 3 baths3,480 sq. ft.
4010 Clubhouse Drive, Champaign, IL 61822
MLS# 12577661Listed by: KELLER WILLIAMS-TREC  $269,900Pending3 beds 2 baths1,431 sq. ft.
1019 Pheasant Circle, Savoy, IL 61874
MLS# 12585509Listed by: EXP REALTY-MAHOMET- New
 $479,900Active5 beds 3 baths2,632 sq. ft.
402 W Pennsylvania Avenue, Urbana, IL 61801
MLS# 12590915Listed by: KELLER WILLIAMS-TREC - New
 $144,900Active4 beds 2 baths1,585 sq. ft.
1616 Hunter Street, Urbana, IL 61802
MLS# 12595602Listed by: RE/MAX REALTY ASSOCIATES-CHA  $140,000Pending3 beds 2 baths1,446 sq. ft.
2115 Melrose Drive #C, Champaign, IL 61820
MLS# 12600131Listed by: RE/MAX REALTY ASSOCIATES-CHA- New
 $609,900Active5 beds 4 baths2,425 sq. ft.
1206 Willowgrove Lane, Mahomet, IL 61853
MLS# 12602206Listed by: CHAMPAIGN COUNTY REALTY - New
 $425,000Active4 beds 3 baths2,089 sq. ft.
308 Banbury Lane, Savoy, IL 61874
MLS# 12566012Listed by: REAL BROKER, LLC  $239,900Pending3 beds 2 baths1,764 sq. ft.
2113 Sumac Drive, Champaign, IL 61821
MLS# 12596427Listed by: KELLER WILLIAMS-TREC- New
 $295,000Active3 beds 2 baths1,661 sq. ft.
1613 Broadmoor Drive, Champaign, IL 61821
MLS# 12588780Listed by: KELLER WILLIAMS-TREC  $225,000Pending2 beds 2 baths957 sq. ft.
317 S Draper Avenue, Champaign, IL 61821
MLS# 12592079Listed by: KELLER WILLIAMS-TREC- New$385,000Active4 beds 3 baths2,218 sq. ft.
2501 Cherry Hills Drive, Champaign, IL 61822
MLS# 12601510Listed by: TAYLOR REALTY ASSOCIATES  $300,000Pending3 beds 2 baths1,794 sq. ft.
3906 Rockdale Drive, Champaign, IL 61822
MLS# 12557428Listed by: KELLER WILLIAMS-TREC $350,000Pending3 beds 2 baths1,717 sq. ft.
3301 S Prospect Avenue, Champaign, IL 61822
MLS# 12591624Listed by: KELLER WILLIAMS-TREC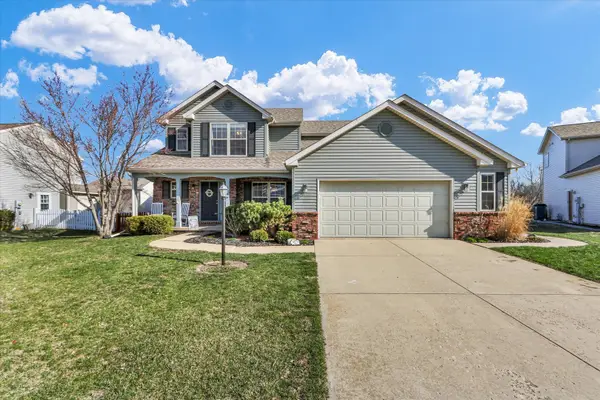 $405,000Pending4 beds 4 baths2,026 sq. ft.
2506 Crimson Lane, Champaign, IL 61822
MLS# 12600728Listed by: KELLER WILLIAMS-TREC- New
 $409,900Active4 beds 4 baths2,138 sq. ft.
1709 E Horizon Lane, Urbana, IL 61802
MLS# 12597154Listed by: COLDWELL BANKER R.E. GROUP - New
 $409,900Active4 beds 2 baths1,890 sq. ft.
1921 S Stone Creek Boulevard, Urbana, IL 61802
MLS# 12601696Listed by: KELLER WILLIAMS-TREC 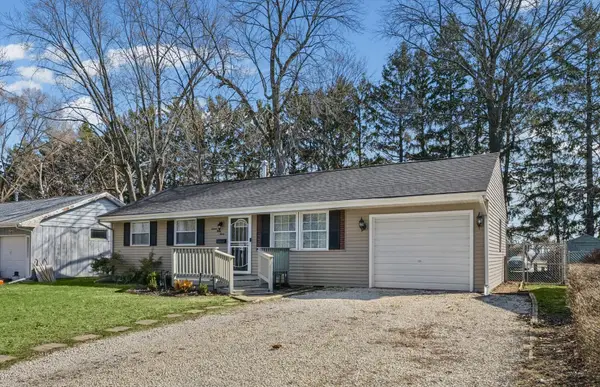 $140,000Pending4 beds 1 baths1,034 sq. ft.
1637 Harper Drive, Rantoul, IL 61866
MLS# 12593232Listed by: PATHWAY REALTY, PLLC $615,000Pending4 beds 3 baths1,936 sq. ft.
1850 Maynard Drive, Champaign, IL 61822
MLS# 12588394Listed by: RE/MAX REALTY ASSOCIATES-CHA- New
 $569,900Active5 beds 3 baths2,816 sq. ft.
1189 County Road 200 E Road, Seymour, IL 61875
MLS# 12601825Listed by: REALTY SELECT ONE  $114,900Pending4 beds 2 baths1,414 sq. ft.
709 W Park Street, Thomasboro, IL 61878
MLS# 12600434Listed by: THE REAL ESTATE GROUP,INC $139,900Pending3 beds 2 baths1,152 sq. ft.
401 N Jackson Street, Philo, IL 61864
MLS# 12601500Listed by: KELLER WILLIAMS-TREC- New
 $420,000Active4 beds 3 baths2,092 sq. ft.
701 Hamilton Drive, Champaign, IL 61820
MLS# 12597057Listed by: RE/MAX REALTY ASSOCIATES-CHA - New
 $125,000Active3 beds 1 baths864 sq. ft.
1206 N Lincoln Avenue, Urbana, IL 61801
MLS# 12601313Listed by: JOEL WARD HOMES, INC - New
 $250,000Active3 beds 2 baths1,850 sq. ft.
510 Parker Place, Rantoul, IL 61866
MLS# 12577581Listed by: RE/MAX REALTY ASSOCIATES-CHA - New
 $449,900Active2 beds 2 baths1,782 sq. ft.
301 N Neil Street #608, Champaign, IL 61820
MLS# 12577636Listed by: KELLER WILLIAMS-TREC  $289,000Pending3 beds 2 baths1,482 sq. ft.
3207 Stanley Lane, Champaign, IL 61822
MLS# 12588853Listed by: KELLER WILLIAMS-TREC $214,900Pending4 beds 1 baths1,295 sq. ft.
910 S Lynn Street, Urbana, IL 61801
MLS# 12593813Listed by: EXP REALTY-MAHOMET- New
 $525,900Active4 beds 3 baths3,191 sq. ft.
1902 Golf Drive, Mahomet, IL 61853
MLS# 12600734Listed by: COLDWELL BANKER R.E. GROUP - New
 $285,000Active2 beds 2 baths1,712 sq. ft.
1502 Theodore Drive #B, Champaign, IL 61821
MLS# 12581873Listed by: JOEL WARD HOMES, INC - New
 $1,049,000Active4 beds 4 baths3,686 sq. ft.
812 Dodds Drive, Champaign, IL 61820
MLS# 12601083Listed by: REALTY SELECT ONE - New
 $245,000Active3 beds 2 baths1,799 sq. ft.
16 N Locust Street, Pesotum, IL 61863
MLS# 12519548Listed by: TOTAL REALTY - New
 $615,000Active5 beds 4 baths2,526 sq. ft.
1207 Briarwood Lane, Mahomet, IL 61853
MLS# 12590213Listed by: KELLER WILLIAMS-TREC  $274,900Pending3 beds 2 baths1,734 sq. ft.
809 W John Street, Champaign, IL 61820
MLS# 12592650Listed by: KELLER WILLIAMS-TREC $165,000Pending3 beds 1 baths1,073 sq. ft.
1902 Garden Hills Drive, Champaign, IL 61821
MLS# 12592679Listed by: KELLER WILLIAMS-TREC- New
 $140,000Active4 beds 4 baths
108 W Vine Street, Champaign, IL 61820
MLS# 12600780Listed by: EJC REAL ESTATE SERVICES - New
 $1,299,900Active5 beds 5 baths3,859 sq. ft.
604 Cayman Way, Savoy, IL 61874
MLS# 12600447Listed by: KELLER WILLIAMS-TREC  $229,900Pending4 beds 3 baths1,370 sq. ft.
1404 Bluegrass Lane, Champaign, IL 61822
MLS# 12597376Listed by: THE REAL ESTATE GROUP,INC- New
 $200,000Active4 beds 2 baths
607 S Glover Avenue, Urbana, IL 61802
MLS# 12600071Listed by: COLDWELL BANKER R.E. GROUP - New
 $270,000Active4 beds 2 baths1,550 sq. ft.
706 W High Street, Urbana, IL 61801
MLS# 12600159Listed by: JOEL WARD HOMES, INC - New
 $609,900Active5 beds 4 baths2,420 sq. ft.
1205 Willowgrove Lane, Mahomet, IL 61853
MLS# 12600321Listed by: TAYLOR REALTY ASSOCIATES  $269,900Pending2 beds 2 baths1,299 sq. ft.
1703 Timber Wolf Lane #C, Mahomet, IL 61853
MLS# 12600173Listed by: TAYLOR REALTY ASSOCIATES- Open Thu, 4 to 6pmNew
 $649,900Active5 beds 4 baths2,530 sq. ft.
1213 Briarwood Lane, Mahomet, IL 61853
MLS# 12600044Listed by: TAYLOR REALTY ASSOCIATES  $259,990Pending3 beds 2 baths2,047 sq. ft.
1421 Cambridge Drive, Champaign, IL 61821
MLS# 12592036Listed by: EXP REALTY-MAHOMET- New
 $200,000Active4 beds 2 baths
Address Withheld By Seller, Urbana, IL 61802
MLS# 12599990Listed by: COLDWELL BANKER R.E. GROUP - New
 $270,000Active4 beds 2 baths1,694 sq. ft.
702 W High Street, Urbana, IL 61801
MLS# 12600052Listed by: JOEL WARD HOMES, INC - New
 $85,000Active0.24 Acres
1215 Briarwood Lane, Mahomet, IL 61853
MLS# 12600101Listed by: TAYLOR REALTY ASSOCIATES - New
 $115,000Active0 Acres
2814 Castlerock Drive, Urbana, IL 61802
MLS# 12594117Listed by: KELLER WILLIAMS-TREC  $185,000Pending2 beds 2 baths1,248 sq. ft.
3335 County Road 300 E, Foosland, IL 61845
MLS# 12591478Listed by: COLDWELL BANKER R.E. GROUP- New
 $509,900Active4 beds 3 baths2,413 sq. ft.
1808 Blue Bird Drive, Mahomet, IL 61853
MLS# 12591610Listed by: TAYLOR REALTY ASSOCIATES - New
 $259,900Active3 beds 2 baths1,950 sq. ft.
5 Truman Court, Philo, IL 61864
MLS# 12593729Listed by: COLDWELL BANKER R.E. GROUP - New
 $479,000Active4 beds 3 baths2,570 sq. ft.
2308 Grange Drive, Urbana, IL 61801
MLS# 12588043Listed by: KELLER WILLIAMS-TREC  $254,900Pending3 beds 2 baths1,950 sq. ft.
Address Withheld By Seller, Champaign, IL 61822
MLS# 12442151Listed by: LIVE REAL ESTATE GROUP $489,900Pending3 beds 3 baths2,182 sq. ft.
1506 Woodfield Drive, Mahomet, IL 61853
MLS# 12588007Listed by: RE/MAX REALTY ASSOCIATES-MAHOM- New
 $199,000Active4 beds 4 baths1,547 sq. ft.
Address Withheld By Seller, Urbana, IL 61801
MLS# 12598986Listed by: KELLER WILLIAMS-TREC - New
 $519,900Active5 beds 4 baths3,006 sq. ft.
1818 Benodot Street, Champaign, IL 61822
MLS# 12598178Listed by: KELLER WILLIAMS-TREC  $345,000Pending3 beds 2 baths1,683 sq. ft.
447 County Road 2500 N, Mahomet, IL 61853
MLS# 12591855Listed by: TAYLOR REALTY ASSOCIATES $185,000Pending3 beds 1 baths1,337 sq. ft.
1515 S Curtiss Drive, Urbana, IL 61802
MLS# 12591054Listed by: COLDWELL BANKER R.E. GROUP $365,000Pending3 beds 2 baths1,703 sq. ft.
1120 W Charles Street, Champaign, IL 61821
MLS# 12587766Listed by: REAL BROKER, LLC $117,500Active1 Acres
Lot 9 Raintree Woods Drive, Urbana, IL 61802
MLS# 12597863Listed by: RE/MAX REALTY ASSOCIATES-CHA $164,900Active3 beds 2 baths1,438 sq. ft.
803 Irvine Road #803, Champaign, IL 61822
MLS# 12591660Listed by: RYAN DALLAS REAL ESTATE $194,900Active4 beds 1 baths1,200 sq. ft.
3102 W John Street, Champaign, IL 61821
MLS# 12595445Listed by: HOMECOIN.COM $299,900Active3 beds 2 baths1,777 sq. ft.
597 Cr 100 E, Ivesdale, IL 61851
MLS# 12597293Listed by: FARM & LAKE HOUSES REAL ESTATE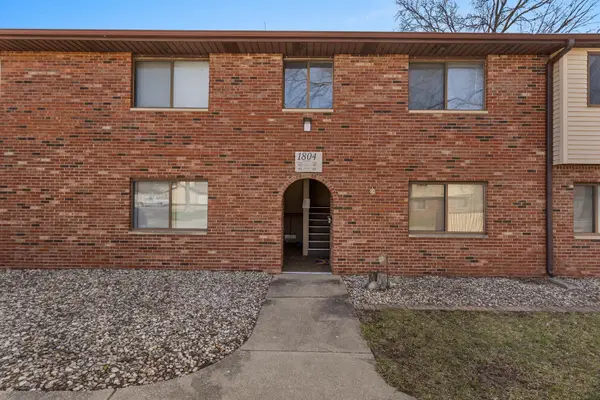 $110,000Pending2 beds 2 baths970 sq. ft.
1804 Oliver Drive #6, Urbana, IL 61802
MLS# 12591592Listed by: KELLER WILLIAMS-TREC $274,900Active3 beds 2 baths1,680 sq. ft.
509 Crestwood Drive, Champaign, IL 61822
MLS# 12591596Listed by: REALTY SELECT ONE $159,900Active3 beds 2 baths1,349 sq. ft.
Address Withheld By Seller, Urbana, IL 61802
MLS# 12591625Listed by: REAL BROKER, LLC $162,500Pending2 beds 1 baths940 sq. ft.
2130 Ivy Court, Champaign, IL 61821
MLS# 12596174Listed by: KELLER WILLIAMS-TREC $159,900Pending3 beds 1 baths1,300 sq. ft.
216 N Locust Street, Ludlow, IL 60949
MLS# 12595908Listed by: KELLER WILLIAMS-TREC $34,900Pending1 beds 1 baths700 sq. ft.
912 Crescent Drive #2-2, Champaign, IL 61821
MLS# 12596741Listed by: THE REAL ESTATE GROUP,INC $309,900Active3 beds 2 baths1,617 sq. ft.
3920 Trailway Drive, Champaign, IL 61822
MLS# 12590715Listed by: THE REAL ESTATE GROUP,INC $349,900Pending4 beds 3 baths1,942 sq. ft.
3909 Slate Drive, Champaign, IL 61822
MLS# 12596302Listed by: RE/MAX REALTY ASSOCIATES-CHA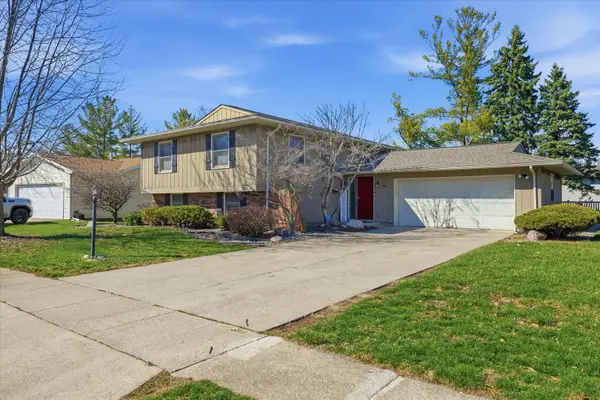 $284,900Pending5 beds 2 baths2,403 sq. ft.
506 E Scovill Street, Urbana, IL 61801
MLS# 12585203Listed by: HEARTLAND REAL ESTATE OF CENTRAL ILLINOIS, INC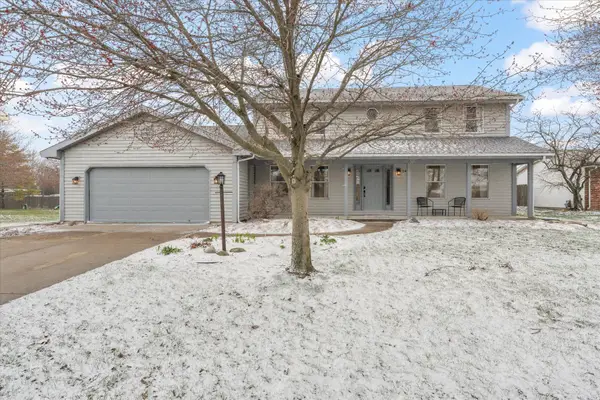 $357,000Pending4 beds 3 baths2,594 sq. ft.
2406 Cherry Hills Drive, Champaign, IL 61822
MLS# 12589577Listed by: TAYLOR REALTY ASSOCIATES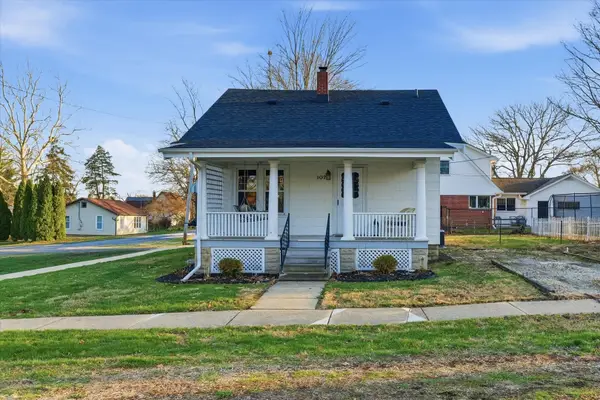 $229,000Pending3 beds 2 baths1,423 sq. ft.
107 E Dunbar Street, Mahomet, IL 61853
MLS# 12594209Listed by: EXP REALTY-MAHOMET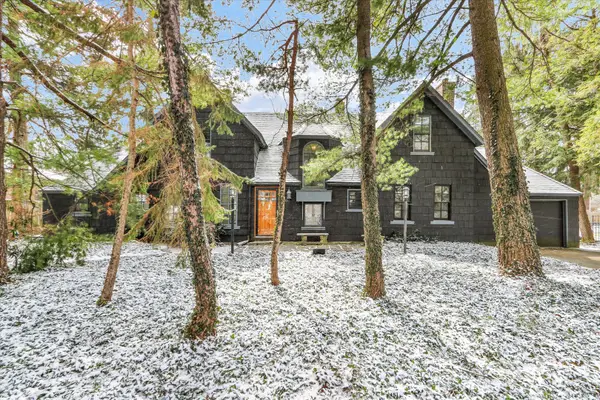 $295,000Pending4 beds 2 baths2,641 sq. ft.
1003 W Church Street, Champaign, IL 61821
MLS# 12581141Listed by: KELLER WILLIAMS-TREC $247,900Pending3 beds 2 baths1,357 sq. ft.
2110 E Pennsylvania Avenue, Urbana, IL 61802
MLS# 12578098Listed by: KELLER WILLIAMS-TREC $214,900Pending3 beds 2 baths1,742 sq. ft.
1015 Hollycrest Drive, Champaign, IL 61821
MLS# 12544290Listed by: LIVE REAL ESTATE GROUP $464,900Pending4 beds 3 baths2,019 sq. ft.
3315 Palmer Drive, Champaign, IL 61822
MLS# 12595811Listed by: CHAMPAIGN COUNTY REALTY $175,000Pending3 beds 1 baths1,542 sq. ft.
1419 Cambridge Drive, Champaign, IL 61821
MLS# 12585772Listed by: EXP REALTY-MAHOMET $425,000Active4 beds 3 baths1,909 sq. ft.
2008 Rylan Road, Mahomet, IL 61853
MLS# 12586272Listed by: RE/MAX REALTY ASSOCIATES-CHA $324,900Pending4 beds 3 baths2,528 sq. ft.
2501 Bedford Drive, Champaign, IL 61820
MLS# 12587713Listed by: KELLER WILLIAMS-TREC $275,000Pending3 beds 2 baths1,298 sq. ft.
2317 Brookshire Drive E, Champaign, IL 61821
MLS# 12583970Listed by: REAL BROKER, LLC $230,000Pending4 beds 3 baths1,930 sq. ft.
617 W 4th Street, Homer, IL 61849
MLS# 12591917Listed by: TAYLOR REALTY ASSOCIATES $339,900Pending4 beds 3 baths1,883 sq. ft.
1718 Tin Cup Road, Mahomet, IL 61853
MLS# 12590575Listed by: TAYLOR REALTY ASSOCIATES $649,900Active4 beds 3 baths3,045 sq. ft.
1306 Roberto Road, Mahomet, IL 61853
MLS# 12569096Listed by: EXP REALTY, LLC - MAHOMET BRANCH $225,000Pending3 beds 2 baths1,120 sq. ft.
506 S Sunny Lane, Urbana, IL 61802
MLS# 12587077Listed by: THE REAL ESTATE GROUP,INC $99,000Pending1 Acres
0 Highcross Road, Urbana, IL 61802
MLS# 12594593Listed by: RE/MAX REALTY ASSOCIATES-CHA $399,900Pending3 beds 2 baths1,875 sq. ft.
105 S Division Street, Mahomet, IL 61853
MLS# 12582458Listed by: COLDWELL BANKER R.E. GROUP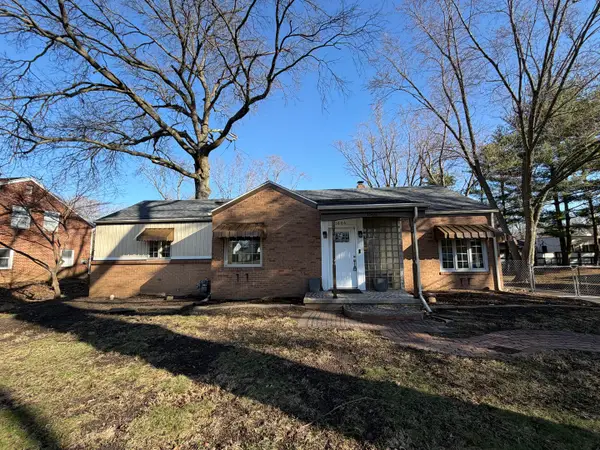 $233,900Pending3 beds 2 baths1,550 sq. ft.
1606 W Union Street, Champaign, IL 61821
MLS# 12588392Listed by: RYAN DALLAS REAL ESTATE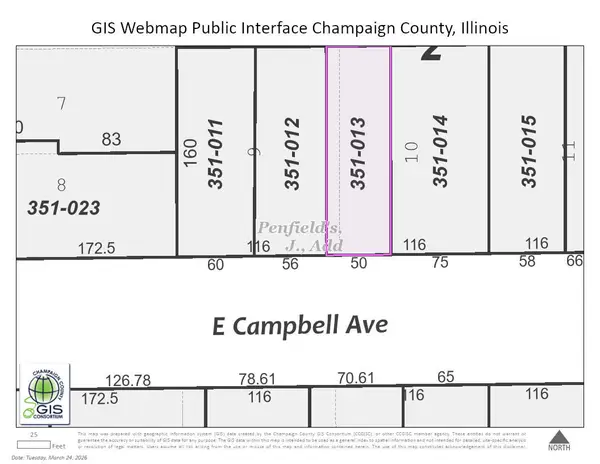 $49,500Active0 Acres
325 E Campbell Avenue, Rantoul, IL 61866
MLS# 12590748Listed by: REALTY SELECT ONE $439,000Pending4 beds 3 baths3,166 sq. ft.
4007 Turnberry Drive, Champaign, IL 61822
MLS# 12530116Listed by: COLDWELL BANKER R.E. GROUP $174,900Pending3 beds 1 baths939 sq. ft.
2504 Hathaway Drive, Champaign, IL 61821
MLS# 12588042Listed by: AROUNDCU REAL ESTATE COMPANY $439,900Pending4 beds 4 baths3,027 sq. ft.
506 Van Buren Street, Savoy, IL 61874
MLS# 12573603Listed by: KELLER WILLIAMS-TREC $284,900Pending4 beds 2 baths2,186 sq. ft.
1009 W Church Street, Champaign, IL 61821
MLS# 12579920Listed by: WARD & ASSOCIATES $660,000Pending4 beds 4 baths1,857 sq. ft.
1310 White Oak Road, Mahomet, IL 61853
MLS# 12580768Listed by: TAYLOR REALTY ASSOCIATES $245,000Pending4 beds 3 baths2,513 sq. ft.
1412 W Clark Street, Champaign, IL 61821
MLS# 12590686Listed by: TAYLOR REALTY ASSOCIATES $189,000Pending4 beds 2 baths2,573 sq. ft.
3207 E Airport Road, Urbana, IL 61802
MLS# 12589276Listed by: RE/MAX REALTY ASSOCIATES-CHA $155,000Pending3 beds 1 baths1,080 sq. ft.
1502 Powers Lane, Champaign, IL 61821
MLS# 12589065Listed by: REAL BROKER, LLC $22,000Active0.29 Acres
107 Sheridan Street, Longview, IL 61852
MLS# 12591787Listed by: KELLER WILLIAMS-TREC $199,900Active3 beds 1 baths1,425 sq. ft.
2210 Fogel Road, Mahomet, IL 61853
MLS# 12567392Listed by: EXP REALTY-MAHOMET $499,900Active4 beds 4 baths3,750 sq. ft.
205 Potomac Avenue, Savoy, IL 61874
MLS# 12570565Listed by: BHHS CENTRAL ILLINOIS, REALTORS $399,900Active3 beds 3 baths1,970 sq. ft.
1411 Warwick Drive, Savoy, IL 61874
MLS# 12591393Listed by: KELLER WILLIAMS-TREC $109,900Active2 beds 1 baths745 sq. ft.
1502 Delmont Court #1, Urbana, IL 61801
MLS# 12584443Listed by: TAYLOR REALTY ASSOCIATES $28,000Active3 beds 2 baths1,200 sq. ft.
1205 Wedgewood Drive, Rantoul, IL 61866
MLS# 12591925Listed by: KELLER WILLIAMS-TREC $190,000Pending2 beds 2 baths1,069 sq. ft.
409 Luria Lane, Champaign, IL 61822
MLS# 12584596Listed by: KELLER WILLIAMS-TREC $189,000Pending3 beds 2 baths1,253 sq. ft.
1303 Greenridge Drive, Urbana, IL 61802
MLS# 12586644Listed by: KELLER WILLIAMS-TREC $205,000Pending3 beds 3 baths2,011 sq. ft.
1813 Willow View Road, Urbana, IL 61802
MLS# 12587528Listed by: KELLER WILLIAMS-TREC $82,900Active3 beds 2 baths
1867 Liberty Avenue, Urbana, IL 61802
MLS# 12581927Listed by: RYAN DALLAS REAL ESTATE $390,000Pending4 beds 3 baths1,770 sq. ft.
1408 E Heather Drive, Mahomet, IL 61853
MLS# 12583446Listed by: RE/MAX REALTY ASSOCIATES-CHA $330,000Active3 beds 2 baths1,684 sq. ft.
1202 Edgeview Drive, Mahomet, IL 61853
MLS# 12589782Listed by: GREEN STREET REALTY $1,080,000Active6 beds 5 baths3,152 sq. ft.
2709 Castlerock Drive, Urbana, IL 61802
MLS# 12589845Listed by: KELLER WILLIAMS-TREC $155,000Active2 beds 1 baths906 sq. ft.
1212 E Pennsylvania Avenue, Urbana, IL 61801
MLS# 12590932Listed by: CIRCLE ONE REALTY $535,000Active5 beds 4 baths2,381 sq. ft.
1403 Winterberry Road, Savoy, IL 61874
MLS# 12579400Listed by: KELLER WILLIAMS-TREC $525,000Active4 beds 4 baths2,687 sq. ft.
2010 Strand Drive, Champaign, IL 61822
MLS# 12567194Listed by: EXP REALTY-MAHOMET $279,900Pending4 beds 2 baths1,528 sq. ft.
1710 Magnolia Drive, St. Joseph, IL 61873
MLS# 12585427Listed by: EXP REALTY-MAHOMET $615,000Pending5 beds 4 baths2,232 sq. ft.
1306 Ravenwood Drive, Mahomet, IL 61853
MLS# 12589945Listed by: EXP REALTY-CHAMPAIGN $129,900Pending3 beds 3 baths1,402 sq. ft.
1320 Brighton Drive, Urbana, IL 61801
MLS# 12573945Listed by: TRAUTMAN REAL ESTATE AGENCY & APPRAISAL LLC $171,000Pending3 beds 3 baths1,400 sq. ft.
1905 N Lincoln Avenue #202, Urbana, IL 61801
MLS# 12588613Listed by: COLDWELL BANKER R.E. GROUP $244,900Active4 beds 2 baths1,650 sq. ft.
1813 Winchester Drive, Champaign, IL 61821
MLS# 12589953Listed by: LIVE REAL ESTATE GROUP $269,900Pending3 beds 3 baths1,870 sq. ft.
2608 Rachel Road, Champaign, IL 61822
MLS# 12570376Listed by: TAYLOR REALTY ASSOCIATES $229,900Pending3 beds 2 baths1,802 sq. ft.
1103 Brighton Drive, Urbana, IL 61801
MLS# 12581478Listed by: KELLER WILLIAMS-TREC $260,000Pending3 beds 2 baths1,253 sq. ft.
706 Northgate Drive, St. Joseph, IL 61873
MLS# 12589375Listed by: TAYLOR REALTY ASSOCIATES $199,900Active2 beds 2 baths1,200 sq. ft.
2404 Windward Boulevard #201, Champaign, IL 61821
MLS# 12584571Listed by: RYAN DALLAS REAL ESTATE $61,900Pending3 beds 3 baths1,366 sq. ft.
412 Louisiana Avenue, Champaign, IL 61820
MLS# 12561895Listed by: REALHOME SERVICES & SOLUTIONS, INC. $175,000Active2 beds 2 baths1,215 sq. ft.
2159 Harbortown Circle #2159, Champaign, IL 61821
MLS# 12588460Listed by: JOEL WARD HOMES, INC $695,000Active4 beds 4 baths3,904 sq. ft.
1303 Hickory Tree Court, Mahomet, IL 61853
MLS# 12586953Listed by: TAYLOR REALTY ASSOCIATES $168,000Active3 beds 1 baths1,095 sq. ft.
2704 W Kirby Avenue, Champaign, IL 61821
MLS# 12588393Listed by: TAYLOR REALTY ASSOCIATES $159,900Active3 beds 2 baths1,429 sq. ft.
1014 Illinois Drive, Rantoul, IL 61866
MLS# 12579298Listed by: RYAN DALLAS REAL ESTATE $299,900Active3 beds 2 baths1,361 sq. ft.
Address Withheld By Seller, Savoy, IL 61874
MLS# 12574738Listed by: RE/MAX REALTY ASSOCIATES-CHA $519,900Active5 beds 5 baths3,269 sq. ft.
2504 Lakewood Drive, Champaign, IL 61822
MLS# 12579305Listed by: KELLER WILLIAMS-TREC $535,000Pending5 beds 5 baths3,449 sq. ft.
809 Ayrshire Drive, Champaign, IL 61820
MLS# 12572911Listed by: REALTY SELECT ONE $185,000Pending3 beds 2 baths1,310 sq. ft.
1203 Julie Drive, Champaign, IL 61821
MLS# 12578124Listed by: COLDWELL BANKER R.E. GROUP $319,900Pending4 beds 3 baths1,567 sq. ft.
722 S Lynn Street, Champaign, IL 61820
MLS# 12475733Listed by: KELLER WILLIAMS-TREC $305,000Active2 beds 2 baths1,921 sq. ft.
5 E Columbia Avenue #5, Champaign, IL 61820
MLS# 12494038Listed by: RE/MAX REALTY ASSOCIATES-CHA $199,000Pending4 beds 4 baths1,482 sq. ft.
Address Withheld By Seller, Urbana, IL 61801
MLS# 12584051Listed by: KELLER WILLIAMS-TREC $367,000Pending4 beds 3 baths2,683 sq. ft.
2104 Morningview Place, Champaign, IL 61822
MLS# 12575872Listed by: COLDWELL BANKER R.E. GROUP $394,900Pending3 beds 3 baths1,983 sq. ft.
3217 Palmer Drive, Champaign, IL 61822
MLS# 12581844Listed by: LIVE REAL ESTATE GROUP $325,000Pending4 beds 2 baths1,834 sq. ft.
1211 W Park Avenue, Champaign, IL 61821
MLS# 12574759Listed by: COLDWELL BANKER R.E. GROUP $210,000Pending3 beds 2 baths1,282 sq. ft.
209 W Strong Street, Tolono, IL 61880
MLS# 12572788Listed by: COLDWELL BANKER R.E. GROUP $249,900Pending4 beds 2 baths2,386 sq. ft.
1797 CR 3500 N Road, Ludlow, IL 60949
MLS# 12569612Listed by: TOWN & COUNTRY REALTY,LLP $230,000Pending4 beds 2 baths1,767 sq. ft.
2812 Alton Drive, Champaign, IL 61821
MLS# 12564093Listed by: REALTY SELECT ONE $389,900Active3 beds 2 baths1,850 sq. ft.
602 N Beacon Hill Circle, Urbana, IL 61802
MLS# 12585224Listed by: BERINGER REALTY $495,000Pending4 beds 4 baths2,340 sq. ft.
412 Potomac Avenue, Savoy, IL 61874
MLS# 12573930Listed by: KELLER WILLIAMS-TREC $285,000Pending2 beds 2 baths1,845 sq. ft.
2748 J T Coffman Drive, Champaign, IL 61822
MLS# 12569956Listed by: KELLER WILLIAMS-TREC $279,900Pending4 beds 2 baths2,288 sq. ft.
2205 Southmoor Drive, Champaign, IL 61821
MLS# 12581754Listed by: COLDWELL BANKER R.E. GROUP $210,000Pending3 beds 3 baths1,475 sq. ft.
1713 Harbor Point Drive #B, Champaign, IL 61821
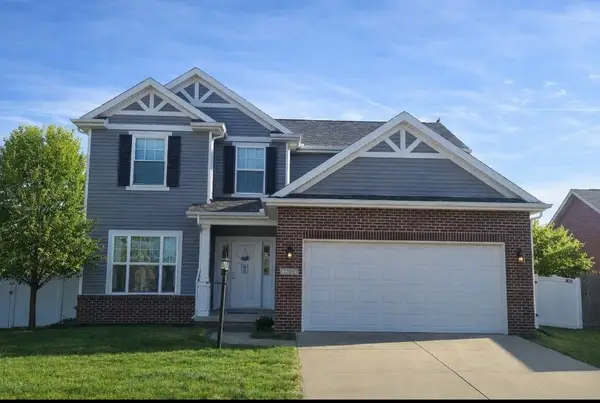
MLS# 12571745Listed by: COLDWELL BANKER R.E. GROUP $399,900Active3 beds 2 baths1,889 sq. ft.
1917 S Stone Creek Boulevard, Urbana, IL 61802
MLS# 12583130Listed by: KELLER WILLIAMS-TREC $700,000Active5 beds 3 baths2,298 sq. ft.
606 N Beacon Hill Circle, Urbana, IL 61802
MLS# 12572775Listed by: COLDWELL BANKER R.E. GROUP $575,000Active5 beds 4 baths2,642 sq. ft.
1208 White Oak Road, Mahomet, IL 61853
MLS# 12575469Listed by: EXP REALTY-CHAMPAIGN $126,900Active2 beds 1 baths807 sq. ft.
804 Juniper Drive, Rantoul, IL 61866
MLS# 12583004Listed by: TOWN & COUNTRY REALTY,LLP $475,000Active1.06 Acres
905 W Killarney Street, Urbana, IL 61801
MLS# 12584258Listed by: KELLER WILLIAMS-TREC $99,000Pending3 beds 2 baths1,425 sq. ft.
1208 W Church Street, Urbana, IL 61801
MLS# 12575823Listed by: RYAN DALLAS REAL ESTATE $399,900Pending4 beds 3 baths1,746 sq. ft.
502 Elk Drive, Mahomet, IL 61853
MLS# 12567216Listed by: EXP REALTY-MAHOMET $277,000Pending3 beds 2 baths1,570 sq. ft.
303 Burkwood Court W, Urbana, IL 61801
MLS# 12580439Listed by: COLDWELL BANKER R.E. GROUP $449,900Active4 beds 3 baths1,665 sq. ft.
312 London Way, Savoy, IL 61874
MLS# 12543592Listed by: KELLER WILLIAMS-TREC $225,000Pending3 beds 2 baths1,508 sq. ft.
2101 E Pennsylvania Avenue, Urbana, IL 61802
MLS# 12554263Listed by: COLDWELL BANKER R.E. GROUP $545,000Pending5 beds 4 baths2,521 sq. ft.
707 W Main Street, Urbana, IL 61801
MLS# 12529872Listed by: COLDWELL BANKER R.E. GROUP $425,000Pending4 beds 3 baths2,464 sq. ft.
209 W California Avenue, Urbana, IL 61801
MLS# 12543851Listed by: COLDWELL BANKER R.E. GROUP $349,900Pending4 beds 3 baths2,758 sq. ft.
1914 Trout Valley Drive, Champaign, IL 61822
MLS# 12572476Listed by: KELLER WILLIAMS-TREC $243,900Pending3 beds 3 baths1,424 sq. ft.
1317 S Smith Road, Urbana, IL 61802
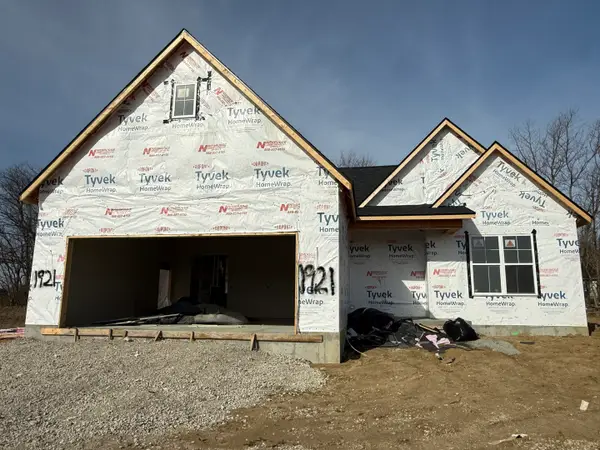
MLS# 12583294Listed by: TAYLOR REALTY ASSOCIATES $399,900Active3 beds 3 baths1,818 sq. ft.
1913 S Stone Creek Boulevard, Urbana, IL 61802
MLS# 12583101Listed by: KELLER WILLIAMS-TREC $438,850Active4 beds 3 baths2,117 sq. ft.
708 Rapp Drive, Mahomet, IL 61853
MLS# 12583155Listed by: BEYCOME BROKERAGE REALTY LLC $515,000Active4 beds 3 baths3,176 sq. ft.
2904 River Oak Drive, Champaign, IL 61822
MLS# 12555427Listed by: RYAN DALLAS REAL ESTATE $329,900Pending3 beds 2 baths2,037 sq. ft.
409 Park Lane Drive, Champaign, IL 61820
MLS# 12559319Listed by: EXP REALTY-MAHOMET $416,525Active3 beds 2 baths1,638 sq. ft.
707 Cates Drive, Mahomet, IL 61853
MLS# 12583091Listed by: BEYCOME BROKERAGE REALTY LLC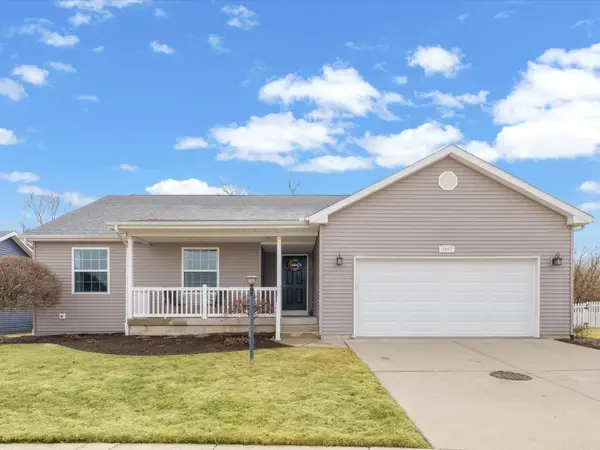 $379,900Active4 beds 3 baths1,588 sq. ft.
2405 N Fairfield Drive, Urbana, IL 61802
MLS# 12554590Listed by: KELLER WILLIAMS-TREC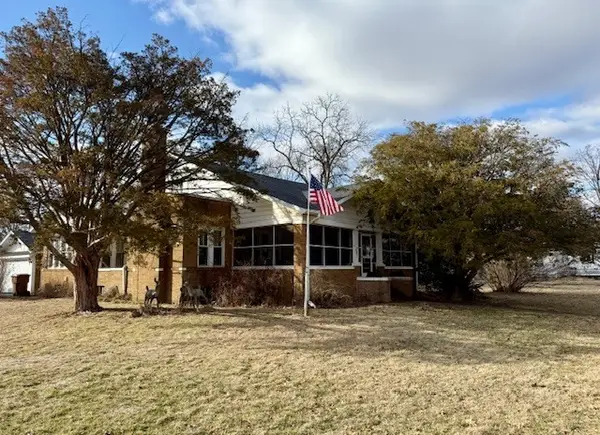 $215,000Pending4 beds 2 baths2,030 sq. ft.
203 S First Street, Fisher, IL 61843
MLS# 12574782Listed by: COLDWELL BANKER R.E. GROUP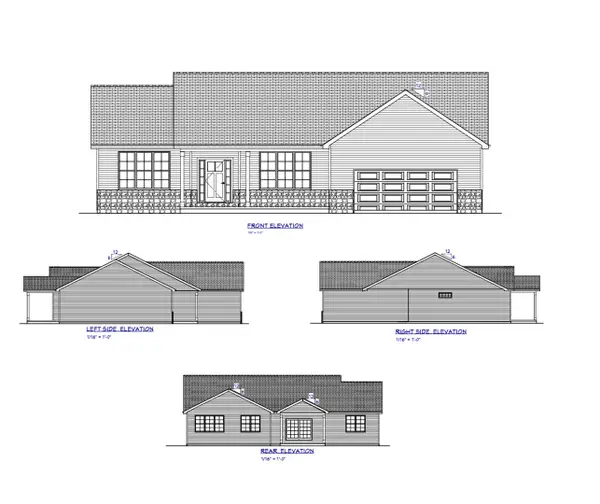 $377,000Pending3 beds 2 baths2,008 sq. ft.
2906 Haydon Drive, Urbana, IL 61802
MLS# 12582521Listed by: KELLER WILLIAMS-TREC $165,000Pending3 beds 1 baths1,072 sq. ft.
902 Oakcrest Drive, Champaign, IL 61821
MLS# 12546204Listed by: COLDWELL BANKER R.E. GROUP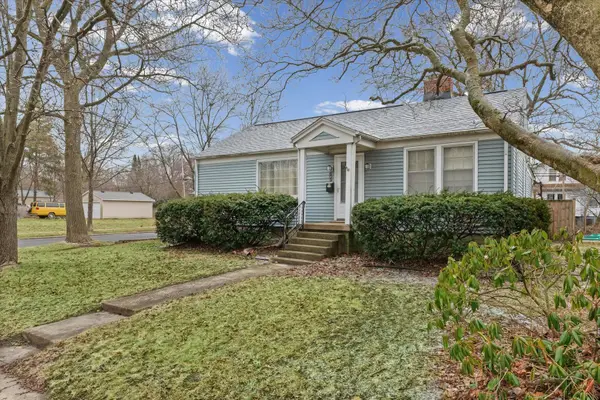 $176,900Pending2 beds 1 baths1,200 sq. ft.
609 E Washington Street, Urbana, IL 61801
MLS# 12580241Listed by: REAL BROKER LLC $349,900Active3 beds 3 baths2,669 sq. ft.
153 Lake Road, Seymour, IL 61875
MLS# 12582459Listed by: LANDMARK REAL ESTATE $545,000Active5 beds 4 baths2,564 sq. ft.
1010 Declaration Drive, Savoy, IL 61874
MLS# 12576363Listed by: COLDWELL BANKER R.E. GROUP $375,000Active4 beds 3 baths2,089 sq. ft.
1906 S Venturi Court, Urbana, IL 61802
MLS# 12581774Listed by: KELLER WILLIAMS-TREC $274,000Pending5 beds 4 baths
1105 E Florida Avenue, Urbana, IL 61801
MLS# 12571768Listed by: THE REAL ESTATE GROUP,INC $190,000Pending3 beds 1 baths1,069 sq. ft.
1304 Ogelthorpe Avenue, Urbana, IL 61802
MLS# 12578566Listed by: COLDWELL BANKER R.E. GROUP $335,000Pending3 beds 2 baths1,418 sq. ft.
606 S Jefferson Street, Mahomet, IL 61853
MLS# 12575229Listed by: KELLER WILLIAMS-TREC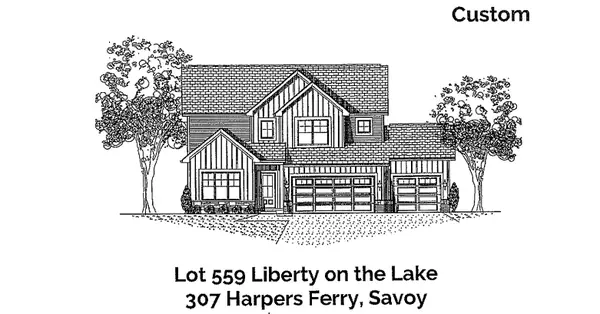 $595,500Pending5 beds 4 baths2,535 sq. ft.
307 Harpers Ferry, Savoy, IL 61874
MLS# 12578369Listed by: REALTY SELECT ONE $384,900Pending9 beds 7 baths
3202 Chatham Drive, Urbana, IL 61802
MLS# 12561618Listed by: KELLER WILLIAMS-TREC $265,000Active4 beds 2 baths1,713 sq. ft.
911 Foley Avenue, Champaign, IL 61820
MLS# 12569699Listed by: EXP REALTY-MAHOMET $375,000Pending4 beds 3 baths2,388 sq. ft.
901 Kent Drive, Champaign, IL 61821
MLS# 12525049Listed by: RE/MAX REALTY ASSOCIATES-CHA $125,000Pending3 beds 1 baths993 sq. ft.
2314 1/2 E Main Street, Urbana, IL 61802
MLS# 12548513Listed by: RE/MAX REALTY ASSOCIATES-CHA $675,000Active3 beds 4 baths2,920 sq. ft.
1206 S Prospect Avenue, Champaign, IL 61820
MLS# 12567561Listed by: REALTY SELECT ONE $30,000Active3 beds 2 baths1,850 sq. ft.
303 N Main Street, Seymour, IL 61875
MLS# 12580639Listed by: KELLER WILLIAMS-TREC $515,000Pending3 beds 3 baths2,058 sq. ft.
2149 County Road 900 E, Champaign, IL 61822
MLS# 12551637Listed by: COLDWELL BANKER R.E. GROUP $585,000Pending4 beds 3 baths2,318 sq. ft.
5009 Abbey Fields Drive, Champaign, IL 61822
MLS# 12577092Listed by: KELLER WILLIAMS-TREC $219,000Active4 beds 2 baths2,268 sq. ft.
525 County Road 2400 E, Broadlands, IL 61816
MLS# 12580252Listed by: THE REAL ESTATE GROUP,INC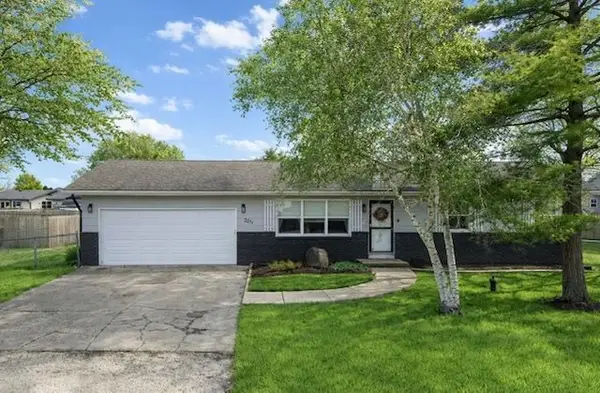 $255,000Pending3 beds 2 baths1,300 sq. ft.
2215 Heather Hills Drive, St Joseph, IL 61873
MLS# 6257345Listed by: CLASSIC HOMES REALTY $345,900Active4 beds 3 baths2,158 sq. ft.
1328 West Ridge Lane, Champaign, IL 61822
MLS# 12554547Listed by: KELLER WILLIAMS-TREC $235,000Pending4 beds 2 baths1,650 sq. ft.
708 Stratford Drive, Champaign, IL 61821
MLS# 12575402Listed by: RE/MAX REALTY ASSOCIATES-CHA $219,900Pending4 beds 1 baths1,236 sq. ft.
221 Augusta Drive, Mahomet, IL 61853
MLS# 12523615Listed by: KELLER WILLIAMS-TREC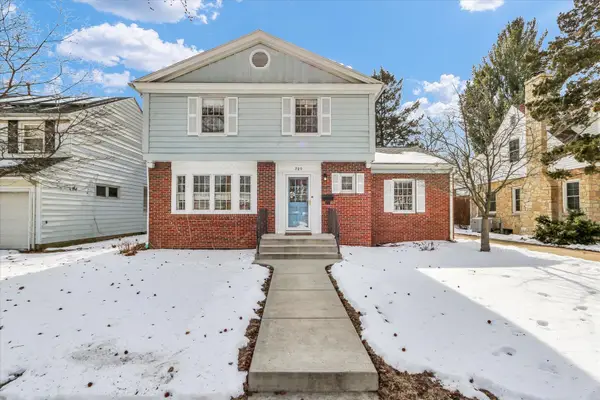 $425,000Pending5 beds 3 baths1,861 sq. ft.
209 W Vermont Avenue, Urbana, IL 61801
MLS# 12551796Listed by: KELLER WILLIAMS-TREC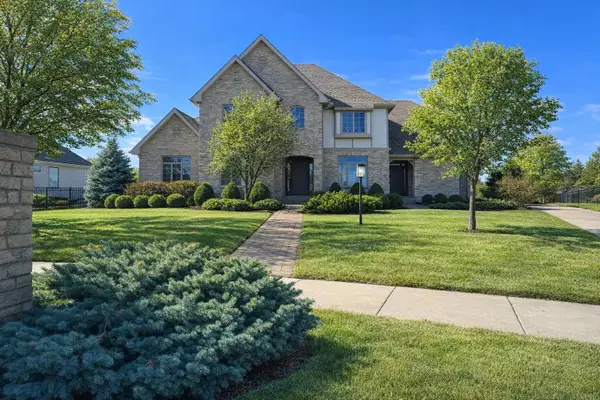 $790,000Active5 beds 4 baths4,054 sq. ft.
2610 Castlerock Drive, Urbana, IL 61802
MLS# 12570955Listed by: COLDWELL BANKER R.E. GROUP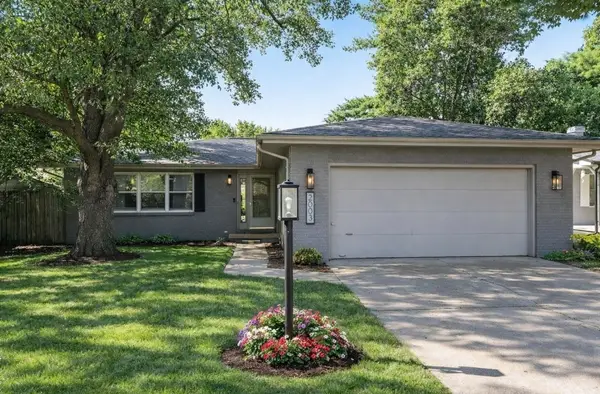 $262,500Pending3 beds 2 baths1,402 sq. ft.
Address Withheld By Seller, Champaign, IL 61821
MLS# 12572666Listed by: COLDWELL BANKER R.E. GROUP $149,000Pending2 beds 1 baths1,020 sq. ft.
1108 Kara Drive #1108, Champaign, IL 61822
MLS# 12577072Listed by: REALTY SELECT ONE- Open Sat, 10am to 12pm
 $474,900Active4 beds 4 baths2,245 sq. ft.
2109 Emerald Drive, Champaign, IL 61822
MLS# 12563296Listed by: KELLER WILLIAMS-TREC  $221,000Pending2 beds 2 baths1,315 sq. ft.
106 Essex Lane #4, Savoy, IL 61874
MLS# 12560356Listed by: THE REAL ESTATE GROUP,INC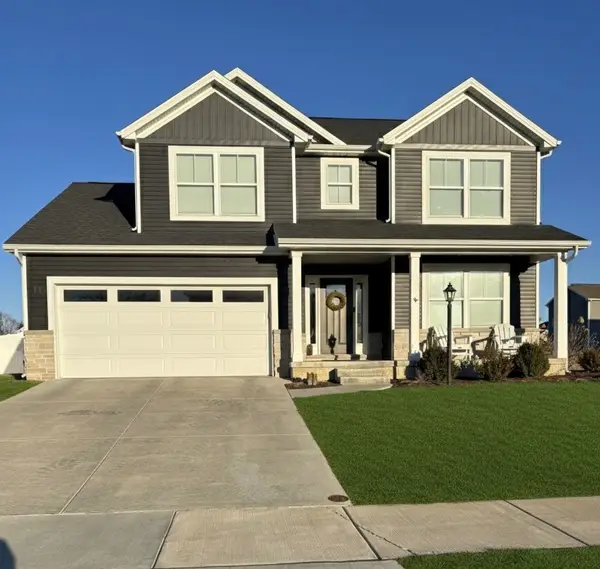 $449,000Active5 beds 4 baths2,205 sq. ft.
718 Cole Lane, Mahomet, IL 61853
MLS# 12575397Listed by: GREEN STREET REALTY $175,000Pending3 beds 2 baths1,352 sq. ft.
909 E Washington Street, Urbana, IL 61801
MLS# 12578839Listed by: KELLER WILLIAMS-TREC $279,900Active3 beds 2 baths1,262 sq. ft.
403 E Larmon Street, Tolono, IL 61880
MLS# 12577945Listed by: KELLER WILLIAMS-TREC $483,000Active5 beds 4 baths2,349 sq. ft.
4011 Tallgrass Drive, Champaign, IL 61822
MLS# 12578330Listed by: KELLER WILLIAMS-TREC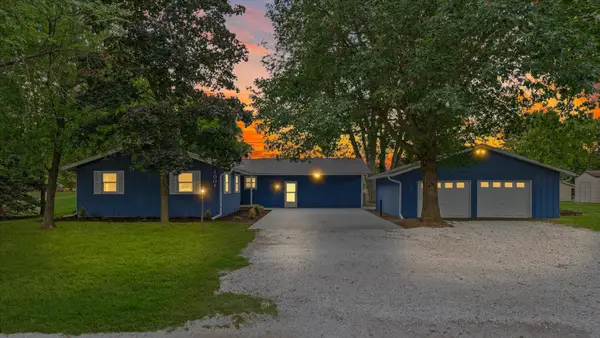 $294,900Active4 beds 3 baths1,801 sq. ft.
1001 W Dianne Lane, Mahomet, IL 61853
MLS# 12578469Listed by: EXP REALTY-MAHOMET $134,900Active3 beds 2 baths883 sq. ft.
36 E Beardsley Avenue, Champaign, IL 61820
MLS# 12562890Listed by: EXP REALTY-MAHOMET $119,900Active2 beds 1 baths883 sq. ft.
38 E Beardsley Avenue, Champaign, IL 61820
MLS# 12563169Listed by: EXP REALTY-MAHOMET $125,000Pending3 beds 1 baths1,521 sq. ft.
1612 Golfview Road, Rantoul, IL 61866
MLS# 12546710Listed by: EXP REALTY-MAHOMET $175,000Pending3 beds 2 baths1,359 sq. ft.
413 Irvine Road #413, Champaign, IL 61822
MLS# 12568467Listed by: REALTY SELECT ONE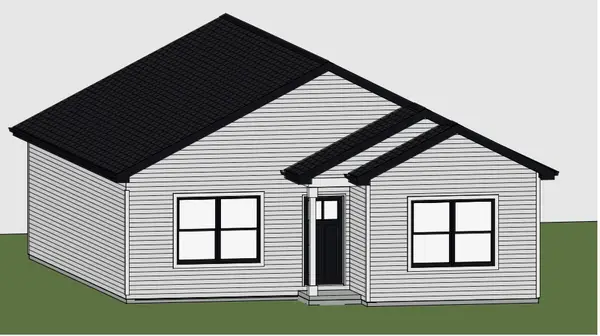 $236,400Active3 beds 2 baths1,253 sq. ft.
1311 S Smith Road, Urbana, IL 61802
MLS# 12578014Listed by: TAYLOR REALTY ASSOCIATES $589,000Active5 beds 3 baths1,779 sq. ft.
3906 Patriot Lane, Champaign, IL 61822
MLS# 12517801Listed by: RE/MAX REALTY ASSOCIATES-CHA $145,000Active3 beds 2 baths1,686 sq. ft.
509 W Morris Street, Thomasboro, IL 61878
MLS# 12577321Listed by: KIEF REALTY $215,000Pending2 beds 2 baths1,249 sq. ft.
406 S Elm Street, Champaign, IL 61820
MLS# 12564239Listed by: KELLER WILLIAMS-TREC $174,900Pending2 beds 3 baths1,297 sq. ft.
3724 Summer Sage Court, Champaign, IL 61822
MLS# 12571600Listed by: KELLER WILLIAMS-TREC $255,000Pending3 beds 2 baths1,628 sq. ft.
716 Devonshire Drive, Champaign, IL 61820
MLS# 12565378Listed by: COLDWELL BANKER R.E. GROUP $224,900Pending3 beds 4 baths1,460 sq. ft.
Address Withheld By Seller, Rantoul, IL 61866
MLS# 12570460Listed by: EXP REALTY-CHAMPAIGN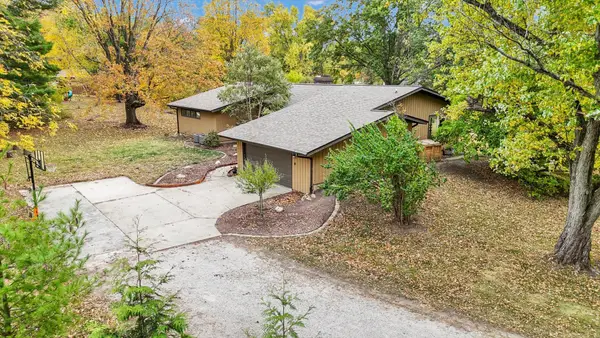 $599,900Active6 beds 3 baths3,810 sq. ft.
1010 Parkview Drive, Mahomet, IL 61853
MLS# 12577339Listed by: KELLER WILLIAMS-TREC $169,900Active3 beds 1 baths1,300 sq. ft.
Address Withheld By Seller, Champaign, IL 61821
MLS# 12546378Listed by: LIVE REAL ESTATE GROUP $534,900Active4 beds 4 baths2,265 sq. ft.
5005 Stonebridge Drive, Champaign, IL 61822
MLS# 12546441Listed by: LIVE REAL ESTATE GROUP $249,900Pending3 beds 2 baths1,539 sq. ft.
2211 Carlisle Drive, Champaign, IL 61821
MLS# 12549113Listed by: THE REAL ESTATE GROUP,INC $395,000Pending3 beds 3 baths2,716 sq. ft.
31 Montclair Road, Urbana, IL 61801
MLS# 12572533Listed by: TAYLOR REALTY ASSOCIATES $254,900Active3 beds 2 baths1,400 sq. ft.
610 Patterson Drive #3, Fisher, IL 61843
MLS# 12577022Listed by: BRENDA KEITH REALTY INC $299,900Pending4 beds 3 baths2,045 sq. ft.
3120 Moraine Drive, Champaign, IL 61822
MLS# 12559073Listed by: KELLER WILLIAMS-TREC $254,900Active3 beds 2 baths1,400 sq. ft.
608 Patterson Drive #2, Fisher, IL 61843
MLS# 12576936Listed by: BRENDA KEITH REALTY INC $264,000Pending2 beds 2 baths1,622 sq. ft.
1908 S Prairie Winds Drive, Urbana, IL 61802
MLS# 12576956Listed by: RE/MAX REALTY ASSOCIATES-CHA $174,900Pending3 beds 2 baths1,419 sq. ft.
1501 Holly Hill Drive, Champaign, IL 61821
MLS# 12575788Listed by: TAYLOR REALTY ASSOCIATES $150,000Active1.25 Acres
4103 E Oaks Road, Urbana, IL 61802
MLS# 12576616Listed by: RE/MAX REALTY ASSOCIATES-CHA $320,000Active3 beds 3 baths1,678 sq. ft.
3710 Lighthouse Pointe Point, Champaign, IL 61822
MLS# 12347970Listed by: EXP REALTY-MAHOMET $275,000Pending3 beds 2 baths1,555 sq. ft.
214 S Rising Road, Champaign, IL 61822
MLS# 12561535Listed by: COLDWELL BANKER R.E. GROUP $575,000Pending5 beds 4 baths3,029 sq. ft.
1503 River Bluff Court, Mahomet, IL 61853
MLS# 12570406Listed by: TAYLOR REALTY ASSOCIATES $454,000Pending5 beds 3 baths2,462 sq. ft.
811 Sunset Drive, Mahomet, IL 61853
MLS# 12574970Listed by: TAYLOR REALTY ASSOCIATES- Open Sun, 1 to 4pm
 $389,900Active4 beds 3 baths2,248 sq. ft.
510 Winston Drive, St. Joseph, IL 61873
MLS# 12576106Listed by: THE REAL ESTATE FIRM LLC  $248,900Active3 beds 3 baths1,383 sq. ft.
1315 S Smith Road, Urbana, IL 61802
MLS# 12575895Listed by: TAYLOR REALTY ASSOCIATES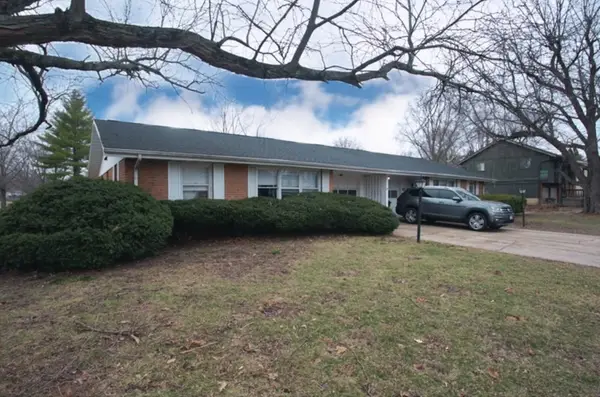 $239,900Active4 beds 1 baths
2313 S Anderson Street, Urbana, IL 61801
MLS# 12573334Listed by: RE/MAX REALTY ASSOCIATES-CHA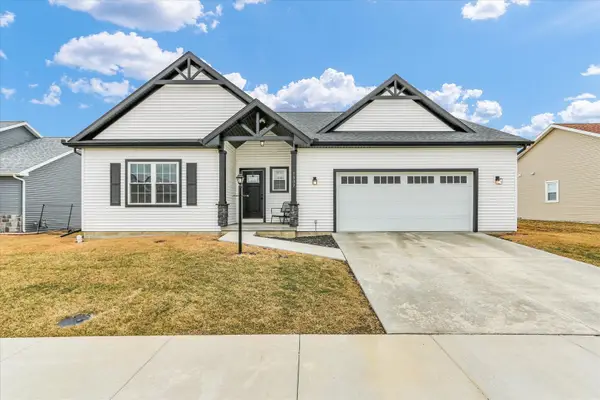 $325,000Pending2 beds 2 baths1,400 sq. ft.
1507 Hillshire Drive, Urbana, IL 61802
MLS# 12573902Listed by: COLDWELL BANKER R.E. GROUP $89,900Pending3 beds 1 baths962 sq. ft.
105 N Lynn Street, Urbana, IL 61802
MLS# 12552050Listed by: COLDWELL BANKER R.E. GROUP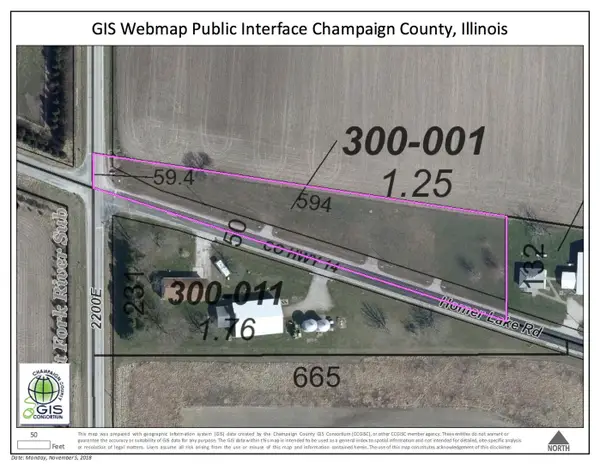 $59,500Active1.25 Acres
2210 Homer Lake Road, St. Joseph, IL 61873
MLS# 12572014Listed by: RE/MAX REALTY ASSOCIATES-CHA $354,900Pending4 beds 2 baths2,504 sq. ft.
6106 N Lincoln Avenue, Champaign, IL 61822
MLS# 12574829Listed by: COLDWELL BANKER R.E. GROUP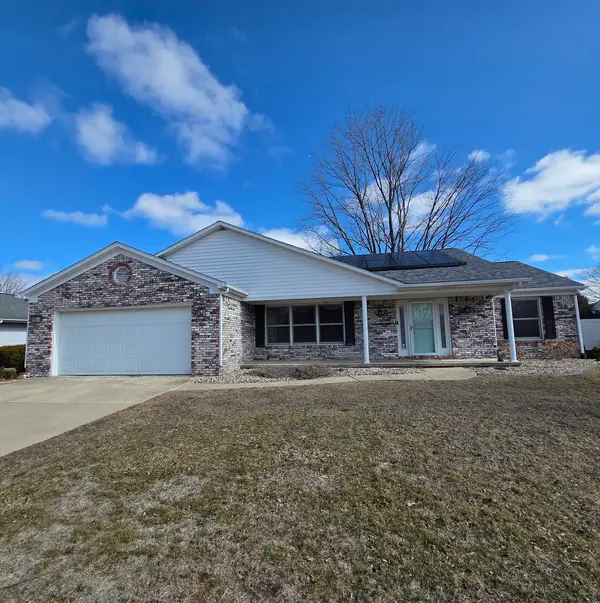 $279,900Pending4 beds 2 baths1,789 sq. ft.
610 Sherwood Drive, St. Joseph, IL 61873
MLS# 12517074Listed by: KELLER WILLIAMS-TREC $278,400Pending3 beds 3 baths1,383 sq. ft.
1313 S Smith Road, Urbana, IL 61802
MLS# 12574580Listed by: KELLER WILLIAMS-TREC $150,000Pending3 beds 2 baths1,169 sq. ft.
1811 Melanie Lane, Champaign, IL 61821
MLS# 12565329Listed by: THE REAL ESTATE GROUP,INC $22,000Active3 beds 1 baths
4809 W Windsor Road #B15, Champaign, IL 61822
MLS# 12574403Listed by: RE/MAX REALTY ASSOCIATES-CHA $689,000Active4 beds 4 baths3,160 sq. ft.
3901 Freedom Boulevard, Champaign, IL 61822
MLS# 12574338Listed by: BRUMMEL PROPERTIES, INC. $200,000Active4 beds 4 baths1,540 sq. ft.
1905 N Lincoln Avenue #327, Urbana, IL 61801
MLS# 12574267Listed by: COLDWELL BANKER R.E. GROUP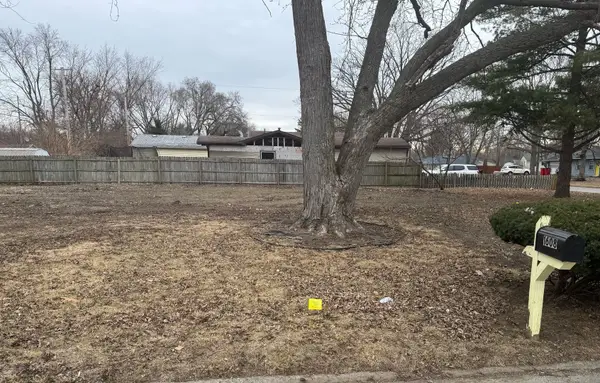 $48,000Active0 Acres
1608 Carolyn Drive, Champaign, IL 61821
MLS# 12573871Listed by: THE REAL ESTATE GROUP,INC $185,000Pending3 beds 1 baths921 sq. ft.
1610 Stratford Drive, Champaign, IL 61821
MLS# 12573121Listed by: COLDWELL BANKER R.E. GROUP $164,900Pending2 beds 3 baths1,238 sq. ft.
2111 Sunview Drive #2111, Champaign, IL 61821
MLS# 12570725Listed by: KELLER WILLIAMS-TREC $664,900Active5 beds 5 baths3,818 sq. ft.
1307 Cross Creek Road, Mahomet, IL 61853
MLS# 12561367Listed by: EXP REALTY-MAHOMET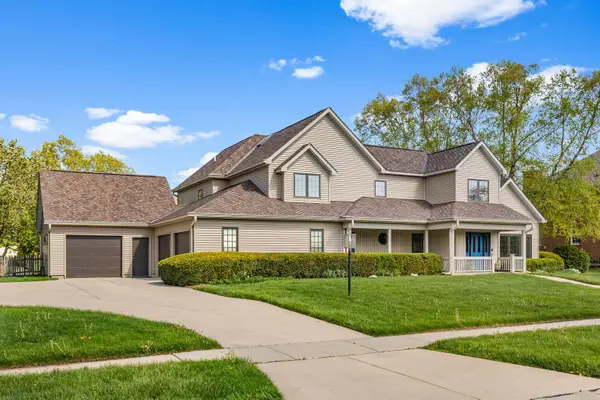 $649,000Pending5 beds 5 baths3,255 sq. ft.
Address Withheld By Seller, Champaign, IL 61821
MLS# 12564423Listed by: REALTY SELECT ONE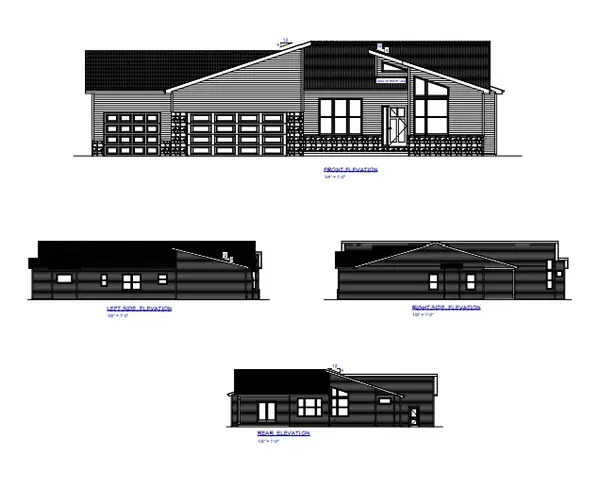 $463,900Pending3 beds 3 baths2,231 sq. ft.
509 N Beacon Hill Circle, Urbana, IL 61802
MLS# 12572380Listed by: KELLER WILLIAMS-TREC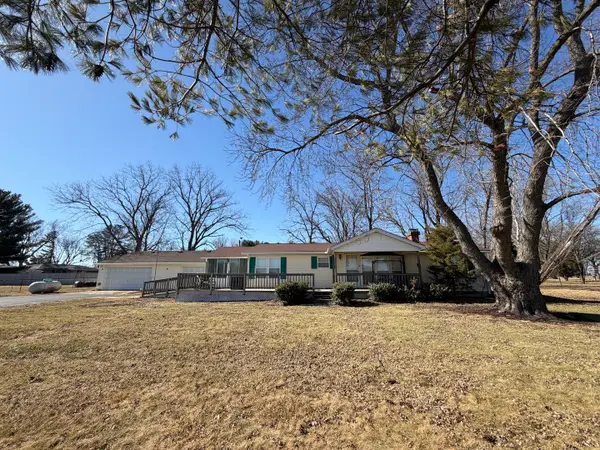 $199,900Pending3 beds 2 baths1,296 sq. ft.
2105 County Road 900, Champaign, IL 61822
MLS# 12556262Listed by: RYAN DALLAS REAL ESTATE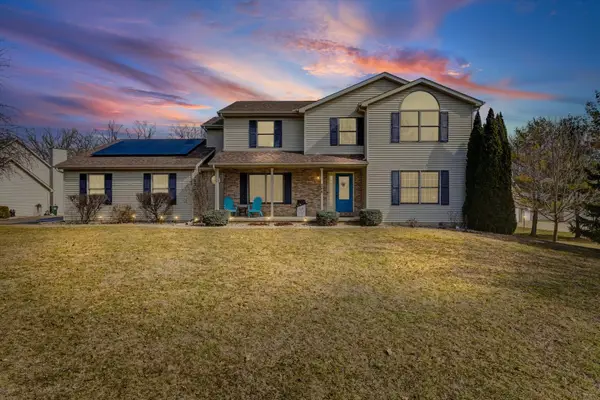 $439,900Pending5 beds 4 baths2,408 sq. ft.
206 S Fox Run Drive, Mahomet, IL 61853
MLS# 12555831Listed by: EXP REALTY-MAHOMET $179,900Active3 beds 1 baths1,073 sq. ft.
618 Dogwood Drive, Champaign, IL 61821
MLS# 12572574Listed by: LIVE REAL ESTATE GROUP $90,100Pending3 beds 1 baths1,188 sq. ft.
127 S Scottswood Drive, Urbana, IL 61802
MLS# 12542241Listed by: REALHOME SERVICES & SOLUTIONS, INC.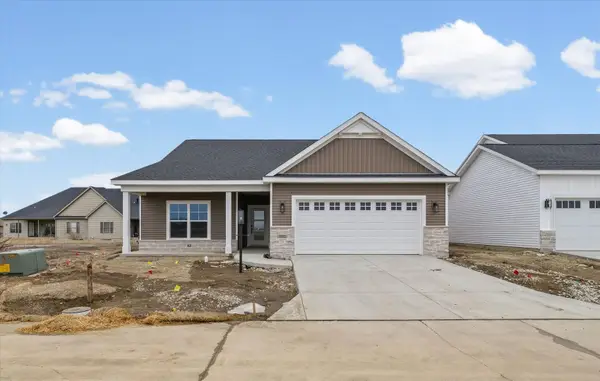 $399,900Active3 beds 2 baths1,794 sq. ft.
3902 Bay Circle, Champaign, IL 61822
MLS# 12564957Listed by: KELLER WILLIAMS-TREC $264,900Active4 beds 2 baths2,053 sq. ft.
2401 Arden Drive, Champaign, IL 61821
MLS# 12567092Listed by: MR. LANDMAN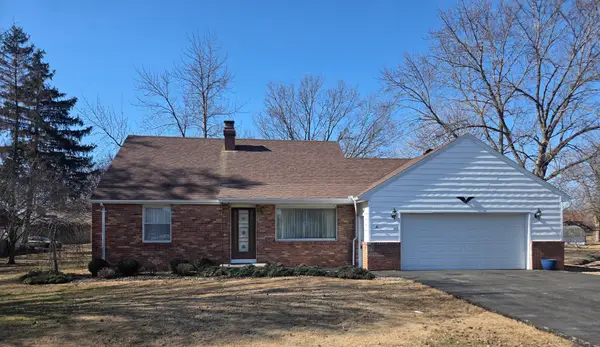 $299,500Active4 beds 2 baths1,713 sq. ft.
501 S First Street, Fisher, IL 61843
MLS# 12571380Listed by: KELLER WILLIAMS-TREC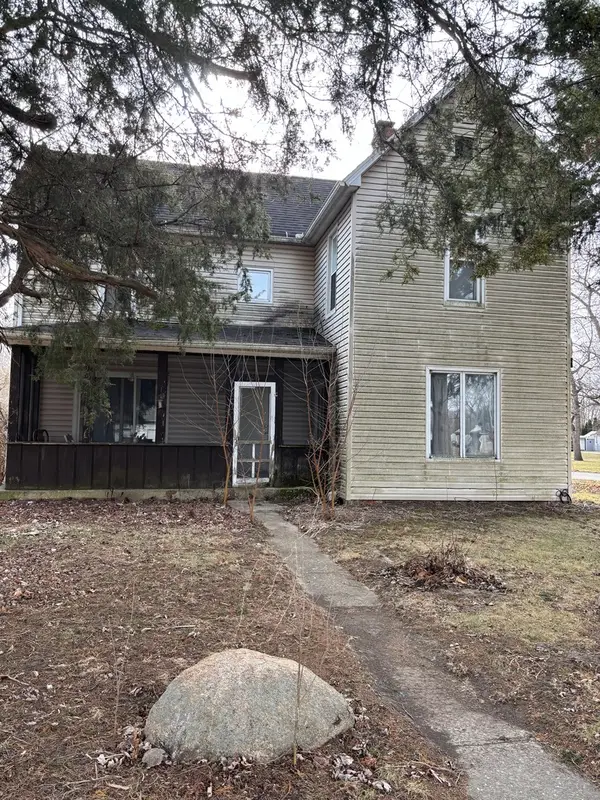 $114,900Active4 beds 1 baths2,080 sq. ft.
105 W Adams Street, Pesotum, IL 61863
MLS# 12572221Listed by: THE REAL ESTATE GROUP,INC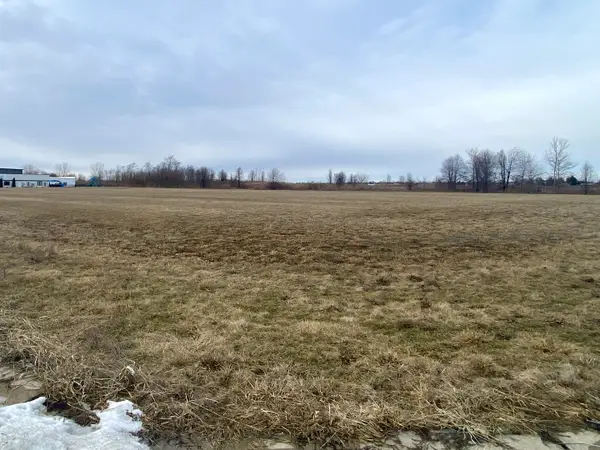 $750,000Active1.92 Acres
4202 Nicklaus Drive, Champaign, IL 61822
MLS# 12567736Listed by: GREEN STREET REALTY $265,000Pending4 beds 2 baths2,380 sq. ft.
2313 Glenoak Drive, Champaign, IL 61821
MLS# 12572075Listed by: KELLER WILLIAMS-TREC $420,000Active4 beds 3 baths2,398 sq. ft.
303 W Michigan Avenue, Urbana, IL 61801
MLS# 12541690Listed by: REALTY SELECT ONE
Local realty services provided by:CENTURY 21 Affiliated, CENTURY 21 Elite
Copyright 2026 Midwest Real Estate Data LLC. All rights reserved. The data relating to real estate for sale on this web site comes in part from the Broker Reciprocity Program of the Midwest Real Estate Data LLC. Listing information is deemed reliable but not guaranteed.
Popular searches near Champaign County, IL
Popular neighborhoods near Champaign County, IL
- Baker Woods, Decatur homes for sale
- Bayview, Decatur homes for sale
- Country Manor, Decatur homes for sale
- Cresthaven, Decatur homes for sale
- Fans Field, Decatur homes for sale
- Galloway Park, Decatur homes for sale
- Grant Park, Decatur homes for sale
- Greenlake, Decatur homes for sale
- Holiday Hills, Decatur homes for sale
- Homewood, Decatur homes for sale
- Lakeview, Decatur homes for sale
- Larkdale, Decatur homes for sale
- Moundford, Decatur homes for sale
- Muffley, Decatur homes for sale
- North Fork, Decatur homes for sale
- Northland Heights, Decatur homes for sale
- Scovill Gardens, Decatur homes for sale
- Shorewood, Decatur homes for sale
- Stone Creek, Urbana homes for sale
- Windsor Village, Decatur homes for sale
Zip codes near Champaign County, IL
- 60949 homes for sale
- 61801 homes for sale
- 61802 homes for sale
- 61820 homes for sale
- 61821 homes for sale
- 61822 homes for sale
- 61843 homes for sale
- 61849 homes for sale
- 61853 homes for sale
- 61854 homes for sale
- 61863 homes for sale
- 61864 homes for sale
- 61866 homes for sale
- 61873 homes for sale
- 61874 homes for sale
- 61877 homes for sale
- 61878 homes for sale
- 61880 homes for sale
- 61884 homes for sale
- 61956 homes for sale
Protect your home and budget from life's surprises with an Assurant Home Warranty, backed by a partner that supports you through every step of homeownership. Explore Plans.
©2026 Century 21 Real Estate LLC. All rights reserved. CENTURY 21®, the CENTURY 21 Logo and C21® are service marks owned by Century 21 Real Estate LLC. Century 21 Real Estate LLC fully supports the principles of the Fair Housing Act and the Equal Opportunity Act. Each office is independently owned and operated. Listing information is deemed reliable but not guaranteed accurate.