- Ames Lake, Redmond homes for sale
- Cherry Gardens, Duvall homes for sale
- Fall City, Fall City homes for sale
- Hazelwood, Cle Elum homes for sale
- Hobart, Maple Valley homes for sale
- Issaquah Highlands, Issaquah homes for sale
- Klahanie, Issaquah homes for sale
- Lake Marcel, Carnation homes for sale
- Mirrormont, Issaquah homes for sale
- Redmond Ridge, Redmond homes for sale
- Ring Hill, Woodinville homes for sale
- Riverbend, North Bend homes for sale
- Sahalee Country Club, Sammamish homes for sale
- Snoqualmie Ridge, Snoqualmie homes for sale
- Spring Glen, Fall City homes for sale
- Tanner, North Bend homes for sale
- Trilogy, Redmond homes for sale
- Trossachs, Sammamish homes for sale
- Upper Preston, Issaquah homes for sale
- Vintage, Sammamish homes for sale
Chelan, WA - homes for sale
122 of 122 results displayed
- New
 $1,499,000Active6 beds 4 baths3,848 sq. ft.
335 Henderson Road, Chelan, WA 98816
MLS# 2500461Listed by: REAL ESTATE 2000 INC.
- New
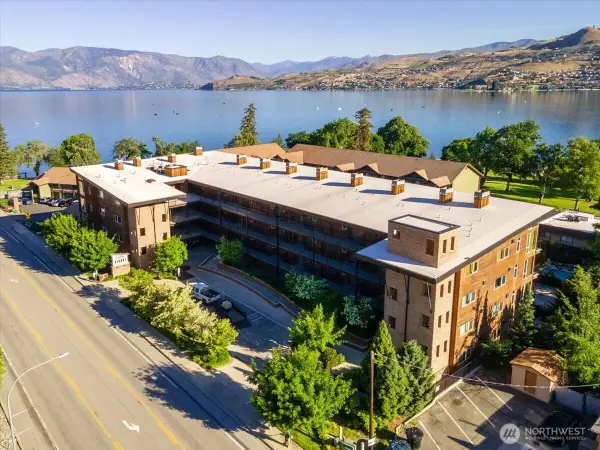
 $859,000Active2 beds 2 baths1,014 sq. ft.
100 Lake Chelan Shores Dr. #3-8, Chelan, WA 98816
MLS# 2498108Listed by: WINDERMERE RE/LAKE CHELAN - New
 $1,295,000Active3 beds 3 baths2,343 sq. ft.
621 Mountain View Dr, Chelan, WA 98816
MLS# 2499448Listed by: HOMES & EQUITY REAL ESTATE GRP - New
 $1,500,000Active4 beds 4 baths1,872 sq. ft.
103 N Park Street #432, Chelan, WA 98816
MLS# 2498698Listed by: JOHN L. SCOTT MILL CREEK - New
 $339,900Active2 beds 2 baths884 sq. ft.
2220 W Woodin Avenue #110, Chelan, WA 98816
MLS# 2499122Listed by: WINDERMERE RE/LK CHELAN MIDTWN - New
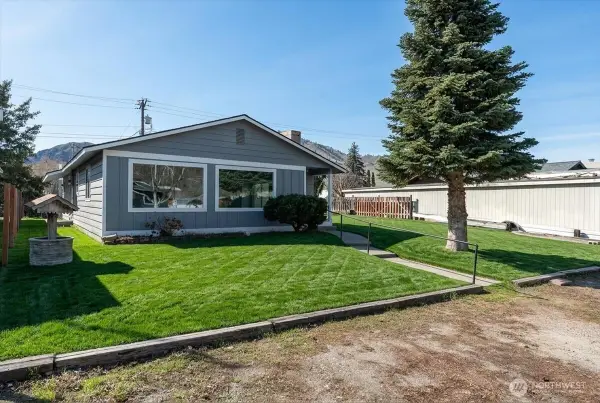 $599,000Active3 beds 2 baths1,597 sq. ft.
916 E Johnson Avenue, Chelan, WA 98816
MLS# 2498644Listed by: WINDERMERE RE/LK CHELAN MIDTWN - New
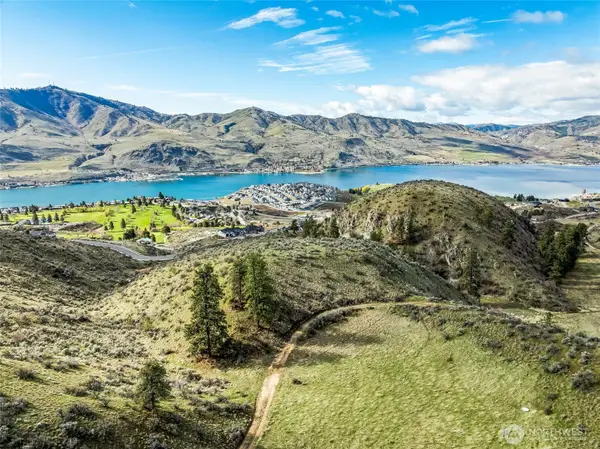 $350,000Active19.99 Acres
0 Skyfall Lane, Chelan, WA 98816
MLS# 2493841Listed by: REAL BROKER LLC - New
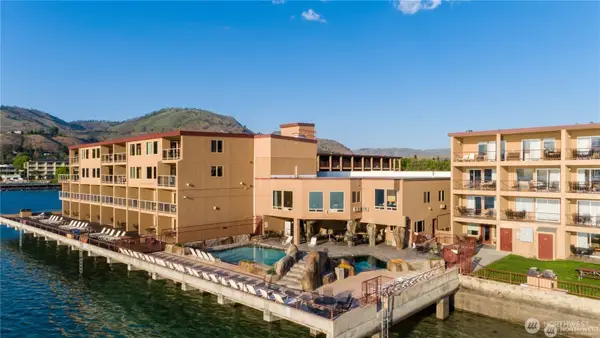 $359,000Active1 beds 1 baths622 sq. ft.
322 W Woodin Avenue #514, Chelan, WA 98816
MLS# 2496243Listed by: WINDERMERE RE/LK CHELAN DWNTWN - New
 $869,000Active2 beds 4 baths1,378 sq. ft.
117 Bluebell Lane, Chelan, WA 98816
MLS# 2497460Listed by: WINDERMERE RE/LK CHELAN DWNTWN - New
 $5,250,000Active3 beds 4 baths3,931 sq. ft.
21 Grace Lane, Chelan, WA 98816
MLS# 2498606Listed by: COLDWELL BANKER DANFORTH - New
 $3,000Active3 beds 3 baths1,368 sq. ft.
100 Lake Chelan Shores Drive #15-8F, Chelan, WA 98816
MLS# 2498020Listed by: RE/MAX ADVANTAGE - New
 $145,000Active0.88 Acres
104 Crest Drive #Lot 84 SP (this is lot 1 of SP), Chelan, WA 98816
MLS# 2497193Listed by: RE/MAX ADVANTAGE - New
 $1,100,000Active3 beds 3 baths2,864 sq. ft.
204 Stehekin Way, Chelan, WA 98816
MLS# 2496481Listed by: RE/MAX ADVANTAGE - New
 $749,000Active2 beds 2 baths1,095 sq. ft.
100 Lake Chelan Shores Drive #18-8, Chelan, WA 98816
MLS# 2495905Listed by: RE/MAX ADVANTAGE - New
 $1,395,000Active4 beds 5 baths2,624 sq. ft.
576 Porcupine Lane, Chelan, WA 98816
MLS# 2488926Listed by: WINDERMERE RE/LAKE CHELAN  $175,000Active0.09 Acres
1111 E Allen Street, Chelan, WA 98816
MLS# 2495177Listed by: LATHAM REALTY UNLIMITED INC $1,449,000Active4 beds 4 baths2,124 sq. ft.
217 Bluebell Lane, Chelan, WA 98816
MLS# 2494034Listed by: CB CASCADE - LAKE CHELAN $399,900Active2 beds 2 baths1,112 sq. ft.
2305 W Woodin Ave #2E, Chelan, WA 98816
MLS# 2494884Listed by: WINDERMERE RE/LK CHELAN MIDTWN $295,000Active2 beds 2 baths884 sq. ft.
2220 W Woodin Avenue #106, Chelan, WA 98816
MLS# 2494762Listed by: WINDERMERE RE/LAKE CHELAN $199,950Active0.38 Acres
0 E Nixon Avenue #1 & 2, Chelan, WA 98816
MLS# 2494287Listed by: VALLEY AND VIEW $359,000Pending1 beds 1 baths622 sq. ft.
322 W Woodin Avenue #615, Chelan, WA 98816
MLS# 2493063Listed by: KW GREATER SEATTLE $2,000,000Active3 beds 4 baths6,028 sq. ft.
232 Crystal Drive, Chelan, WA 98816
MLS# 2493609Listed by: ENGEL & VOELKERS MERCER ISLAND $479,000Active1 beds 1 baths685 sq. ft.
100 Lake Chelan Shores Drive #18-5, Chelan, WA 98816
MLS# 2493751Listed by: CHELAN REALTY $699,999Active4 beds 2 baths2,034 sq. ft.
109 Pyramid Place, Chelan, WA 98816
MLS# 2493569Listed by: RE/MAX ADVANTAGE $359,000Active1 beds 1 baths622 sq. ft.
322 W Woodin Avenue #512, Chelan, WA 98816
MLS# 2489065Listed by: WINDERMERE RE/LK CHELAN DWNTWN $255,000Active0.38 Acres
210 Crystal View Drive, Chelan, WA 98816
MLS# 2405857Listed by: GUY EVANS LAKE CHELAN REAL EST $97,500Pending-- beds -- baths380 sq. ft.
1240 W Woodin Ave #B10, Chelan, WA 98816
MLS# 2488372Listed by: WINDERMERE RE/LAKE CHELAN $1,125,000Active3 beds 2 baths1,270 sq. ft.
523 Mackinaw Lane, Chelan, WA 98816
MLS# 2489577Listed by: WINDERMERE RE/LAKE CHELAN $1,400,000Active4 beds 3 baths1,988 sq. ft.
250 Bobcat Lane, Chelan, WA 98816
MLS# 2489423Listed by: EPIQUE REALTY $2,950,000Active20.8 Acres
3725 Us Highway 97a, Chelan, WA 98816
MLS# 2485825Listed by: WINDERMERE RE/LK CHELAN DWNTWN $999,000Active4 beds 3 baths1,718 sq. ft.
205 Bluebell Lane, Chelan, WA 98816
MLS# 2485839Listed by: WINDERMERE RE/LK CHELAN DWNTWN $950,000Active2 beds 2 baths1,092 sq. ft.
481 Mackinaw Lane, Chelan, WA 98816
MLS# 2481921Listed by: WINDERMERE RE/LAKE CHELAN $745,000Active1 beds 2 baths810 sq. ft.
104 Spader Bay Road #44, Chelan, WA 98816
MLS# 2481916Listed by: WINDERMERE RE/LAKE CHELAN $2,245,000Active5 beds 5 baths5,464 sq. ft.
333 Highpoint Place, Chelan, WA 98816
MLS# 2485216Listed by: WINDERMERE RE/LK CHELAN DWNTWN $120,000Active-- beds -- baths1 sq. ft.
1350 W Woodin Avenue #WB6, Chelan, WA 98816
MLS# 2486362Listed by: KW NCW $69,500Active-- beds -- baths287 sq. ft.
1350 W Woodin Ave #C18, Chelan, WA 98816
MLS# 2486388Listed by: CB CASCADE - LAKE CHELAN $675,000Active4 beds 2 baths1,891 sq. ft.
444 Hilltop Place, Chelan, WA 98816
MLS# 2486106Listed by: RE/MAX ADVANTAGE $975,000Active3 beds 3 baths1,558 sq. ft.
118 Porcupine Lane, Chelan, WA 98816
MLS# 2484788Listed by: WINDERMERE RE/LK CHELAN DWNTWN $73,500Active-- beds 3 baths1 sq. ft.
1350 W Woodin Avenue #C33, Chelan, WA 98816
MLS# 2484703Listed by: WINDERMERE RE/LK CHELAN DWNTWN $1,895,000Active4 beds 3 baths2,987 sq. ft.
326 Porcupine Lane, Chelan, WA 98816
MLS# 2484658Listed by: LAURA MOUNTER REAL ESTATE $465,000Active2 beds 2 baths1,130 sq. ft.
808 W Manson Highway #B201, Chelan, WA 98816
MLS# 2483491Listed by: RE/MAX NORTHWEST $250,000Active2.23 Acres
270 Crystal View Drive #104, Chelan, WA 98816
MLS# 2483283Listed by: WINDERMERE RE/LAKE CHELAN $999,999Active2 beds 3 baths1,420 sq. ft.
1418 Cottage Lane, Chelan, WA 98816
MLS# 2482374Listed by: CB CASCADE - LAKE CHELAN $440,000Active3 beds 2 baths1,205 sq. ft.
1902 W Prospect St. #112, Chelan, WA 98816
MLS# 2478653Listed by: EPIQUE REALTY $995,000Active2 beds 3 baths1,420 sq. ft.
1414 Cottage Lane, Chelan, WA 98816
MLS# 2480167Listed by: CB CASCADE - LAKE CHELAN $80,500Active-- beds 2 baths288 sq. ft.
1350 W Woodin Avenue #C29, Chelan, WA 98816
MLS# 2480038Listed by: RE/MAX ADVANTAGE $450,000Active2 beds 2 baths1,080 sq. ft.
808 W Manson Rd #B203, Chelan, WA 98816
MLS# 2479914Listed by: THE LAKELAND AGENCY, INC $350,000Active2 beds 2 baths1,134 sq. ft.
316 E Wapato Avenue #1, Chelan, WA 98816
MLS# 2475322Listed by: WINDERMERE RE/LAKE CHELAN $449,000Active3 beds 2 baths1,260 sq. ft.
407 E Okanogan Avenue, Chelan, WA 98816
MLS# 2475420Listed by: WINDERMERE RE/LAKE CHELAN $449,000Active3 beds 2 baths1,260 sq. ft.
413 E Okanogan Avenue, Chelan, WA 98816
MLS# 2475942Listed by: WINDERMERE RE/LAKE CHELAN $449,000Active3 beds 2 baths1,260 sq. ft.
415 E Okanogan Avenue, Chelan, WA 98816
MLS# 2475953Listed by: WINDERMERE RE/LAKE CHELAN $449,000Active3 beds 2 baths1,260 sq. ft.
409 E Okanogan Avenue, Chelan, WA 98816
MLS# 2476153Listed by: WINDERMERE RE/LAKE CHELAN $425,000Active1.14 Acres
126 Mira Vista Drive, Chelan, WA 98816
MLS# 2478271Listed by: LATHAM REALTY UNLIMITED INC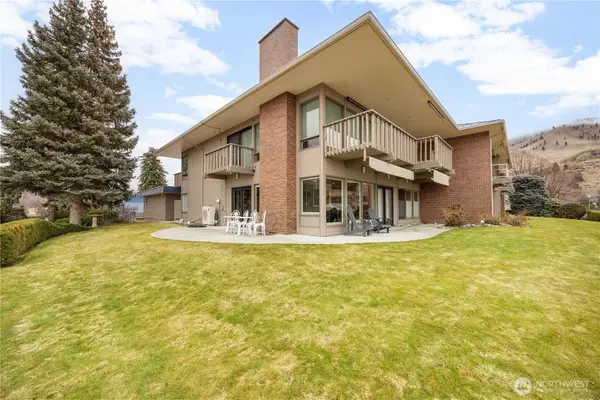 $675,000Active3 beds 2 baths1,400 sq. ft.
301 S 3rd Street #4, Chelan, WA 98816
MLS# 2476348Listed by: RE/MAX ADVANTAGE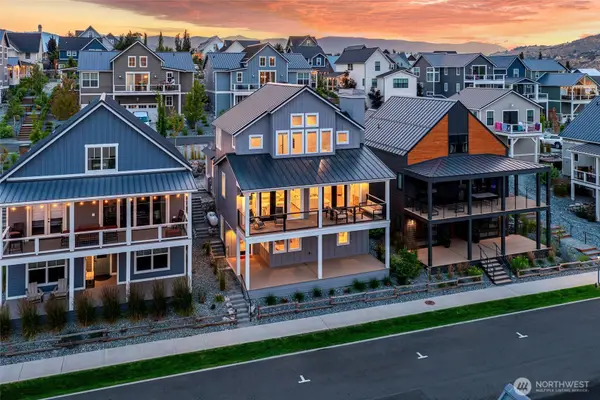 $1,399,999Active4 beds 4 baths2,479 sq. ft.
259 Bobcat Lane, Chelan, WA 98816
MLS# 2475819Listed by: EXP REALTY $275,000Pending1 beds 1 baths616 sq. ft.
321 S 3rd Street #1, Chelan, WA 98816
MLS# 2475466Listed by: RE/MAX ADVANTAGE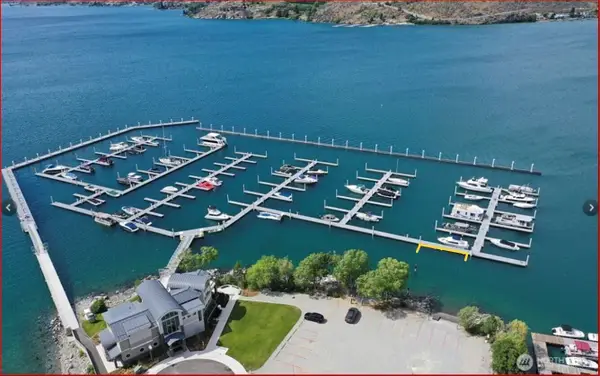 $146,900Active-- beds -- baths600 sq. ft.
1350 W Woodin Avenue #WD-5, Chelan, WA 98816
MLS# 2475402Listed by: GARDNER REALTY GROUP LLC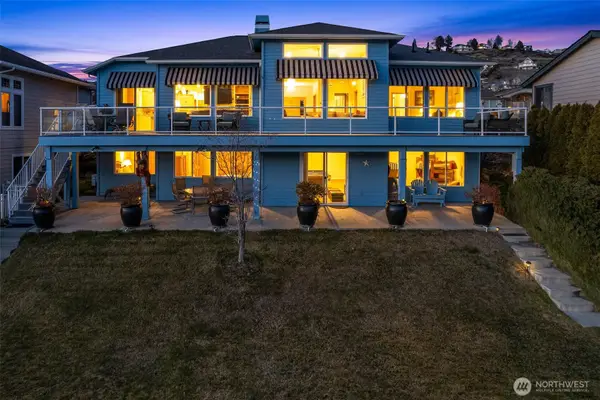 $3,500,000Active5 beds 4 baths4,903 sq. ft.
231 Key Lane, Chelan, WA 98816
MLS# 2472707Listed by: RE/MAX ADVANTAGE $189,000Active0.1 Acres
919 E Johnson(lot 11) Avenue #11, Chelan, WA 98816
MLS# 2472785Listed by: WINDERMERE RE/LAKE CHELAN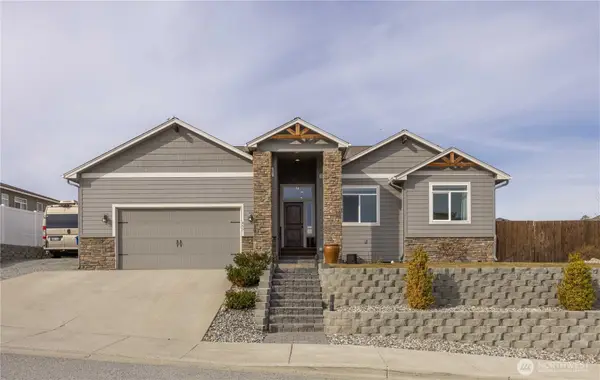 $679,457Pending3 beds 2 baths2,088 sq. ft.
457 Whisper Place, Chelan, WA 98816
MLS# 2471530Listed by: RE/MAX ADVANTAGE $689,000Pending2 beds 2 baths1,060 sq. ft.
100 Lake Chelan Shores Drive #19-2, Chelan, WA 98816
MLS# 2470555Listed by: WINDERMERE RE/LAKE CHELAN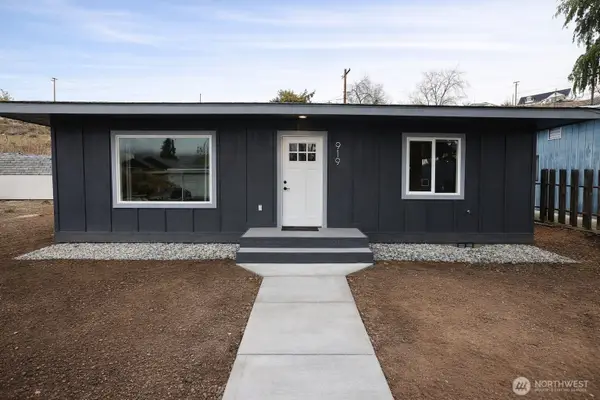 $519,900Active2 beds 2 baths936 sq. ft.
919 E Johnson Avenue, Chelan, WA 98816
MLS# 2470534Listed by: WINDERMERE RE/LAKE CHELAN $150,000Active-- beds -- baths1 sq. ft.
1350 W Woodin Avenue #FDE1, Chelan, WA 98816
MLS# 2469775Listed by: CB CASCADE - LAKE CHELAN $92,000Active-- beds -- baths1 sq. ft.
1350 W Woodin Avenue #A6, Chelan, WA 98816
MLS# 2467872Listed by: KW NCW $2,500Pending3 beds 3 baths1,542 sq. ft.
100 Lake Chelan Shores Drive #14-5, Chelan, WA 98816
MLS# 2469331Listed by: RE/MAX ADVANTAGE $799,900Active2 beds 2 baths1,245 sq. ft.
103 N Park Street #332, Chelan, WA 98816
MLS# 2466913Listed by: NICK MCLEAN REAL ESTATE GROUP $399,000Active0.47 Acres
104 Lake Ridge Drive #68, Chelan, WA 98816
MLS# 2467506Listed by: NICK MCLEAN REAL ESTATE GROUP $199,000Active0.4 Acres
139 Bogey Boulevard #19, Chelan, WA 98816
MLS# 2467043Listed by: CHELAN REALTY $400,000Active0.38 Acres
186 Easton Way #68, Chelan, WA 98816
MLS# 2467026Listed by: NEW HORIZONS REAL ESTATE LLC $400,000Active0.39 Acres
185 Easton Way #69, Chelan, WA 98816
MLS# 2467040Listed by: NEW HORIZONS REAL ESTATE LLC $380,000Active0.43 Acres
172 Easton Way #79, Chelan, WA 98816
MLS# 2467050Listed by: NEW HORIZONS REAL ESTATE LLC $80,000Active-- beds -- baths1 sq. ft.
1350 W Woodin Avenue #C-25, Chelan, WA 98816
MLS# 2466958Listed by: CB CASCADE - LAKE CHELAN $82,000Active-- beds 2 baths288 sq. ft.
1350 W Woodin Avenue #B8, Chelan, WA 98816
MLS# 2466826Listed by: RE/MAX ADVANTAGE $739,000Pending5 beds 4 baths2,778 sq. ft.
417 N Columbia Street, Chelan, WA 98816
MLS# 2461731Listed by: WINDERMERE RE/LK CHELAN DWNTWN $1,499,000Pending5 beds 5 baths3,790 sq. ft.
154 Apple Avenue, Chelan, WA 98816
MLS# 2461644Listed by: RE/MAX ADVANTAGE $171,500Active-- beds -- baths490 sq. ft.
73 E Shop Avenue #A9, Chelan, WA 98816
MLS# 2362841Listed by: LATHAM REALTY UNLIMITED INC $83,000Active-- beds 1 baths412 sq. ft.
1350 W Woodin Avenue #CDE1, Chelan, WA 98816
MLS# 2459011Listed by: RE/MAX ADVANTAGE $83,000Active-- beds 1 baths412 sq. ft.
1350 W Woodin Avenue #CDE2, Chelan, WA 98816
MLS# 2459013Listed by: RE/MAX ADVANTAGE $166,000Active-- beds 1 baths824 sq. ft.
1350 W Woodin Avenue #CDE1&2, Chelan, WA 98816
MLS# 2459014Listed by: RE/MAX ADVANTAGE $150,000Active0.1 Acres
0 E Allen Street #7, Chelan, WA 98816
MLS# 2449255Listed by: LATHAM REALTY UNLIMITED INC $495,000Pending4 beds 2 baths1,704 sq. ft.
227 E Franklin, Chelan, WA 98816
MLS# 2446647Listed by: CB CASCADE - LAKE CHELAN $95,000Active-- beds -- baths1 sq. ft.
1350 Woodin Avenue #A-08, Chelan, WA 98816
MLS# 2444968Listed by: PREMIER ONE PROPERTIES $630,000Active3 beds 3 baths1,644 sq. ft.
104 Vineyard Lane #5A, Chelan, WA 98816
MLS# 2442984Listed by: CB CASCADE - LAKE CHELAN $399,000Active0.34 Acres
109 Apple Avenue, Chelan, WA 98816
MLS# 2437053Listed by: WINDERMERE RE/LAKE CHELAN $525,000Active0.41 Acres
211 Viewland Way #51, Chelan, WA 98816
MLS# 2439709Listed by: NEW HORIZONS REAL ESTATE LLC $689,000Active1 beds 1 baths806 sq. ft.
100 Lake Chelan Shores Drive #3-6, Chelan, WA 98816
MLS# 2436451Listed by: WINDERMERE WEST METRO $320,500Active-- beds -- baths925 sq. ft.
73 E Shop Avenue #B6, Chelan, WA 98816
MLS# 2435927Listed by: LATHAM REALTY UNLIMITED INC $335,000Active-- beds -- baths1,000 sq. ft.
73 E Shop Avenue #B1, Chelan, WA 98816
MLS# 2435898Listed by: LATHAM REALTY UNLIMITED INC $351,000Pending-- beds -- baths1,050 sq. ft.
73 E Shop Avenue #B4, Chelan, WA 98816
MLS# 2435914Listed by: LATHAM REALTY UNLIMITED INC $2,250,000Active2 beds 1 baths1,212 sq. ft.
30 Isenhart Road, Chelan, WA 98816
MLS# 2430837Listed by: GUY EVANS LAKE CHELAN REAL EST $169,000Pending0.28 Acres
131 Monte Carlo Drive, Chelan, WA 98816
MLS# 2427765Listed by: WINDERMERE RE/LK CHELAN DWNTWN $2,900,000Active3.52 Acres
100 N Apple Blossom Drive #5, Chelan, WA 98816
MLS# 2423570Listed by: DA LI INTERNATIONAL REALTY LLC $495,000Active3 beds 2 baths1,694 sq. ft.
116 E Raymond Avenue, Chelan, WA 98816
MLS# 2422340Listed by: CHELAN REALTY $5,000Active2 beds 2 baths884 sq. ft.
100 Lake Chelan Shores Dr. #17-4C, Chelan, WA 98816
MLS# 2420687Listed by: CHELAN REALTY $749,000Active3 beds 3 baths1,358 sq. ft.
100 Lake Chelan Shores Drive #16-7&8, Chelan, WA 98816
MLS# 2419908Listed by: RE/MAX ADVANTAGE $1,000Active1 beds 1 baths502 sq. ft.
100 Lake Chelan Shores Drive #16-4 P, Chelan, WA 98816
MLS# 2413044Listed by: RE/MAX ADVANTAGE $420,000Active0.74 Acres
101 Lake Ridge Drive, Chelan, WA 98816
MLS# 2411052Listed by: WINDERMERE RE/LK CHELAN DWNTWN $270,000Active0.96 Acres
111 Crest Dr, Chelan Wa 98816 #A, Chelan, WA 98816
MLS# 2406557Listed by: KELLER WILLIAMS NORTH SEATTLE $350,000Active0.23 Acres
122 Mayer Drive #16, Chelan, WA 98816
MLS# 2397714Listed by: WINDERMERE RE/LAKE CHELAN $1,895,998Active4 beds 5 baths2,333 sq. ft.
203 Bluebell Court, Chelan, WA 98816
MLS# 2384793Listed by: COMPASS $194,900Active-- beds 1 baths279 sq. ft.
322 W Woodin Avenue #711, Chelan, WA 98816
MLS# 2377656Listed by: NICK MCLEAN REAL ESTATE GROUP $230,000Active-- beds -- baths660 sq. ft.
73 E Shop Avenue #C1, Chelan, WA 98816
MLS# 2379231Listed by: LATHAM REALTY UNLIMITED INC $250,000Active-- beds -- baths720 sq. ft.
73 E Shop Avenue #C6, Chelan, WA 98816
MLS# 2379237Listed by: LATHAM REALTY UNLIMITED INC $250,000Active-- beds -- baths720 sq. ft.
73 E Shop Avenue #C7, Chelan, WA 98816
MLS# 2379239Listed by: LATHAM REALTY UNLIMITED INC $425,000Pending-- beds -- baths1,200 sq. ft.
73 E Shop Avenue #B3, Chelan, WA 98816
MLS# 2369234Listed by: LATHAM REALTY UNLIMITED INC $254,000Active0.36 Acres
925 Long Drive, Chelan, WA 98816
MLS# 2365472Listed by: CB CASCADE - WENATCHEE $180,000Active-- beds -- baths507 sq. ft.
73 E Shop Avenue #A12, Chelan, WA 98816
MLS# 2363952Listed by: LATHAM REALTY UNLIMITED INC $425,000Pending-- beds -- baths1,200 sq. ft.
73 E Shop Avenue #B2, Chelan, WA 98816
MLS# 2365124Listed by: LATHAM REALTY UNLIMITED INC $325,000Active0.28 Acres
120 Orchard View Drive, Chelan, WA 98816
MLS# 2493428Listed by: GUY EVANS LAKE CHELAN REAL EST $162,000Active-- beds -- baths
1350 W Woodin Avenue #F8, Chelan, WA 98816
MLS# 2361836Listed by: WINDERMERE RE/LAKE CHELAN $650,000Active0.12 Acres
1307 Dragonfly Court #391, Chelan, WA 98816
MLS# 2475952Listed by: CB CASCADE - LAKE CHELAN $79,000Active-- beds -- baths288 sq. ft.
1350 W Woodin Ave #C22, Chelan, WA 98816
MLS# 2487075Listed by: CB CASCADE - LAKE CHELAN $195,000Active0.32 Acres
124 Hillcrest Place #12, Chelan, WA 98816
MLS# 2326498Listed by: JOHN L. SCOTT MILL CREEK $259,000Pending2 beds 1 baths900 sq. ft.
143 E Nixon Avenue, Chelan, WA 98816
MLS# 2321751Listed by: RE/MAX ADVANTAGE $180,000Active0.63 Acres
922 Long Drive #16, Chelan, WA 98816
MLS# 2270882Listed by: CB CASCADE - LAKE CHELAN $150,000Active0.27 Acres
846 Long Drive #35, Chelan, WA 98816
MLS# 2270883Listed by: CB CASCADE - LAKE CHELAN $175,000Active0.66 Acres
901 Long Drive #49, Chelan, WA 98816
MLS# 2270886Listed by: CB CASCADE - LAKE CHELAN $250,000Active0.29 Acres
929 Long Drive #56, Chelan, WA 98816
MLS# 2270888Listed by: CB CASCADE - LAKE CHELAN $2,950,000Active0.7 Acres
102 Burbot Lane #2, Chelan, WA 98816
MLS# 2256940Listed by: WINDERMERE RE/LK CHELAN DWNTWN $325,000Active-- beds 1 baths387 sq. ft.
322 W Woodin Avenue #521, Chelan, WA 98816
MLS# 2442047Listed by: NICK MCLEAN REAL ESTATE GROUP $350,000Pending9.03 Acres
0 E Iowa Street, Chelan, WA 98816
MLS# 2050193Listed by: GUY EVANS LAKE CHELAN REAL EST $414,900Pending3 beds 2 baths1,576 sq. ft.
482 Sunny Brooke Lane, Chelan, WA 98816
MLS# 1659697Listed by: WINDERMERE RE/LAKE CHELAN
Local realty services provided by:CENTURY 21 Lund, Realtors
Listings courtesy of Northwest MLS as distributed by MLS GRID. Based on information submitted to the MLS GRID as of April 1, 2026. All data is obtained from various sources and may not have been verified by broker or MLS GRID. Supplied Open House Information is subject to change without notice. All information should be independently reviewed and verified for accuracy. Properties may or may not be listed by the office/agent presenting the information. Listing information is provided for consumers' personal, non-commercial use, solely to identify prospective properties for potential purchase; all other use is strictly prohibited and may violate relevant federal and state law. Information deemed reliable but not guaranteed. Copyright © 2026 MLS GRID. All Rights Reserved.
Neighborhoods near Chelan, WA
Zip codes near Chelan, WA
- 98801 homes for sale
- 98802 homes for sale
- 98812 homes for sale
- 98813 homes for sale
- 98814 homes for sale
- 98815 homes for sale
- 98816 homes for sale
- 98821 homes for sale
- 98822 homes for sale
- 98829 homes for sale
- 98830 homes for sale
- 98831 homes for sale
- 98834 homes for sale
- 98836 homes for sale
- 98840 homes for sale
- 98843 homes for sale
- 98846 homes for sale
- 98850 homes for sale
- 98858 homes for sale
- 99115 homes for sale
Popular searches near Chelan, WA
- Brewster homes for sale
- Brewster-Wakefield homes for sale
- Bridgeport homes for sale
- Bridgeport homes for sale
- Carlton homes for sale
- Cashmere homes for sale
- Coulee City homes for sale
- Dryden homes for sale
- East Wenatchee homes for sale
- Entiat homes for sale
- Mansfield homes for sale
- Manson homes for sale
- Methow homes for sale
- Monitor homes for sale
- Orondo homes for sale
- Pateros homes for sale
- Rock Island homes for sale
- Sunnyslope homes for sale
- Waterville homes for sale
- Wenatchee homes for sale
Protect your home and budget from life's surprises with an Assurant Home Warranty, backed by a partner that supports you through every step of homeownership. Explore Plans.
©2026 Century 21 Real Estate LLC. All rights reserved. CENTURY 21®, the CENTURY 21 Logo and C21® are service marks owned by Century 21 Real Estate LLC. Century 21 Real Estate LLC fully supports the principles of the Fair Housing Act and the Equal Opportunity Act. Each office is independently owned and operated. Listing information is deemed reliable but not guaranteed accurate.