- Bonita homes for sale
- Bostonia homes for sale
- Casa De Oro-Mount Helix homes for sale
- Chula Vista homes for sale
- Coronado homes for sale
- Crest homes for sale
- El Cajon homes for sale
- Granite Hills homes for sale
- Imperial Beach homes for sale
- Jamul homes for sale
- La Mesa homes for sale
- La Presa homes for sale
- Lemon Grove homes for sale
- National City homes for sale
- Rancho San Diego homes for sale
- San Diego homes for sale
- San Ysidro homes for sale
- Santee homes for sale
- Spring Valley homes for sale
- Winter Gardens homes for sale
91911, CA - homes for sale
157 of 157 results displayed
- New
 $789,000Active3 beds 2 baths1,138 sq. ft.
350 Tourmaline Court, Chula Vista, CA 91911
MLS# SW26147310Listed by: ASAHI REALTY
- New
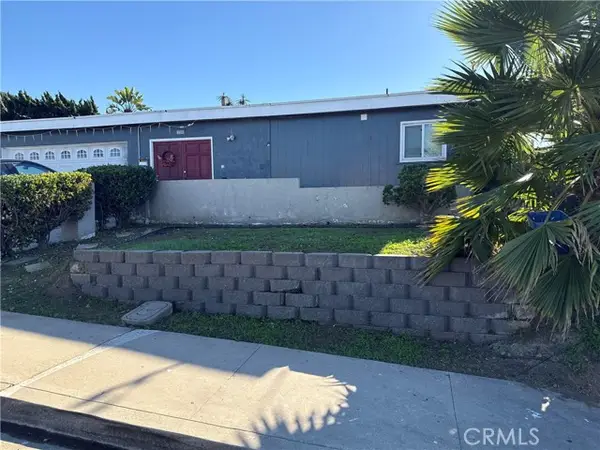
 $671,700Active2 beds 1 baths980 sq. ft.
1167 Second Ave, Chula Vista, CA 91911
MLS# 260016972Listed by: SAN DIEGO REAL ESTATE AND LOANS - New
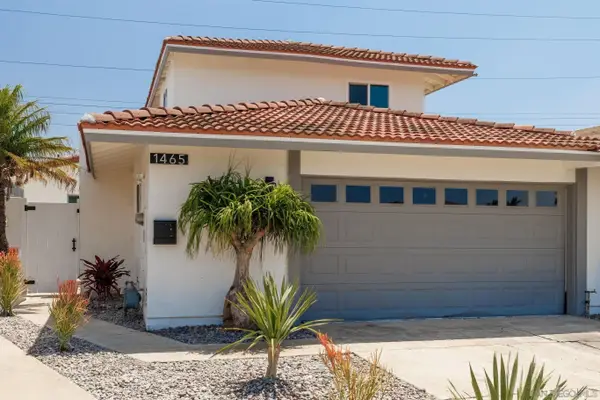 $774,900Active5 beds 3 baths1,812 sq. ft.
1465 Kim Pl, Chula Vista, CA 91911
MLS# 260016942Listed by: BEACH CITY BROKERS, INC. - New
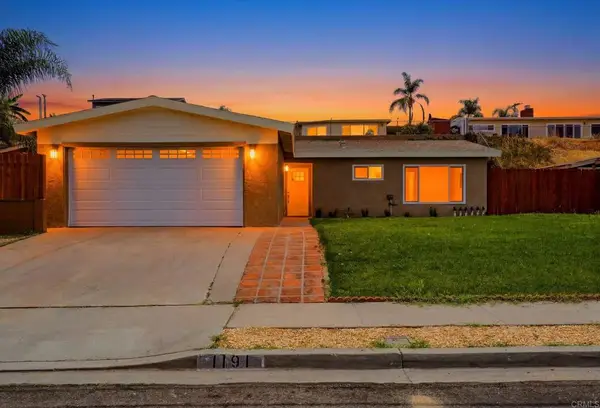 $849,900Active3 beds 2 baths1,110 sq. ft.
1191 Nolan Avenue, Chula Vista, CA 91911
MLS# PTP2605223Listed by: COLDWELL BANKER WEST - New
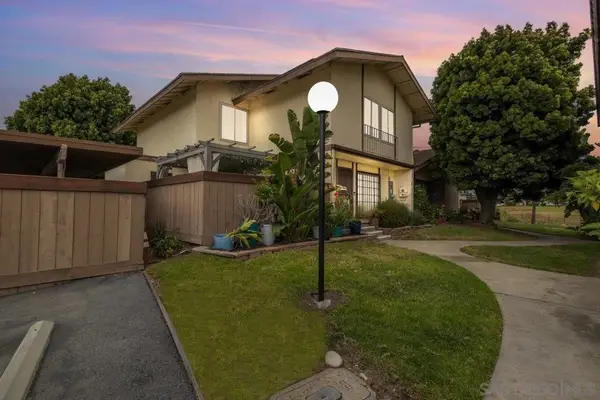 $565,000Active3 beds 2 baths1,212 sq. ft.
238 Regency Ct #C, Chula Vista, CA 91911
MLS# 260016881SDListed by: DREAM HOME REALTY AND LENDING - New
 $849,000Active4 beds 2 baths1,520 sq. ft.
364 E Moss, Chula Vista, CA 91911
MLS# 260016838Listed by: KELLER WILLIAMS REALTY - Open Mon, 4 to 6pmNew
 $949,000Active4 beds 3 baths1,652 sq. ft.
856 Elm Ave, Chula Vista, CA 91911
MLS# 260016636Listed by: COMPASS - New
 $559,000Active3 beds 2 baths1,168 sq. ft.
598 Telegraph Canyon Rd #D, Chula Vista, CA 91910
MLS# 260016596SDListed by: LUXOME REALTY, INC. - New
 $549,999Active3 beds 2 baths1,102 sq. ft.
1450 Melrose Avenue #27, Chula Vista, CA 91911
MLS# PTP2605042Listed by: REAL BROKER - New
 $920,000Active4 beds 3 baths2,265 sq. ft.
182 El Capitan Dr, Chula Vista, CA 91911
MLS# PTP2605125Listed by: REALTY ONE GROUP PACIFIC - Coming Soon
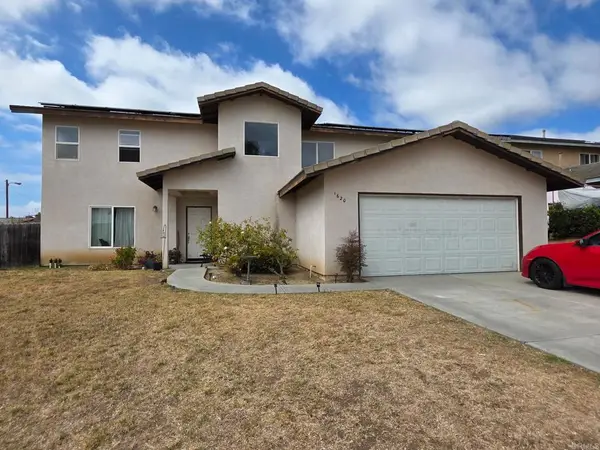 $750,000Coming Soon3 beds 2 baths
1620 Sycamore Dr, Chula Vista, CA 91911
MLS# PTP2605121Listed by: COLDWELL BANKER WEST - New
 $849,900Active4 beds 3 baths1,982 sq. ft.
845 Hana Ave #2, Chula Vista, CA 91911
MLS# 260016458Listed by: EXP REALTY OF CALIFORNIA, INC. - New
 $199,999Active2 beds 2 baths1,366 sq. ft.
121 Orange #SPC 39, Chula Vista, CA 91911
MLS# PTP2605096Listed by: SHOPPINGSDHOUSES - New
 $599,000Active4 beds 2 baths1,296 sq. ft.
1434 Hilltop Drive #30, Chula Vista, CA 91911
MLS# OC26146634Listed by: EXP REALTY OF SOUTHERN CALIFORNIA, INC - New
 $979,000Active4 beds 3 baths1,868 sq. ft.
90 K St, Chula Vista, CA 91911
MLS# 260016362Listed by: RE/MAX CONNECTIONS - New
 $915,000Active4 beds 3 baths1,982 sq. ft.
813 Mateo Street, Chula Vista, CA 91911
MLS# PTP2605079Listed by: KELLER WILLIAMS LA JOLLA - New
 $800,000Active3 beds 2 baths1,702 sq. ft.
63 L, Chula Vista, CA 91911
MLS# PTP2605065Listed by: COLDWELL BANKER WEST - New
 $549,999Active3 beds 2 baths1,102 sq. ft.
1450 Melrose Avenue #27, Chula Vista, CA 91911
MLS# PTP2605042Listed by: REAL BROKER - New
 $880,000Active4 beds 2 baths1,248 sq. ft.
520 Tallow Ct, Chula Vista, CA 91911
MLS# PTP2605035Listed by: BERKSHIRE HATHAWAY HOMESERVICE - New
 $690,000Active2 beds 1 baths879 sq. ft.
1015 4th Ave., Chula Vista, CA 91911
MLS# 260016120Listed by: I2I REAL ESTATE AND MORTGAGE,  $699,000Active4 beds 2 baths1,641 sq. ft.
329 E Rienstra Street, Chula Vista, CA 91911
MLS# PTP2604995Listed by: COLDWELL BANKER WEST $699,000Active3 beds 2 baths1,674 sq. ft.
420 Emerson, Chula Vista, CA 91911
MLS# 260016005Listed by: PACIFIC SOTHEBY'S INT'L REALTY $999,000Active6 beds 3 baths2,090 sq. ft.
172/172A Jamul Ave, Chula Vista, CA 91911
MLS# 260015842Listed by: COMPASS $895,000Pending4 beds 2 baths1,446 sq. ft.
1135 Monterey Ave, Chula Vista, CA 91911
MLS# 260015807SDListed by: KELLER WILLIAMS LA JOLLA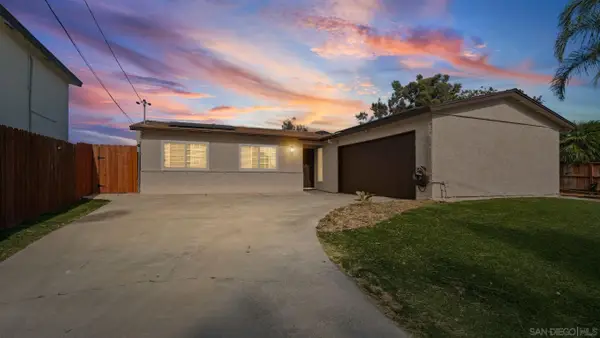 $890,000Active5 beds 2 baths1,248 sq. ft.
1559 Marble, Chula Vista, CA 91911
MLS# 260015794Listed by: COMPASS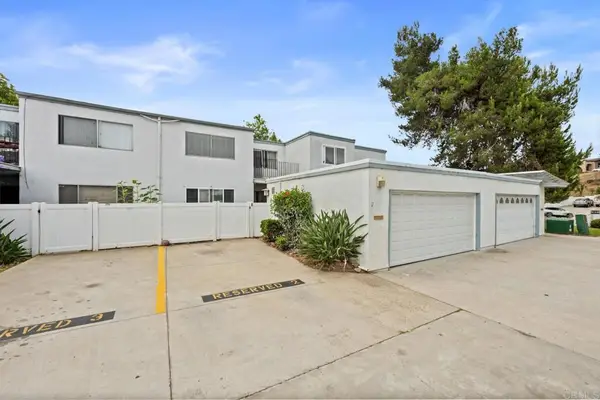 $549,999Active3 beds 2 baths1,800 sq. ft.
1640 Maple Drive #2, Chula Vista, CA 91911
MLS# PTP2604920Listed by: SHOPPINGSDHOUSES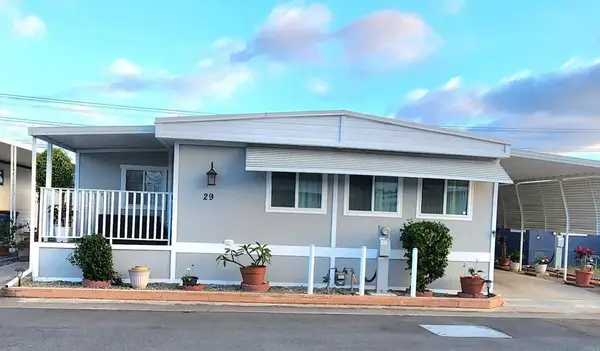 $189,000Active2 beds 2 baths1,344 sq. ft.
445 Orange Ave. Spc #29, Chula Vista, CA 91911
MLS# PTP2604916Listed by: PREMIER AGENCY R.E. INC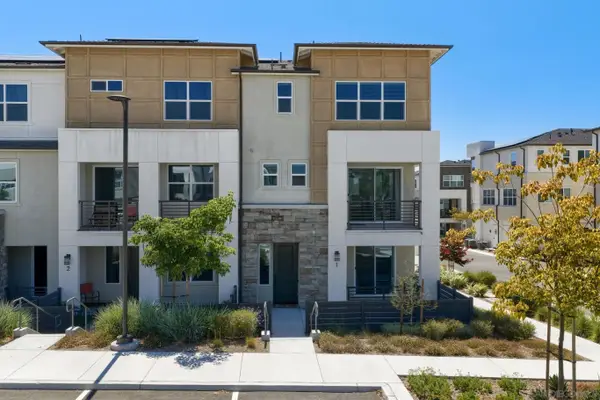 $779,900Active4 beds 4 baths2,052 sq. ft.
792 Vada St. #1, Chula Vista, CA 91911
MLS# 260015638Listed by: REDFIN $775,000Active4 beds 4 baths1,810 sq. ft.
789 Vada #5, Chula Vista, CA 91911
MLS# SB26138532Listed by: CIRCLE REAL ESTATE $795,000Active0 Acres
807 Ada #55 par2, Chula Vista, CA 91911
MLS# 260015455Listed by: PRINCIPLE REAL ESTATE GROUP $1,099,700Active4 beds 3 baths2,467 sq. ft.
1498 Ewing Drive, Chula Vista, CA 91911
MLS# PTP2604843Listed by: FINEST CITY HOMES $599,000Active3 beds 2 baths1,434 sq. ft.
1731 Melrose Avenue #45, Chula Vista, CA 91911
MLS# PTP2604824Listed by: REAL BROKER $934,000Pending5 beds 3 baths1,824 sq. ft.
1410 Melrose Avenue, Chula Vista, CA 91911
MLS# PTP2604815Listed by: COLDWELL BANKER WEST $700,000Pending3 beds 2 baths1,110 sq. ft.
1209 Nolan Ave, Chula Vista, CA 91911
MLS# PTP2604805Listed by: LPT REALTY, INC. $699,999Active3 beds 3 baths1,320 sq. ft.
766 Makani Street #5, Chula Vista, CA 91911
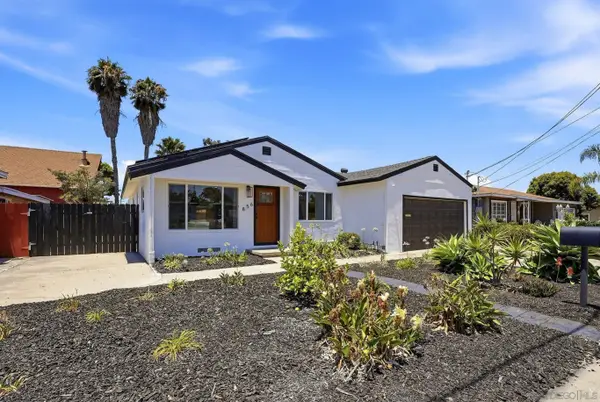
MLS# PTP2604773Listed by: ROA CALIFORNIA INC $1,140,000Active3 beds 2 baths1,532 sq. ft.
455 Nickman, Chula Vista, CA 91911
MLS# PTP2604789Listed by: REALTY ONE GROUP PACIFIC $824,900Pending-- beds -- baths
873 Riverlawn, Chula Vista, CA 91911
MLS# NDP2606014Listed by: KATHLEEN BAKER PROPERTIES $1,599,900Active-- beds -- baths
1835 Rios Avenue, Chula Vista, CA 91911
MLS# PTP2604762Listed by: LEAL REAL ESTATE GROUP, INC $1,199,900Active-- beds -- baths
1839 Rios Avenue, Chula Vista, CA 91911
MLS# PTP2604766Listed by: LEAL REAL ESTATE GROUP, INC $1,699,900Active-- beds -- baths
353-357 Palm Avenue, Chula Vista, CA 91911
MLS# PTP2604769Listed by: LEAL REAL ESTATE GROUP, INC $1,599,900Active5 beds 5 baths2,557 sq. ft.
1835 Rios Avenue #1-3, Chula Vista, CA 91911
MLS# PTP2604759Listed by: LEAL REAL ESTATE GROUP, INC $1,199,900Active4 beds 3 baths1,415 sq. ft.
1839 Rios Avenue #1 & 2, Chula Vista, CA 91911
MLS# PTP2604764Listed by: LEAL REAL ESTATE GROUP, INC $999,000Active6 beds 3 baths1,995 sq. ft.
172 Jamul, Chula Vista, CA 91911
MLS# 260015099Listed by: COMPASS $999,900Active6 beds 3 baths1,995 sq. ft.
172 Jamul Avenue, Chula Vista, 91911
MLS# 12679759Listed by: COMPASS $746,900Active4 beds 3 baths1,810 sq. ft.
881 Obediah Loop #4, Chula Vista, CA 91911
MLS# 260015084SDListed by: MARK SCHULTZ BROKER $559,900Pending2 beds 3 baths1,143 sq. ft.
866 Kili Street #1, Chula Vista, CA 91911
MLS# 260015085SDListed by: MARK SCHULTZ BROKER $699,000Pending3 beds 3 baths1,450 sq. ft.
719 Caminito Valiente, Chula Vista, CA 91911
MLS# PTP2604695Listed by: CABRILLO MORTGAGE & REALTY SVC $819,500Pending3 beds 2 baths1,425 sq. ft.
64 E Donohoe Street, Chula Vista, CA 91911
MLS# PTP2604702Listed by: FINEST CITY HOMES $819,500Pending3 beds 2 baths1,425 sq. ft.
64 E Donohoe Street, Chula Vista, CA 91911
MLS# PTP2604702Listed by: FINEST CITY HOMES $259,000Active2 beds 2 baths1,247 sq. ft.
1148 Third Ave #SPC 97, Chula Vista, CA 91911
MLS# 260014876Listed by: EXP REALTY OF CALIFORNIA, INC.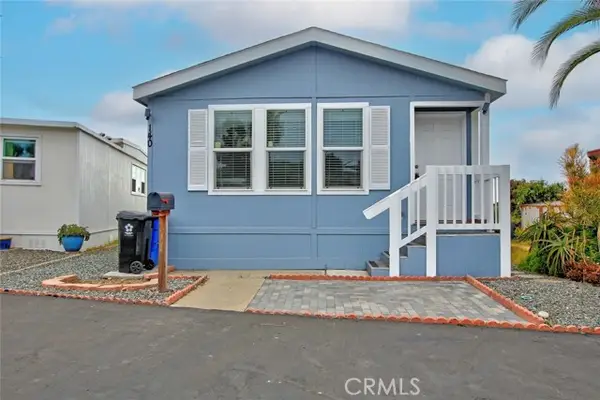 $189,900Active2 beds 2 baths960 sq. ft.
1425 2nd Ave #140, Chula Vista, CA 91911
MLS# CV26131751Listed by: 1ST CLASS REALTY GROUP $400,000Pending2 beds 2 baths1,004 sq. ft.
1420 Hilltop Drive #301, Chula Vista, CA 91911
MLS# PTP2604624Listed by: BERKSHIRE HATHAWAY HOMESERVICE $760,000Pending3 beds 2 baths1,485 sq. ft.
485 Montcalm Street, Chula Vista, CA 91911
MLS# NDP2605784Listed by: COLDWELL BANKER REALTY $389,000Pending1 beds 1 baths720 sq. ft.
705 Paso De Luz #201, Chula Vista, CA 91911
MLS# PTP2604607Listed by: PREMIUM REAL ESTATE SERVICES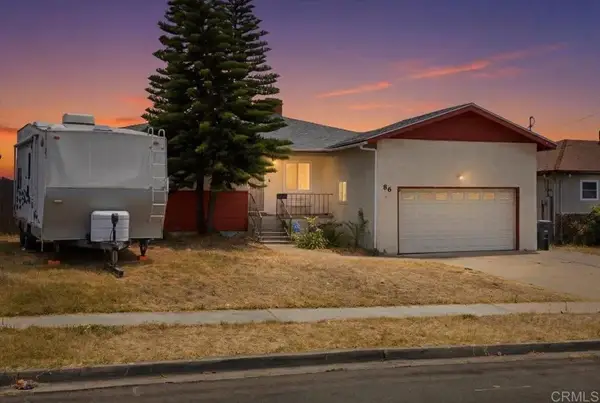 $825,000Pending4 beds 2 baths2,261 sq. ft.
86 E Emerson Street, Chula Vista, CA 91911
MLS# PTP2604586Listed by: FINEST CITY HOMES $795,000Active4 beds 2 baths1,816 sq. ft.
807 Ada, Chula Vista, CA 91911
MLS# 260014381Listed by: PRINCIPLE REAL ESTATE GROUP $559,000Pending3 beds 2 baths1,180 sq. ft.
1555 Mendocino Drive #145, Chula Vista, CA 91911
MLS# NDP2605676Listed by: WILLIS ALLEN REAL ESTATE $719,950Pending4 beds 3 baths2,172 sq. ft.
29 L Street, Chula Vista, CA 91911
MLS# CV26127549Listed by: COLDWELL BANKER ICON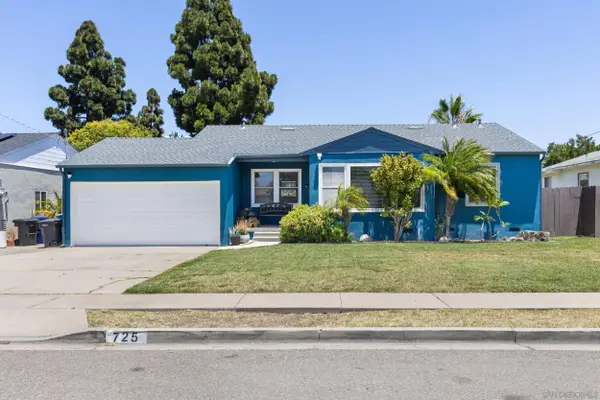 $790,000Pending3 beds 1 baths1,133 sq. ft.
725 Garrett Avenue, Chula Vista, CA 91910
MLS# 260014230Listed by: EXP REALTY OF CALIFORNIA, INC. $699,900Pending3 beds 2 baths1,032 sq. ft.
444 E Oxford Street, Chula Vista, CA 91911
MLS# PTP2604492Listed by: REAL BROKER $1,700,000Active0.85 Acres
0 Spruce Road, Chula Vista, CA 91911
MLS# PTP2604483Listed by: HOME INVESTMENT CENTER $585,000Active2 beds 3 baths1,209 sq. ft.
816 Makani Street #5, Chula Vista, CA 91911
MLS# 260013984SDListed by: VINEYARD REALTY $859,000Active3 beds 2 baths1,788 sq. ft.
1453 Nolan Court, Chula Vista, CA 91911
MLS# PTP2604423Listed by: COLDWELL BANKER WEST $790,000Pending3 beds 2 baths1,040 sq. ft.
152 E Oxford Street, Chula Vista, CA 91911
MLS# 260013839Listed by: CONNECT REALTY INC $649,000Pending4 beds 1 baths1,209 sq. ft.
36 E Prospect Street, Chula Vista, CA 91911
MLS# PTP2604395Listed by: REALTY ONE GROUP PACIFIC $649,000Pending4 beds 1 baths1,209 sq. ft.
36 E Prospect Street, Chula Vista, CA 91911
MLS# PTP2604395Listed by: REALTY ONE GROUP PACIFIC $850,000Active4 beds 2 baths1,380 sq. ft.
223 Zenith Street, Chula Vista, CA 91911
MLS# PTP2604386Listed by: ALLIED COAST REALTY INC. $850,000Active4 beds 2 baths1,380 sq. ft.
223 Zenith Street, Chula Vista, CA 91911
MLS# PTP2604386Listed by: ALLIED COAST REALTY INC.
 $809,900Pending4 beds 3 baths1,042 sq. ft.
1457 Max Avenue, Chula Vista, CA 91911
MLS# PTP2604383Listed by: CENTURY 21 AFFILIATED $675,000Pending4 beds 3 baths976 sq. ft.
734 Anita Street, Chula Vista, CA 91911
MLS# PTP2604362Listed by: EXP REALTY OF SOUTHERN CALIF. $399,000Active2 beds 1 baths836 sq. ft.
321 Rancho Dr #19, Chula Vista, CA 91911
MLS# PTP2604356Listed by: COLDWELL BANKER WEST $535,000Active2 beds 2 baths1,125 sq. ft.
215 Camlau #B, Chula Vista, CA 91911
MLS# 260013654SDListed by: REAL BROKER $950,000Pending3 beds 3 baths1,923 sq. ft.
623 Alber, Chula Vista, CA 91911
MLS# 260013583SDListed by: REDFIN CORPORATION $799,000Active4 beds 3 baths1,715 sq. ft.
797 Mateo St. #1, Chula Vista, CA 91911
MLS# 260013544Listed by: COMPASS $985,000Pending4 beds 3 baths1,999 sq. ft.
905 Stefas Ct, Chula Vista, CA 91911
MLS# 260013534Listed by: VIP PREMIER REALTY CORP $673,980Active3 beds 3 baths1,644 sq. ft.
916 Avenida Neptuno #2, Chula Vista, CA 91911
MLS# NDP2605330Listed by: SHEA ADVANTAGE $18,100,000Active112 beds 110 baths50,960 sq. ft.
1035 4th Avenue, Chula Vista, CA 91911
MLS# 260013438Listed by: MARCUS & MILLICHAP $650,000Pending3 beds 2 baths1,028 sq. ft.
1668 Ocala Ave, Chula Vista, CA 91911
MLS# 260013409Listed by: EXP REALTY OF CALIFORNIA, INC. $460,000Active2 beds 2 baths920 sq. ft.
1687 Melrose Ave #D, Chula Vista, CA 91911
MLS# 260013383SDListed by: DOUGLAS ELLIMAN OF CALIFORNIA, INC.- Open Sat, 12 to 1pm
 $739,000Active3 beds 2 baths1,384 sq. ft.
1071-1069 Madison Ave, Chula Vista, CA 91911
MLS# 260013229Listed by: SELECT PREMIER PROPERTIES - Open Sat, 12 to 1pm
 $739,000Active3 beds 2 baths1,384 sq. ft.
1071 1069 Madison Ave, Chula Vista, CA 91911
MLS# 260013229SDListed by: SELECT PREMIER PROPERTIES  $600,000Active2 beds 2 baths1,034 sq. ft.
717 Caminito Valiente, Chula Vista, CA 91911
MLS# IG26117539Listed by: KW COLLEGE PARK $685,000Pending2 beds 1 baths1,008 sq. ft.
1429 Nolan Ave, Chula Vista, CA 91911
MLS# 260013085Listed by: COLDWELL BANKER REALTY $715,000Active4 beds 3 baths1,623 sq. ft.
784 Mateo #1, Chula Vista, CA 91911
MLS# NP26116586Listed by: THE VANTAGE REAL ESTATE GROUP,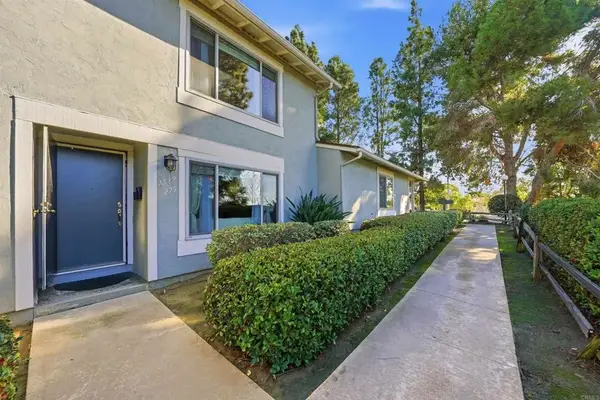 $610,000Pending3 beds 3 baths1,440 sq. ft.
1539 Sonora Dr #275, Chula Vista, CA 91911
MLS# PTP2604102Listed by: EXP REALTY OF CALIFORNIA, INC. $610,000Pending3 beds 3 baths1,440 sq. ft.
1539 Sonora Dr #275, Chula Vista, CA 91911
MLS# PTP2604102Listed by: EXP REALTY OF CALIFORNIA, INC.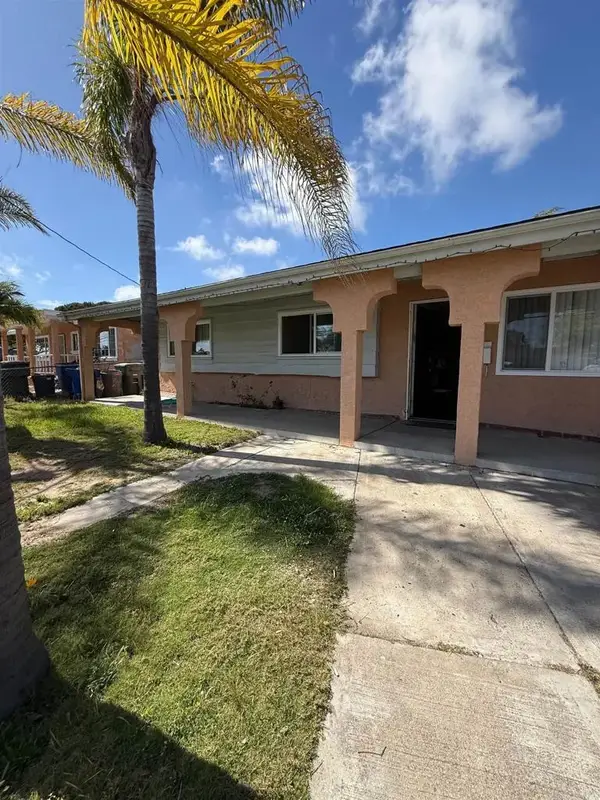 $620,000Pending4 beds 2 baths1,208 sq. ft.
107 E Oxford Street, Chula Vista, CA 91911
MLS# PTP2604085Listed by: SHOPPINGSDHOUSES $620,000Pending4 beds 2 baths1,208 sq. ft.
107 E Oxford Street, Chula Vista, CA 91911
MLS# PTP2604085Listed by: SHOPPINGSDHOUSES $1,329,000Pending4 beds 3 baths2,168 sq. ft.
155 Walnut Drive, Chula Vista, CA 91911
MLS# PTP2604064Listed by: COLDWELL BANKER WEST $1,069,000Active5 beds 3 baths2,116 sq. ft.
1571 Max, Chula Vista, CA 91911
MLS# 260012831Listed by: REALTY ONE GROUP PACIFIC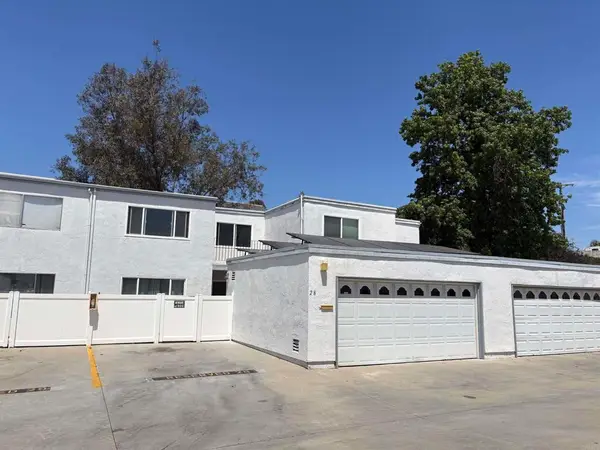 $579,000Active4 beds 3 baths1,576 sq. ft.
1640 Maple Dr #28, Chula Vista, CA 91911
MLS# PTP2604033Listed by: COLDWELL BANKER WEST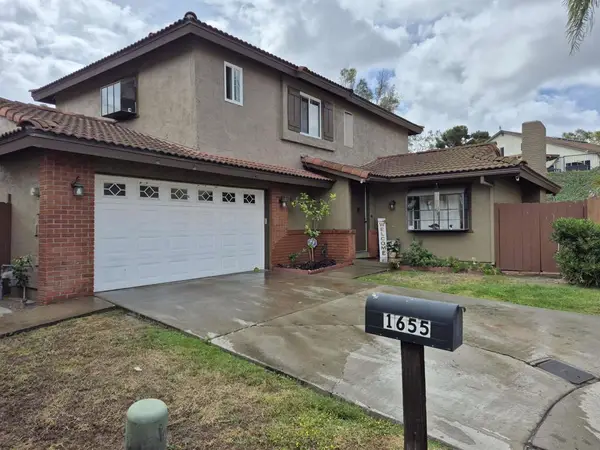 $879,500Pending4 beds 3 baths1,731 sq. ft.
1655 Point Mugu Court, Chula Vista, CA 91911
MLS# 260010917SDListed by: SIAMAK T. RAHMANI, BROKER $55,000Pending2 beds 2 baths1,080 sq. ft.
521 Orange Ave #128, Chula Vista, CA 91911
MLS# PTP2603956Listed by: ALL HOMES SAN DIEGO $244,900Pending0 Acres
521 Orange Ave, Chula Vista, CA 91911
MLS# PTP2603957Listed by: ALL HOMES SAN DIEGO $899,000Pending6 beds 3 baths2,087 sq. ft.
1305 Crann Ave 1-02, Chula Vista, CA 91911
MLS# 260014949Listed by: COMPASS $879,500Pending4 beds 3 baths1,731 sq. ft.
1655 Point Mugu Court, Cula Vista, CA 91911
MLS# 260010917Listed by: SIAMAK T. RAHMANI, BROKER $1,350,000Pending-- beds -- baths2,689 sq. ft.
462 Emerson Street, Chula Vista, CA 91911
MLS# PTP2603890Listed by: LPT REALTY, INC. $629,900Pending2 beds 3 baths1,143 sq. ft.
832 Makani #1, Chula Vista, CA 91911
MLS# 260012231Listed by: EXP REALTY OF CALIFORNIA, INC. $1,800,000Active-- beds -- baths
1450 Frontage Road, Chula Vista, CA 91911
MLS# 260012204Listed by: REAL PROPERTIES GROUP $36,000,000Active13 beds 11 baths
Km 1 Villa Del Mar Avenue, TEHUAMIXTLE, 48400
MLS# 25-3335Listed by: KELLER WILLIAMS REALTY SANTA BARBARA $950,000Pending5 beds 3 baths2,620 sq. ft.
525 Manzanita Street, Chula Vista, CA 91911
MLS# 260011869Listed by: CONNECT REALTY INC $800,000Pending4 beds 2 baths1,688 sq. ft.
71 E L Street, Chula Vista, CA 91911
MLS# 260011706Listed by: ROA CALIFORNIA INC $559,900Pending2 beds 3 baths1,143 sq. ft.
858 Kili Street #1, Chula Vista, CA 91911
MLS# 260011455SDListed by: MARK SCHULTZ BROKER $706,900Pending4 beds 3 baths1,680 sq. ft.
881 Obediah Loop #3, Chula Vista, CA 91911
MLS# 260011457SDListed by: MARK SCHULTZ BROKER $676,900Pending4 beds 3 baths1,320 sq. ft.
895 Jude Drive #6, Chula Vista, CA 91911
MLS# 260011458SDListed by: MARK SCHULTZ BROKER $699,999Active4 beds 3 baths1,782 sq. ft.
778 Ada Street #1, Chula Vista, CA 91911
MLS# CL26832237Listed by: RESIDENT GROUP $830,000Active5 beds 3 baths1,652 sq. ft.
1650 Walnut Drive, Chula Vista, CA 91911
MLS# PTP2603144Listed by: PREMIER AGENCY R.E. INC $849,900Active4 beds 2 baths1,316 sq. ft.
1250 Waxwing, Chula Vista, CA 91911
MLS# 260011231Listed by: ALEXANDRA VINSON SHEPARD $699,000Active3 beds 2 baths1,262 sq. ft.
1385 Melrose, Chula Vista, CA 91911
MLS# PTP2603506Listed by: PALISADE REALTY, INC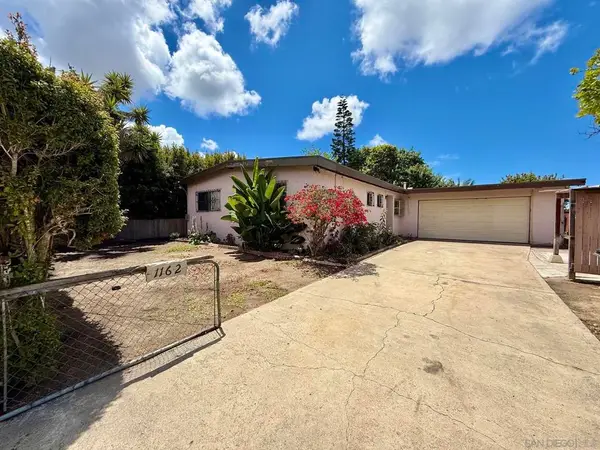 $749,000Pending3 beds 2 baths1,344 sq. ft.
1162 Ocelot Ave, Chula Vista, CA 91911
MLS# 260011043SDListed by: ONE MISSION REALTY $699,000Active3 beds 2 baths1,262 sq. ft.
1385 Melrose, Chula Vista, CA 91911
MLS# PTP2603506Listed by: PALISADE REALTY, INC $159,000Active2 beds 1 baths800 sq. ft.
501 Anita Street Spc 50, Chula Vista, CA 91911
MLS# NDP2604356Listed by: DE JOUR REALTY $999,999Active5 beds 3 baths2,048 sq. ft.
317 Quail Place, Chula Vista, CA 91911
MLS# PTP2603348Listed by: PREMIER AGENCY R.E. INC $999,999Active5 beds 3 baths2,048 sq. ft.
317 Quail Place, Chula Vista, CA 91911
MLS# PTP2603348Listed by: PREMIER AGENCY R.E. INC $720,000Active3 beds 2 baths1,900 sq. ft.
162 Oneida Street, Chula Vista, CA 91911
MLS# PTP2603275Listed by: BEEN NETWORK PROPERTIES $789,000Active3 beds 2 baths1,403 sq. ft.
855 Jefferson Avenue, Chula Vista, CA 91911
MLS# PTP2603199Listed by: RE/MAX CITY REAL ESTATE $625,000Pending3 beds 3 baths1,400 sq. ft.
1545 Sonora #231, Chula Vista, CA 91911
MLS# 260010160SDListed by: REDFIN CORPORATION $830,000Active5 beds 3 baths1,652 sq. ft.
1650 Walnut Drive, Chula Vista, CA 91911
MLS# PTP2603144Listed by: PREMIER AGENCY R.E. INC $210,000Pending2 beds 2 baths1,450 sq. ft.
444 Anita Street #95, Chula Vista, CA 91911
MLS# PTP2603129Listed by: FINEST CITY HOMES $175,000Pending2 beds 2 baths816 sq. ft.
1148 Third Ave #35, Chula Vista, CA 91911
MLS# PTP2603128Listed by: COLDWELL BANKER WEST $375,000Active2 beds 2 baths1,368 sq. ft.
521 Orange Avenue #SPC 99, Chula Vista, CA 91911
MLS# NDP2604115Listed by: MYLENE MERLO, BROKER $385,000Active2 beds 1 baths889 sq. ft.
1679 Melrose Avenue #H, Chula Vista, CA 91911
MLS# PTP2602968Listed by: COMPASS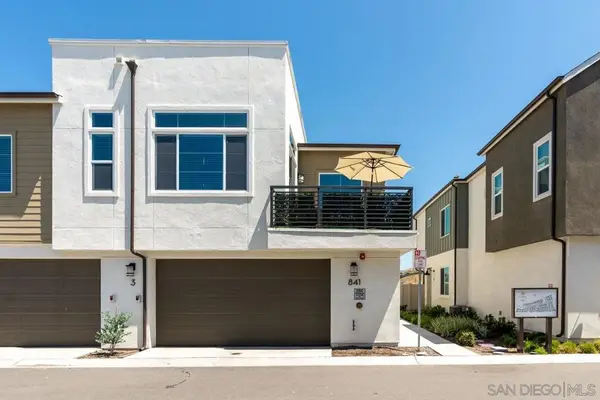 $729,000Active3 beds 2 baths1,507 sq. ft.
841 Hana Ave #3, Chula Vista, CA 91911
MLS# 260009363SDListed by: BERKSHIRE HATHAWAY HOMESERVICES CALIFORNIA PROPERTIES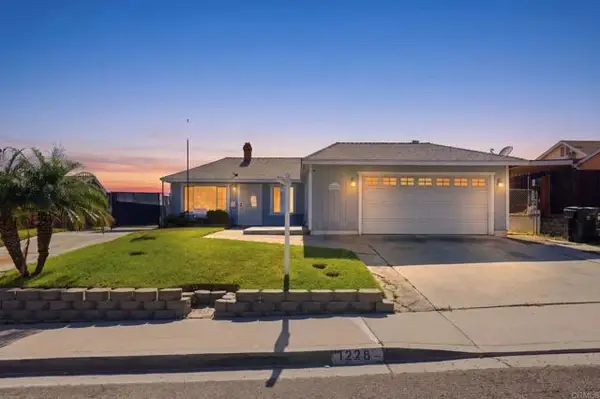 $800,000Pending4 beds 2 baths1,316 sq. ft.
1228 Oleander, Chula Vista, CA 91911
MLS# CRPTP2602636Listed by: HORIZON PACIFIC REALTY $249,000Pending3 beds 2 baths1,344 sq. ft.
501 Anita St #154, Chula Vista, CA 91911
MLS# 260008556Listed by: EXP REALTY OF SOUTHERN CALIFORNIA, INC. $249,000Pending3 beds 2 baths1,344 sq. ft.
501 Anita St #154, Chula Vista, CA 91911
MLS# 260008556SDListed by: EXP REALTY OF SOUTHERN CALIFORNIA, INC. $784,999Active3 beds 2 baths1,000 sq. ft.
24 Palomar Street, Chula Vista, CA 91911
MLS# PTP2602671Listed by: REAL BROKER $775,000Pending4 beds 2 baths1,484 sq. ft.
245 Palm Avenue, Chula Vista, CA 91911
MLS# PTP2602577Listed by: GOLDEN EMPIRE REALTY $1,599,999Active-- beds -- baths
1325 Fifth Avenue, Chula Vista, CA 91911
MLS# PTP2602505Listed by: REAL BROKER $675,000Pending3 beds 2 baths1,040 sq. ft.
1221 Melrose Ave, Chula Vista, CA 91911
MLS# 260007933SDListed by: CENTURY 21 AFFILIATED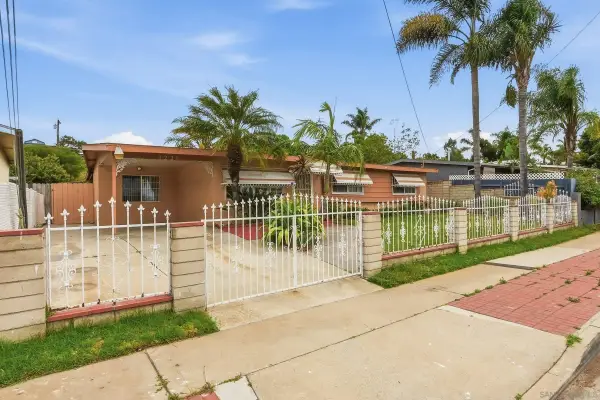 $675,000Pending3 beds 2 baths1,040 sq. ft.
1221 Melrose Ave, Chula Vista, CA 91911
MLS# 260007933Listed by: CENTURY 21 AFFILIATED $1,350,000Pending7 beds 5 baths2,689 sq. ft.
462 464 Emerson Street, Chula Vista, CA 91911
MLS# PTP2602387Listed by: LPT REALTY, INC.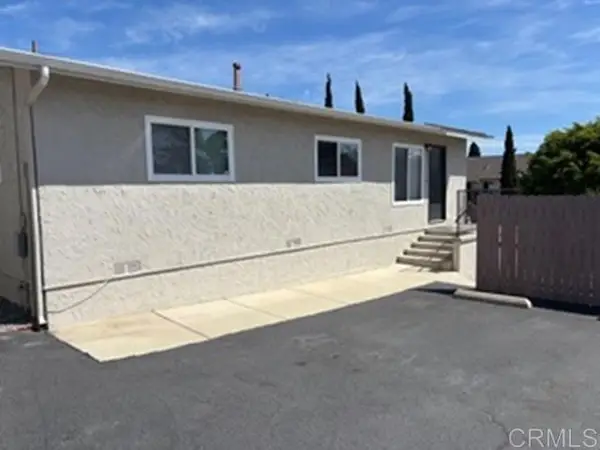 $1,250,000Active-- beds -- baths
479 Shy Lane, Chula Vista, CA 91911
MLS# PTP2602345Listed by: STEVE MARKLEY, REALTY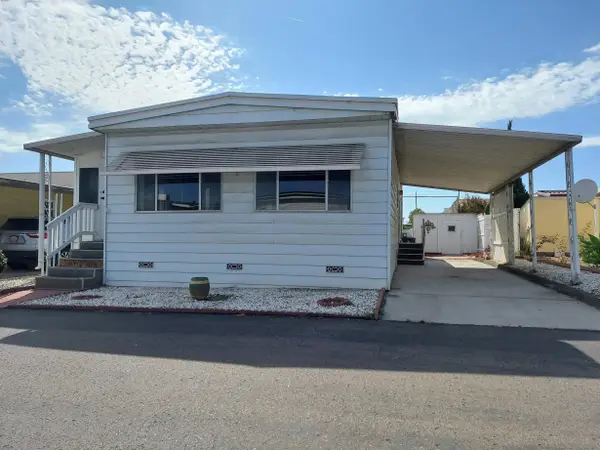 $135,000Active2 beds 2 baths960 sq. ft.
501 Anita Street #71, Chula Vista, CA 91911
MLS# 260007333Listed by: LEAL REAL ESTATE GROUP, INC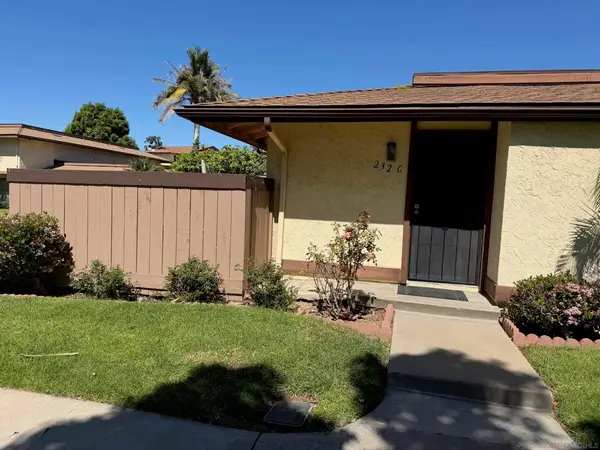 $499,900Pending2 beds 1 baths900 sq. ft.
232 Otay Valley Rd #C, Chula Vista, CA 91911
MLS# 260007332SDListed by: AARE $999,999Pending4 beds 3 baths2,262 sq. ft.
1565 San Pedro Point Court, Chula Vista, CA 91911
MLS# PTP2602008Listed by: COSTA MODERN PROPERTIES $1,999,095Active4 beds 3 baths2,212 sq. ft.
881 First Avenue, Chula Vista, CA 91911
MLS# PTP2601997Listed by: COLDWELL BANKER WEST $180,000Active2 beds 2 baths1,023 sq. ft.
1425 2nd Avenue #116, Chula Vista, CA 91911
MLS# PTP2601741Listed by: COLDWELL BANKER WEST $849,999Active4 beds 3 baths1,715 sq. ft.
821 Mateo Street #1, Chula Vista, CA 91911
MLS# NDP2601888Listed by: BERKSHIRE HATHAWAY HOMESERVICE $529,000Pending3 beds 3 baths1,434 sq. ft.
1731 Melrose Avenue #44, Chula Vista, CA 91911
MLS# PTP2601490Listed by: CENTURY 21 AFFILIATED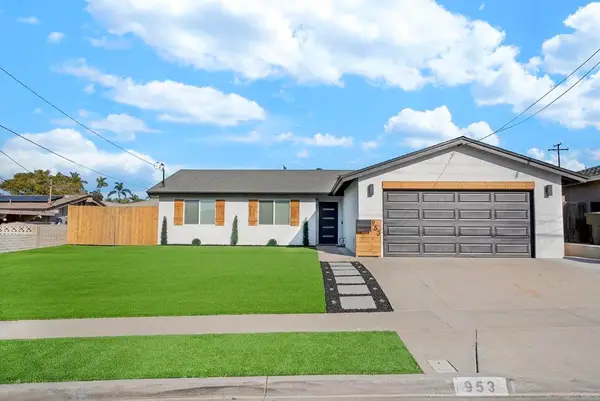 $999,900Active4 beds 3 baths1,542 sq. ft.
953 Maria Way, Chula Vista, CA 91911
MLS# PTP2602142Listed by: CENTURY 21 AFFILIATED $865,000Active4 beds 3 baths1,715 sq. ft.
769 Mateo Street #1, Chula Vista, CA 91911
MLS# PTP2601261Listed by: COLDWELL BANKER WEST $194,000Active3 beds 2 baths712 sq. ft.
1425 Second #105, Chula Vista, CA 91911
MLS# PTP2600861Listed by: KEY TO YOUR HOUSE REALTY $699,000Pending3 beds 3 baths1,644 sq. ft.
917 Avenida Neptuno #3, Chula Vista, CA 91911
MLS# NDP2600854Listed by: SHEA ADVANTAGE $320,000Pending3 beds 2 baths1,100 sq. ft.
521 Orange Ave West #24, Chula Vista, CA 91911
MLS# 2600479Listed by: COLDWELL BANKER REALTY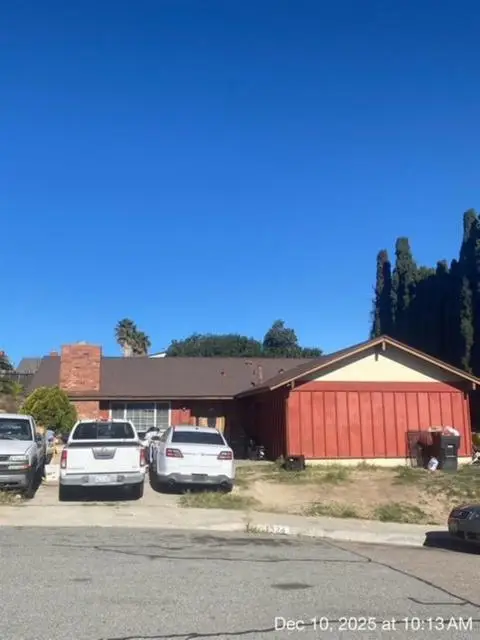 $625,000Active3 beds 2 baths1,392 sq. ft.
1324 Park Drive, Chula Vista, CA 91911
MLS# NDP2511484Listed by: BERKSHIRE HATHAWAY HOMESERVICE $540,000Active3 beds 2 baths1,228 sq. ft.
265 Rancho Dr #C, Chula Vista, CA 91911
MLS# SW26019763Listed by: REAL BROKERAGE TECHNOLOGIES $1,385,000Pending-- beds -- baths3,391 sq. ft.
1116 Second Avenue, Chula Vista, CA 91911
MLS# PTP2508470Listed by: COLDWELL BANKER WEST $689,900Pending4 beds 3 baths1,494 sq. ft.
1155 Ariat Street #2, Chula Vista, CA 91911
MLS# 250039950SDListed by: MARK SCHULTZ BROKER $164,900Active3 beds 1 baths944 sq. ft.
1100 Industrial #C34, Chula Vista, CA 91911
MLS# NDP2509247Listed by: REAL BROKER- $125,000Pending0 Acres
0 Banner Ave #36, Chula Vista, CA 91911
MLS# 190016200Listed by: LPT REALTY,INC  $596,900Pending2 beds 3 baths1,141 sq. ft.
848 Makani #2, Chula Vista, CA 91911
MLS# 250030635SDListed by: MARK SCHULTZ BROKER $590,900Pending2 beds 3 baths1,209 sq. ft.
852 Makani Street #7, Chula Vista, CA 91911
MLS# 250029207SDListed by: MARK SCHULTZ BROKER $250,000Pending2 beds 2 baths1,080 sq. ft.
1148 3rd Avenue #125, Chula Vista, CA 91911
MLS# PTP2403392Listed by: COLDWELL BANKER WEST $850,000Pending4 beds 3 baths1,807 sq. ft.
1030 Helix Ave, Chula Vista, CA 91911
MLS# 240002374SDListed by: EXP REALTY OF CALIFORNIA, INC. $825,000Pending3 beds 2 baths1,560 sq. ft.
1139 Cuyamaca, Chula Vista, CA 91911
MLS# CRPTP2400606Listed by: COLDWELL BANKER WEST $125,000Pending0.08 Acres
0 Banner Ave, Chula Vista, CA 91911
MLS# 190016200Listed by: LPT REALTY,INC
Local realty services provided by:CENTURY 21 Masters, CENTURY 21 Affiliated, CENTURY 21 North East, CENTURY 21 Wildwood Properties, Inc.
The information being provided by Mlslistings Inc is for the consumer's personal, non-commercial use and may not be used for any purpose other than to identify prospective properties consumer may be interested in purchasing. Any information relating to real estate for sale referenced on this web site comes from the Internet Data Exchange (IDX) program of the Mlslistings Inc. CENTURY 21 Masters is not a Multiple Listing Service (MLS), nor does it offer MLS access. This website is a service of CENTURY 21 Masters, a broker participant of Mlslistings Inc. This web site may reference real estate listing(s) held by a brokerage firm other than the broker and/or agent who owns this web site.
The accuracy of all information, regardless of source, including but not limited to open house information, square footages and lot sizes, is deemed reliable but not guaranteed and should be personally verified through personal inspection by and/or with the appropriate professionals. The data contained herein is copyrighted by Mlslistings Inc and is protected by all applicable copyright laws. Any unauthorized dissemination of this information is in violation of copyright laws and is strictly prohibited.
Properties in listings may have been sold or may no longer be available.
Copyright 2026 Mlslistings Inc. All rights reserved. CAREIL Member Broker: Randy Thompson
This information is deemed reliable but not guaranteed. You should rely on this information only to decide whether or not to further investigate a particular property. BEFORE MAKING ANY OTHER DECISION, YOU SHOULD PERSONALLY INVESTIGATE THE FACTS (e.g. square footage and lot size) with the assistance of an appropriate professional. You may use this information only to identify properties you may be interested in investigating further. All uses except for personal, non-commercial use in accordance with the foregoing purpose are prohibited. Redistribution or copying of this information, any photographs or video tours is strictly prohibited. This information is derived from the Internet Data Exchange (IDX) service provided by San Diego MLS®. Displayed property listings may be held by a brokerage firm other than the broker and/or agent responsible for this display. The information and any photographs and video tours and the compilation from which they are derived is protected by copyright. Compilation © 2020 San Diego MLS®, Inc. SANDICOR Member Broker: Nikki Coppa
The information being provided by California Regional MLS (Southern California) is for the consumer's personal, non-commercial use and may not be used for any purpose other than to identify prospective properties consumer may be interested in purchasing. Any information relating to real estate for sale referenced on this web site comes from the Internet Data Exchange (IDX) program of the California Regional MLS (Southern California). CENTURY 21 Affiliated is not a Multiple Listing Service (MLS), nor does it offer MLS access. This website is a service of CENTURY 21 Affiliated, a broker participant of California Regional MLS (Southern California). This web site may reference real estate listing(s) held by a brokerage firm other than the broker and/or agent who owns this web site.
The accuracy of all information, regardless of source, including but not limited to open house information, square footages and lot sizes, is deemed reliable but not guaranteed and should be personally verified through personal inspection by and/or with the appropriate professionals. The data contained herein is copyrighted by California Regional MLS (Southern California) and is protected by all applicable copyright laws. Any unauthorized dissemination of this information is in violation of copyright laws and is strictly prohibited.
Copyright 2021 California Regional MLS (Southern California). All rights reserved. CRMLS Member Broker: Nikki Coppa
Copyright 2026 Midwest Real Estate Data LLC. All rights reserved. The data relating to real estate for sale on this web site comes in part from the Broker Reciprocity Program of the Midwest Real Estate Data LLC. Listing information is deemed reliable but not guaranteed. MLSNI Member Broker: Nate Brown
Popular searches near 91911
Popular neighborhoods near 91911
- Countryside, Chula Vista homes for sale
- Downtown Chula Vista, Chula Vista homes for sale
- Egger Highlands, San Diego homes for sale
- Heritage, Chula Vista homes for sale
- Lincoln Acres, National City homes for sale
- Montecito Ridge, Chula Vista homes for sale
- Nestor, San Diego homes for sale
- Ocean View Hills, San Diego homes for sale
- Oneonta, Imperial Beach homes for sale
- Otay Mesa West, San Diego homes for sale
- Otay Ranch Village 3 North, Chula Vista homes for sale
- Palm City, San Diego homes for sale
- Rancho Del Rey, Chula Vista homes for sale
- San Ysidro, San Ysidro homes for sale
- Seaside Point, Imperial Beach homes for sale
- Silver Strand Beach Gardens, Imperial Beach homes for sale
- Southern San Diego, San Diego homes for sale
- Sunbowl, Chula Vista homes for sale
- Terra Nova, Chula Vista homes for sale
- Village of Montecito, Chula Vista homes for sale
Counties near Chula Vista, 91911
Protect your home and budget from life's surprises with an Assurant Home Warranty, backed by a partner that supports you through every step of homeownership. Explore Plans.
©2026 Century 21 Real Estate LLC. All rights reserved. CENTURY 21®, the CENTURY 21 Logo and C21® are service marks owned by Century 21 Real Estate LLC. Century 21 Real Estate LLC fully supports the principles of the Fair Housing Act and the Equal Opportunity Act. Each office is independently owned and operated. Listing information is deemed reliable but not guaranteed accurate.