- Adams homes for sale
- Big Rock homes for sale
- Chapmansboro homes for sale
- Clarksville homes for sale
- Cumberland City homes for sale
- Cumberland City homes for sale
- Cumberland Furnace homes for sale
- Cunningham homes for sale
- Erin homes for sale
- Guthrie homes for sale
- Hopkinsville homes for sale
- Indian Mound homes for sale
- Oak Grove homes for sale
- Oak Grove-Pembroke homes for sale
- Palmyra homes for sale
- Pembroke homes for sale
- Southside homes for sale
- Trenton homes for sale
- Vanleer homes for sale
- Woodlawn homes for sale
37042, TN - homes for sale
23 of 23 results displayed
- Open Fri, 12 to 4pmNew
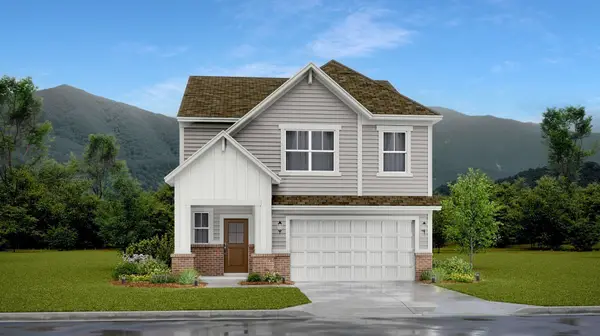
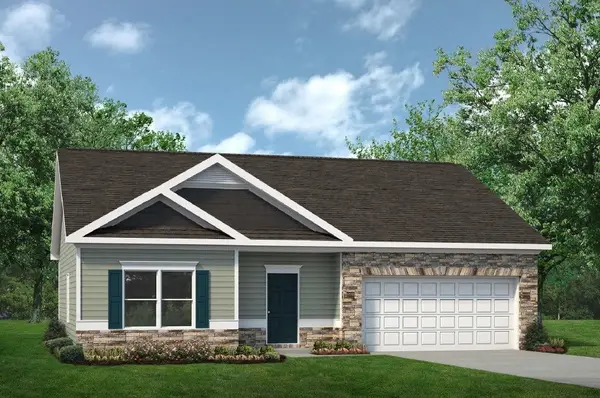
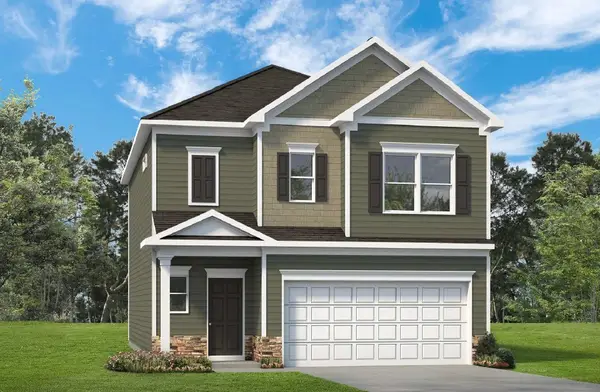
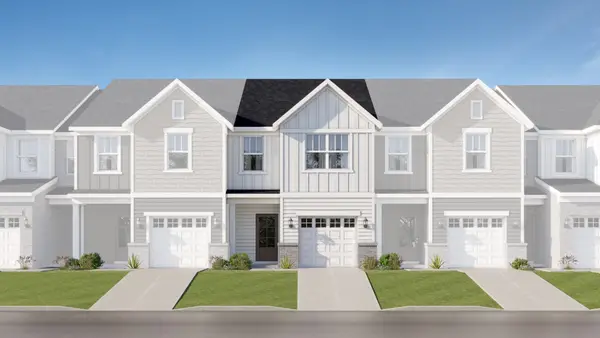 $249,990Active3 beds 3 baths1,539 sq. ft.
104 Bullpen Court, Clarksville, TN 37042
MLS# 3254701Listed by: LENNAR SALES CORP. - Open Fri, 12 to 4pmNew
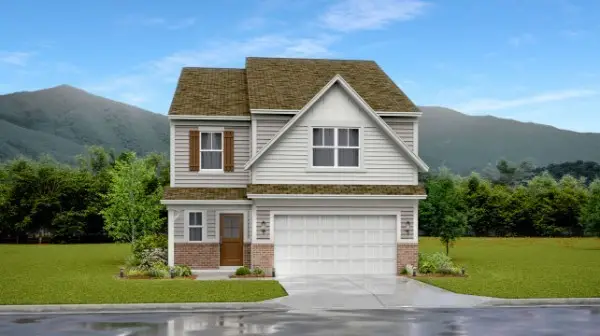
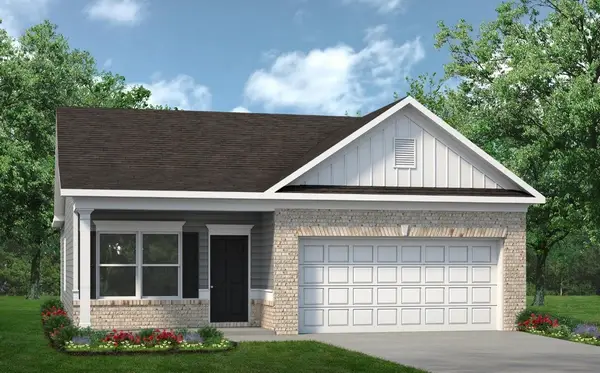
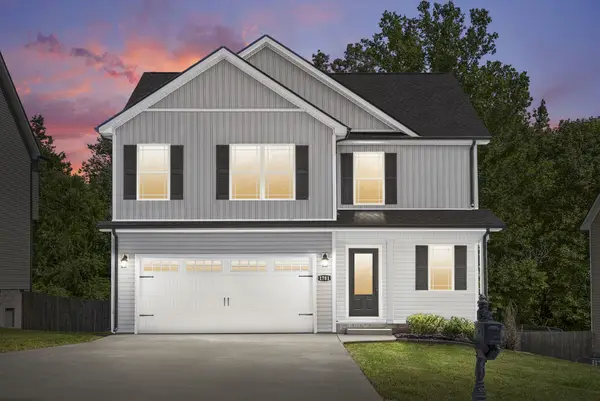
 $264,990Active3 beds 3 baths1,539 sq. ft.
104 Bullpen Court #F, Clarksville, TN 37042
MLS# 3254704Listed by: LENNAR SALES CORP. - Open Sun, 12 to 2pmNew
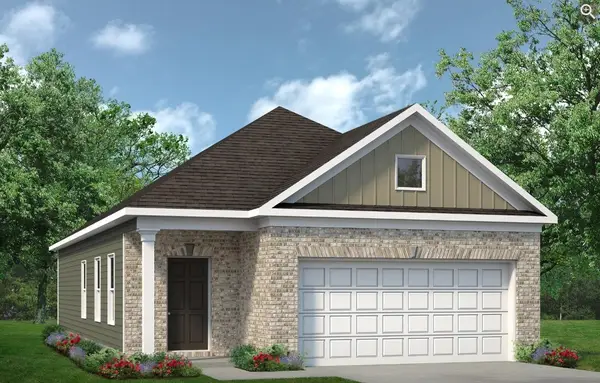
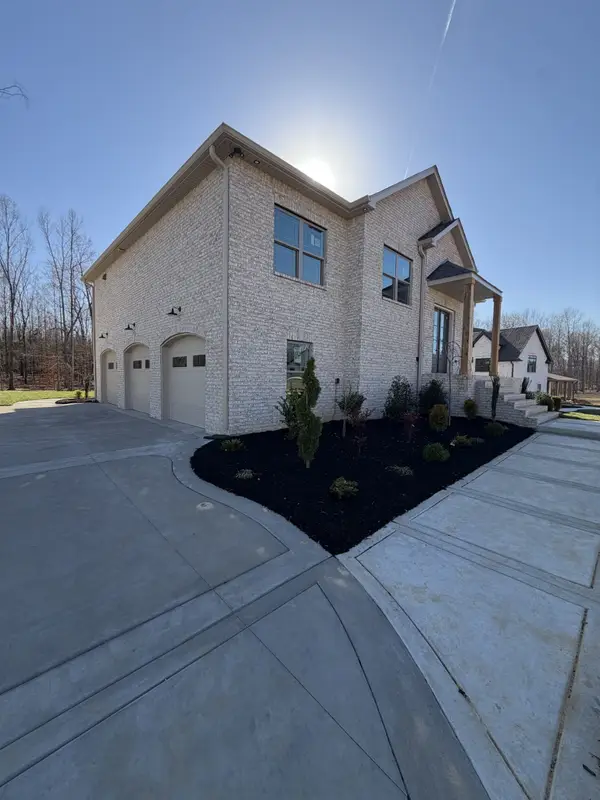
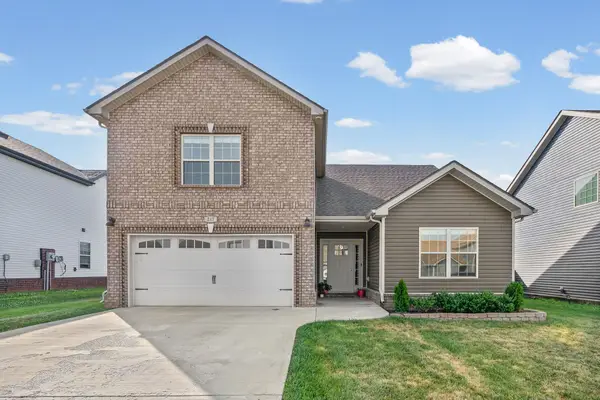 $335,000Active3 beds 2 baths1,929 sq. ft.
247 Dugger Dr, Clarksville, TN 37042
MLS# 3251199Listed by: EVOLVE REAL ESTATE, LLC - Open Fri, 10am to 6pmNew
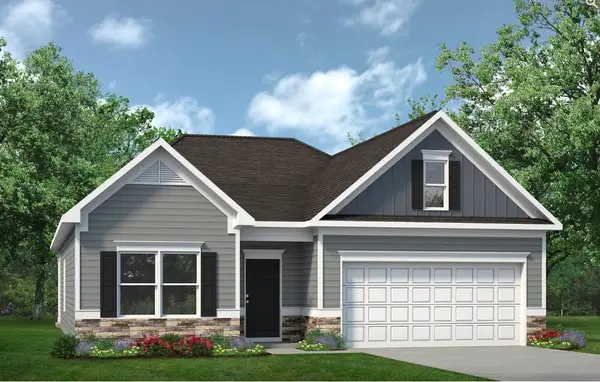
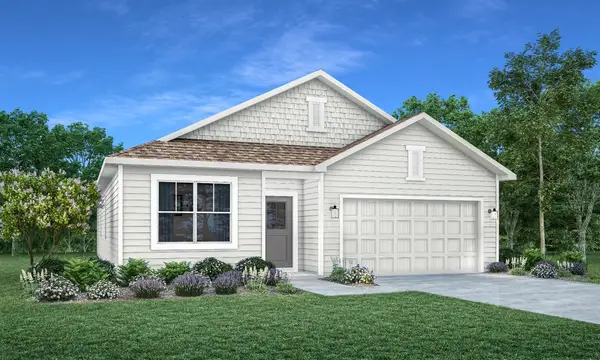
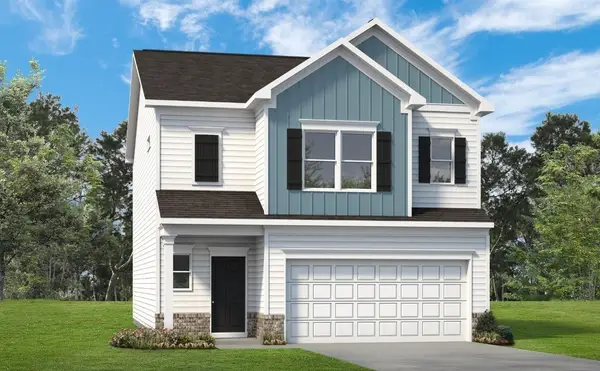
 $336,350Active3 beds 2 baths1,740 sq. ft.
300 Claude Cir, Clarksville, TN 37042
MLS# 3247513Listed by: SDH NASHVILLE, LLC - Open Fri, 10am to 5pmNew
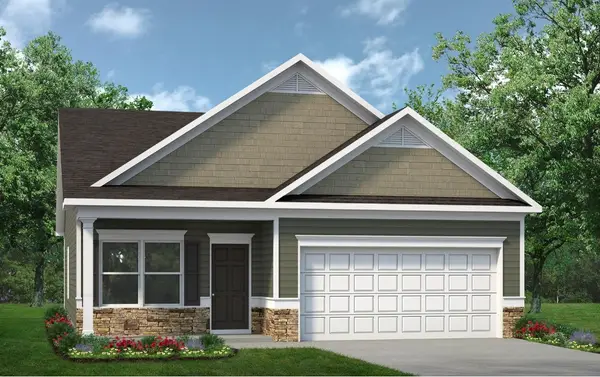
 $299,725Active3 beds 2 baths1,164 sq. ft.
306 Claude Cir, Clarksville, TN 37042
MLS# 3247538Listed by: SDH NASHVILLE, LLC - Open Fri, 10am to 6pmNew
 $339,290Active3 beds 2 baths1,740 sq. ft.
312 Claude Cir, Clarksville, TN 37042
MLS# 3247552Listed by: SDH NASHVILLE, LLC - Open Fri, 10am to 6pmNew
 $353,860Active3 beds 3 baths1,933 sq. ft.
275 Claude Cir, Clarksville, TN 37042
MLS# 3247583Listed by: SDH NASHVILLE, LLC - Open Fri, 10am to 6pmNew
 $368,150Active4 beds 3 baths2,053 sq. ft.
280 Claude Cir, Clarksville, TN 37042
MLS# 3247606Listed by: SDH NASHVILLE, LLC - Open Fri, 10am to 6pmNew
 $325,495Active3 beds 2 baths1,501 sq. ft.
294 Claude Circle, Clarksville, TN 37042
MLS# 3247694Listed by: SDH NASHVILLE, LLC - Open Fri, 12 to 4pmNew
 $359,990Active4 beds 3 baths2,011 sq. ft.
941 Pitcher Drive, Clarksville, TN 37042
MLS# 3246704Listed by: LENNAR SALES CORP. - Open Fri, 12 to 4pmNew
 $369,990Active4 beds 3 baths2,465 sq. ft.
925 Pitcher Drive, Clarksville, TN 37042
MLS# 3246705Listed by: LENNAR SALES CORP. 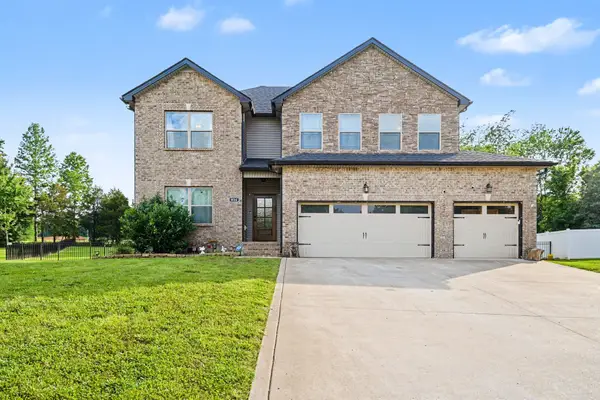 $427,000Active3 beds 3 baths2,182 sq. ft.
824 Snapdragon Ct, Clarksville, TN 37042
MLS# 3230186Listed by: MARK SPAIN REAL ESTATE- Open Fri, 12 to 4pm
 $299,990Active3 beds 2 baths1,673 sq. ft.
913 Pitcher Drive, Clarksville, TN 37042
MLS# 3221140Listed by: LENNAR SALES CORP. - Open Fri, 10am to 6pm
 $313,820Active3 beds 2 baths1,436 sq. ft.
319 Claude Circle, Clarksville, TN 37042
MLS# 3215736Listed by: SDH NASHVILLE, LLC - Open Fri, 10am to 6pm
 $332,685Active3 beds 2 baths1,501 sq. ft.
324 Claude Circle, Clarksville, TN 37042
MLS# 3214377Listed by: SDH NASHVILLE, LLC - Open Thu, 10am to 6pm
 $375,205Pending4 beds 3 baths2,066 sq. ft.
330 Claude Circle, Clarksville, TN 37042
MLS# 3214379Listed by: SDH NASHVILLE, LLC - Open Fri, 10am to 6pm
 $299,990Active3 beds 2 baths1,164 sq. ft.
331 Claude Cir, Clarksville, TN 37042
MLS# 3214380Listed by: SDH NASHVILLE, LLC - Open Fri, 10am to 6pm
 $353,680Active4 beds 3 baths1,933 sq. ft.
2263 Ireland Way, Clarksville, TN 37042
MLS# 3214383Listed by: SDH NASHVILLE, LLC - Open Thu, 10am to 6pm
 $331,780Active3 beds 3 baths1,933 sq. ft.
978 Andasia Way, Clarksville, TN 37042
MLS# 3193075Listed by: SDH NASHVILLE, LLC - Open Fri, 1 to 5pm
 $315,900Active3 beds 2 baths1,292 sq. ft.
346 Griffey Estates, Clarksville, TN 37042
MLS# 3175887Listed by: EXP REALTY - Open Sat, 10am to 12pm
 $364,999Active3 beds 3 baths1,834 sq. ft.
1781 Rains Rd, Clarksville, TN 37042
MLS# 3164605Listed by: BENCHMARK REALTY, LLC - Open Sun, 12 to 3pm
 $759,000Active3 beds 3 baths3,463 sq. ft.
1280 Reda Dr, Clarksville, TN 37042
MLS# 3164372Listed by: HAUS REALTY & MANAGEMENT LLC 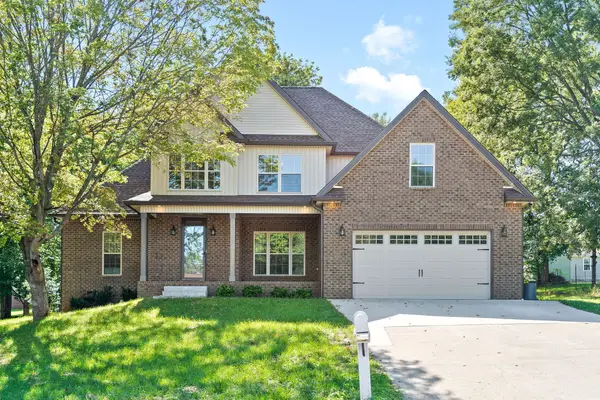 $490,000Active4 beds 3 baths2,895 sq. ft.
3556 Teal Dr, Clarksville, TN 37042
MLS# 3145359Listed by: MODERN MOVEMENT REAL ESTATE
Local realty services provided by:CENTURY 21 Premier
Popular searches near 37042
Popular neighborhoods near 37042
- Aspen Grove, Clarksville homes for sale
- Bluegrass Downs, Clarksville homes for sale
- Creekview Village, Clarksville homes for sale
- Franklin Meadows, Clarksville homes for sale
- Glen Ellen Landing, Clarksville homes for sale
- Greenland Farms, Clarksville homes for sale
- Hillwood, Clarksville homes for sale
- Kenwood, Clarksville homes for sale
- Meadows, Clarksville homes for sale
- Meriwether Farms, Clarksville homes for sale
- Miller Estates, Clarksville homes for sale
- North Park, Clarksville homes for sale
- Patrick Place, Clarksville homes for sale
- Peachtree, Clarksville homes for sale
- Plantation Estates, Clarksville homes for sale
- Queen's Bluff, Clarksville homes for sale
- Somerset, Clarksville homes for sale
- Sugar Tree, Clarksville homes for sale
- Virginia Hills, Clarksville homes for sale
- Wildwood West, Clarksville homes for sale
Counties near Clarksville, 37042
- Benton County homes for sale
- Caldwell County homes for sale
- Calloway County homes for sale
- Cheatham County homes for sale
- Christian County homes for sale
- Davidson County homes for sale
- Dickson County homes for sale
- Henry County homes for sale
- Hickman County homes for sale
- Houston County homes for sale
- Humphreys County homes for sale
- Logan County homes for sale
- Lyon County homes for sale
- Montgomery County homes for sale
- Muhlenberg County homes for sale
- Robertson County homes for sale
- Simpson County homes for sale
- Stewart County homes for sale
- Todd County homes for sale
- Trigg County homes for sale
Protect your home and budget from life's surprises with an Assurant Home Warranty, backed by a partner that supports you through every step of homeownership. Explore Plans.
©2026 Century 21 Real Estate LLC. All rights reserved. CENTURY 21®, the CENTURY 21 Logo and C21® are service marks owned by Century 21 Real Estate LLC. Century 21 Real Estate LLC fully supports the principles of the Fair Housing Act and the Equal Opportunity Act. Each office is independently owned and operated. Listing information is deemed reliable but not guaranteed accurate.