- Big Rock homes for sale
- Big Sandy homes for sale
- Buchanan homes for sale
- Bumpus Mills homes for sale
- Canton homes for sale
- Cumberland City homes for sale
- Cumberland City homes for sale
- Dover homes for sale
- Erin homes for sale
- Hazel homes for sale
- Indian Mound homes for sale
- Murray homes for sale
- New Concord homes for sale
- Palmyra homes for sale
- Puryear homes for sale
- Shiloh homes for sale
- Springville homes for sale
- Stewart homes for sale
- Tennessee Ridge homes for sale
- Woodlawn homes for sale
37058, TN - homes for sale
157 of 157 results displayed
- Coming Soon
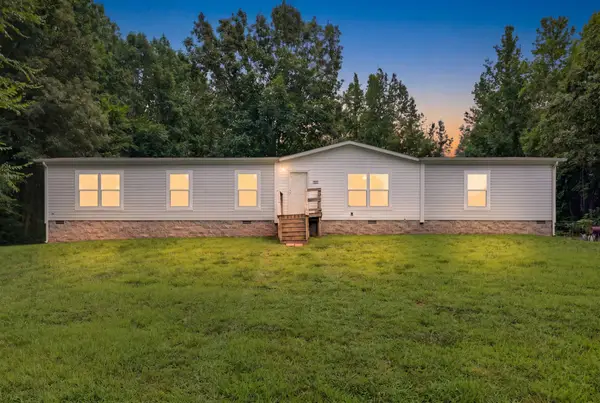 $389,900Coming Soon4 beds 2 baths
155 Earls Rd, Dover, TN 37058
MLS# 3281103Listed by: CENTURY 21 PLATINUM PROPERTIES - New
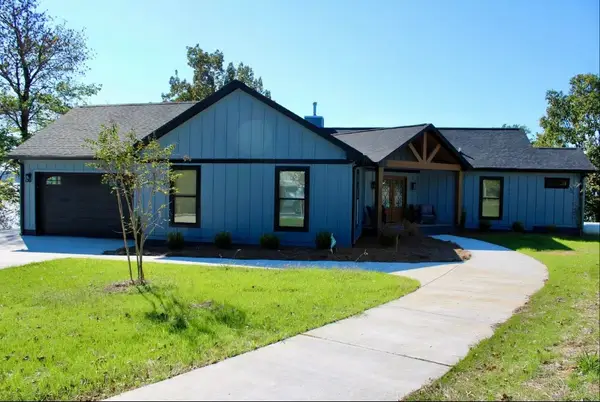 $859,900Active3 beds 3 baths2,875 sq. ft.
116 Tanasi Trl, Dover, TN 37058
MLS# 3281330Listed by: ACTION HOMES - New
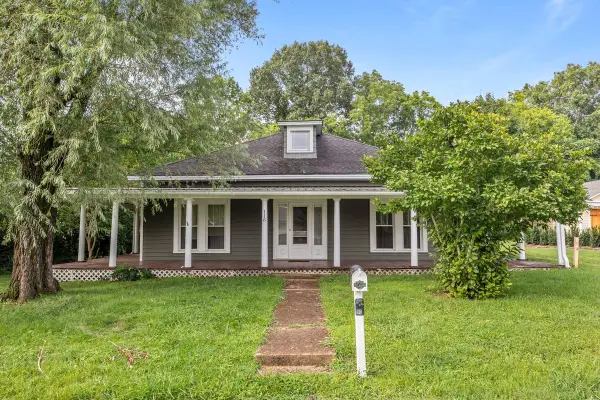 $179,900Active3 beds 1 baths1,736 sq. ft.
116 Vine St, Dover, TN 37058
MLS# 3272388Listed by: DUE SOUTH REALTY, LLC - New
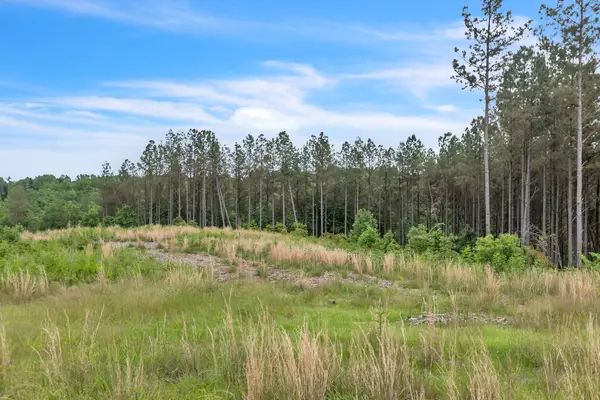 $95,000Active12.4 Acres
178 Sagebrush Way, Dover, TN 37058
MLS# 3272108Listed by: EPIQUE REALTY - New
 $410,000Active3 beds 2 baths1,650 sq. ft.
255 Sandy Rd, Dover, TN 37058
MLS# 3272191Listed by: CENTURY 21 PLATINUM PROPERTIES - New
 $85,000Active0.41 Acres
26 River Trace Dr, Dover, TN 37058
MLS# 3270089Listed by: CENTURY 21 PLATINUM PROPERTIES - New
 $252,000Active3.91 Acres
454 River Trace Dr, Dover, TN 37058
MLS# 3270058Listed by: CENTURY 21 PLATINUM PROPERTIES - New
 $85,000Active0.95 Acres
0 Trace Harbor Dr, Dover, TN 37058
MLS# 3270083Listed by: CENTURY 21 PLATINUM PROPERTIES  $299,500Active3 beds 2 baths1,996 sq. ft.
103 Millers Hill Rd, Dover, TN 37058
MLS# 3262039Listed by: CLARKSVILLEHOMEOWNER.COM $90,000Active12.65 Acres
0 Topside Drive, Dover, TN 37058
MLS# 3261411Listed by: MOSSY OAK PROPERTIES CLARKSVILLE, TN LAND & FARM $649,000Active4 beds 3 baths3,350 sq. ft.
203 Whispering Hills Dr, Dover, TN 37058
MLS# 3261000Listed by: KELLER WILLIAMS REALTY CLARKSVILLE $699,900Active4 beds 2 baths3,480 sq. ft.
554 Hickman Shores Rd, Dover, TN 37058
MLS# 3259862Listed by: KELLER WILLIAMS REALTY CLARKSVILLE $105,999Active-- beds -- baths
0 Saline Trl, Dover, TN 37058
MLS# 3256197Listed by: EXP REALTY $379,900Active4 beds 3 baths2,996 sq. ft.
480 Hickman Shores Rd, Dover, TN 37058
MLS# 3256272Listed by: SWEET HOME REALTY AND PROPERTY MANAGEMENT $425,000Active2 beds 2 baths1,469 sq. ft.
1508 Highway 79, Dover, TN 37058
MLS# 3255403Listed by: CENTURY 21 PLATINUM PROPERTIES $274,900Active3 beds 2 baths1,792 sq. ft.
446 The Trace, Dover, TN 37058
MLS# 3255406Listed by: CENTURY 21 PLATINUM PROPERTIES $499,900Active2 beds 2 baths972 sq. ft.
522 Short Creek Rd, Dover, TN 37058
MLS# 3253643Listed by: CENTURY 21 PLATINUM PROPERTIES $150,000Active1.98 Acres
1 Highway 79, Dover, TN 37058
MLS# 3251337Listed by: CRYE-LEIKE, INC., REALTORS $441,000Active126 Acres
0 Upper Standing Rock Rd, Dover, TN 37058
MLS# 3250871Listed by: COMPASS SOUTH, INC. $161,440Active20.18 Acres
0 Bryon Ln, Dover, TN 37058
MLS# 3250581Listed by: PROSPER REALTY GROUP $130,000Active9.7 Acres
0 Rustic Pines Rd, Dover, TN 37058
MLS# 3245062Listed by: CENTURY 21 PLATINUM PROPERTIES $79,000Active5.3 Acres
0 Rustic Pines Rd, Dover, TN 37058
MLS# 3250286Listed by: CENTURY 21 PLATINUM PROPERTIES $100,000Active7 Acres
0 Rustic Pines Rd, Dover, TN 37058
MLS# 3250288Listed by: CENTURY 21 PLATINUM PROPERTIES $199,000Active22.9 Acres
0 Rustic Pines Rd, Dover, TN 37058
MLS# 3250289Listed by: CENTURY 21 PLATINUM PROPERTIES $180,000Active18.5 Acres
0 Rustic Pines Rd, Dover, TN 37058
MLS# 3250295Listed by: CENTURY 21 PLATINUM PROPERTIES $145,000Active9.5 Acres
96 Evergreen Dr, Dover, TN 37058
MLS# 3248699Listed by: CENTURY 21 PLATINUM PROPERTIES $349,900Active4 beds 2 baths3,214 sq. ft.
313 Valley View Rd, Dover, TN 37058
MLS# 3247582Listed by: CENTURY 21 PLATINUM PROPERTIES $79,900Active10.12 Acres
0 Homestead Court, Dover, TN 37058
MLS# 3247687Listed by: EPIQUE REALTY $229,900Active1 beds 2 baths925 sq. ft.
111 Mud Hill Rd, Dover, TN 37058
MLS# 3247213Listed by: COMPASS RE DBA COMPASS CLARKSVILLE $295,000Active3 beds 1 baths1,344 sq. ft.
238 Eagle View Dr, Dover, TN 37058
MLS# 3246213Listed by: SWEET HOME REALTY AND PROPERTY MANAGEMENT $160,000Active16.9 Acres
0 Rustic Pines Rd, Dover, TN 37058
MLS# 3250293Listed by: CENTURY 21 PLATINUM PROPERTIES $32,000Active0.31 Acres
211 Lee Cir, Dover, TN 37058
MLS# 3243050Listed by: PATTY PAGE PROPERTIES, LLC $834,900Active2 beds 2 baths1,338 sq. ft.
570 Bobcat Trail, Dover, TN 37058
MLS# 3239697Listed by: THE STABLES REALTY GROUP $229,900Active2 beds 1 baths398 sq. ft.
123 Pine Grove Ln, Dover, TN 37058
MLS# 3233993Listed by: CENTURY 21 PLATINUM PROPERTIES $56,185Active6.61 Acres
0 Cox Hollow, Dover, TN 37058
MLS# 3232368Listed by: BYERS & HARVEY INC. $48,500Active3.25 Acres
20 Sugar Maple, Dover, TN 37058
MLS# 3232286Listed by: PATTY PAGE PROPERTIES, LLC $120,000Active5 Acres
Lot 86 Evergreen, Dover, TN 37058
MLS# 46437Listed by: KELLER WILLIAMS EXPERIENCE REALTY $325,000Active4 beds 4 baths2,576 sq. ft.
254 Shane Lee Cir, Dover, TN 37058
MLS# 3231847Listed by: PATTY PAGE PROPERTIES, LLC $469,900Active2 beds 2 baths1,450 sq. ft.
315 Riverview Dr, Dover, TN 37058
MLS# 3230303Listed by: MID-TN REALTY LLC $289,900Active3 beds 2 baths1,318 sq. ft.
1211 Taylor Chapel Rd, Dover, TN 37058
MLS# 3223880Listed by: CENTURY 21 PLATINUM PROPERTIES $645,900Active3 beds 3 baths2,512 sq. ft.
457 Lakeland Dr, Dover, TN 37058
MLS# 3224335Listed by: LISTING PAD $459,900Active3 beds 2 baths2,122 sq. ft.
115 Dale Ln, Dover, TN 37058
MLS# 3229709Listed by: KELLER WILLIAMS REALTY DBA DEBRA BUTTS & ASSOCIATE $119,000Active6.89 Acres
0 Ribbon Branch Road, Dover, TN 37058
MLS# 3220035Listed by: CRYE-LEIKE, INC., REALTORS $149,000Active8.76 Acres
0 Ribbon Branch Road, Dover, TN 37058
MLS# 3220042Listed by: CRYE-LEIKE, INC., REALTORS $269,000Active15.08 Acres
0 Ribbon Branch Road, Dover, TN 37058
MLS# 3220062Listed by: CRYE-LEIKE, INC., REALTORS $2,000,000Active3 beds 3 baths2,704 sq. ft.
196 Wildlife Road, Dover, TN 37058
MLS# 3218244Listed by: ZEITLIN SOTHEBY'S INTERNATIONAL REALTY $149,000Active20.66 Acres
1 Countryside Dr, Dover, TN 37058
MLS# 3218254Listed by: UNITED REAL ESTATE MIDDLE TENNESSEE $195,000Active21 Acres
0B Upperstanding Rock Rd, Dover, TN 37058
MLS# 3217148Listed by: J. BYRD LAND AND HOLDINGS $130,000Active21 Acres
0A Upperstanding Rock Rd, Dover, TN 37058
MLS# 3217151Listed by: J. BYRD LAND AND HOLDINGS $104,000Active8 Acres
0 Indian Creek Rd, Dover, TN 37058
MLS# 3217157Listed by: J. BYRD LAND AND HOLDINGS $125,000Pending22.6 Acres
2 Anglin Ridge Rd, Dover, TN 37058
MLS# 3217002Listed by: RE/MAX NORTHSTAR $449,900Active3 beds 2 baths2,379 sq. ft.
314 Ginger Dr, Dover, TN 37058
MLS# 3214324Listed by: HAUS REALTY & MANAGEMENT LLC $285,000Pending3 beds 2 baths2,106 sq. ft.
785 Old Highway 79, Dover, TN 37058
MLS# 3211622Listed by: CENTURY 21 PLATINUM PROPERTIES $325,000Active4 beds 3 baths1,952 sq. ft.
118 Colson Rd, Dover, TN 37058
MLS# 3208360Listed by: MARK SPAIN REAL ESTATE $325,000Active42 Acres
1490 Upper Standing Rock Rd, Dover, TN 37058
MLS# 3205473Listed by: J. BYRD LAND AND HOLDINGS $495,000Active3 beds 4 baths2,445 sq. ft.
216 Patrick Dr, Dover, TN 37058
MLS# 3197252Listed by: CENTURY 21 PLATINUM PROPERTIES $37,200Active3.72 Acres
0 Cox Hollow Lot 43a & 43b, Dover, TN 37058
MLS# 3191292Listed by: BYERS & HARVEY INC. $347,000Active3 beds 2 baths1,869 sq. ft.
1637 Upper Standing Rock Rd, Dover, TN 37058
MLS# 3190743Listed by: THE ASHTON REAL ESTATE GROUP OF RE/MAX ADVANTAGE $425,000Active3 beds 3 baths2,464 sq. ft.
171 Eagle Nest Ct, Dover, TN 37058
MLS# 3190274Listed by: BERKSHIRE HATHAWAY HOMESERVICES PENFED REALTY $620,500Active73 Acres
0 Keel Hollow Rd, Dover, TN 37058
MLS# 3189686Listed by: CENTURY 21 PLATINUM PROPERTIES $205,000Active2 beds 1 baths1,240 sq. ft.
209 Church St, Dover, TN 37058
MLS# 3189699Listed by: CENTURY 21 PLATINUM PROPERTIES $179,000Active1 beds 1 baths624 sq. ft.
111 Lakeshore Dr, Dover, TN 37058
MLS# 3189556Listed by: BYERS & HARVEY INC. $299,000Active3 beds 3 baths1,962 sq. ft.
151 Rose Dr, Dover, TN 37058
MLS# 3186593Listed by: BENCHMARK REALTY, LLC $165,000Active2 beds 1 baths770 sq. ft.
206 Boat Dock Rd, Dover, TN 37058
MLS# 3186178Listed by: BERKSHIRE HATHAWAY HOMESERVICES PENFED REALTY $135,000Active1.3 Acres
0 Lakeview Dr, Dover, TN 37058
MLS# 3184965Listed by: COLDWELL BANKER CONROY, MARABLE & HOLLEMAN $1,058,250Active-- beds -- baths
0 Upper Standing Rock Road, Dover, TN 37058
MLS# 3184333Listed by: MOSSY OAK PROPERTIES CLARKSVILLE, TN LAND & FARM $196,000Active2 beds 1 baths1,064 sq. ft.
1102 Highway 79, Dover, TN 37058
MLS# 3182941Listed by: CENTURY 21 PLATINUM PROPERTIES $189,000Active1 beds 1 baths500 sq. ft.
601 Pumpkin Ridge Rd, Dover, TN 37058
MLS# 3182290Listed by: LEGACY SIGNATURE PROPERTIES, LLC $615,000Active145 Acres
0 Cox Hollow, Dover, TN 37058
MLS# 3179645Listed by: COLDWELL BANKER CONROY, MARABLE & HOLLEMAN $349,000Active4 beds 2 baths1,912 sq. ft.
326 Valley View Rd, Dover, TN 37058
MLS# 3178965Listed by: TN REALTY, LLC $189,000Active14 Acres
0 The Retreat At Paris Landing, Dover, TN 37058
MLS# 3178925Listed by: CENTURY 21 PLATINUM PROPERTIES $60,000Active7.7 Acres
48 Ranches At Hickory Ridge, Dover, TN 37058
MLS# 3173655Listed by: KELLER WILLIAMS REALTY CLARKSVILLE $179,900Active1 beds 1 baths400 sq. ft.
112 Pine Grove Ln, Dover, TN 37058
MLS# 3171621Listed by: GRATEFUL ACRES REALTY $410,000Active4 beds 3 baths3,321 sq. ft.
408 Sandy Rd, Dover, TN 37058
MLS# 3171067Listed by: CENTURY 21 PLATINUM PROPERTIES $242,000Active22 Acres
0 Lick Creek Road, Dover, TN 37058
MLS# 3170459Listed by: CENTURY 21 PLATINUM PROPERTIES $814,900Active4 beds 3 baths3,608 sq. ft.
501 River Trace Dr, Dover, TN 37058
MLS# 3168178Listed by: CENTURY 21 PLATINUM PROPERTIES $85,000Active1.38 Acres
0 Refuge South Rd, Dover, TN 37058
MLS# 3168000Listed by: CLARKSVILLE REAL ESTATE, INC.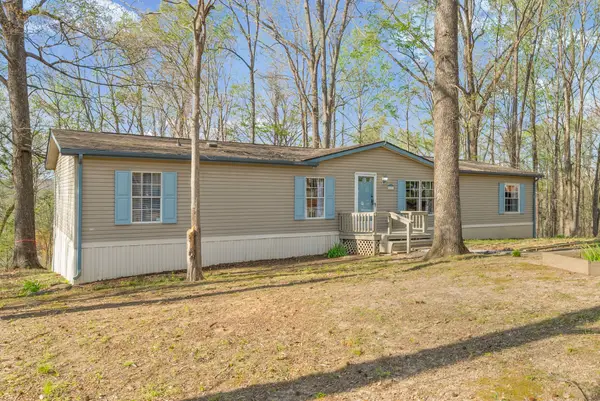 $149,900Active4 beds 2 baths1,728 sq. ft.
162 Bagsby Hill Ln, Dover, TN 37058
MLS# 3167538Listed by: BERKSHIRE HATHAWAY HOMESERVICES PENFED REALTY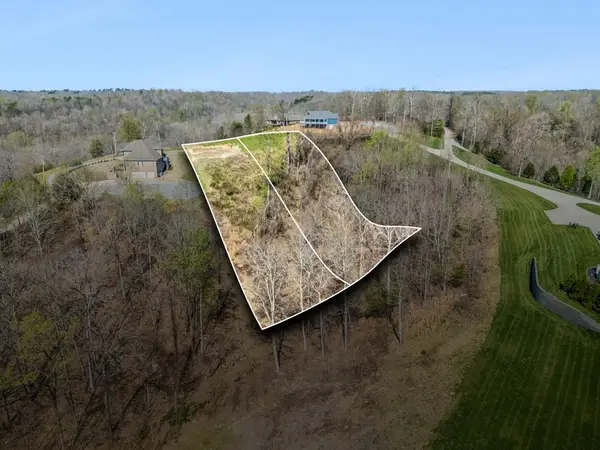 $120,000Active1.21 Acres
0 River Trace Dr, Dover, TN 37058
MLS# 3164953Listed by: EXP REALTY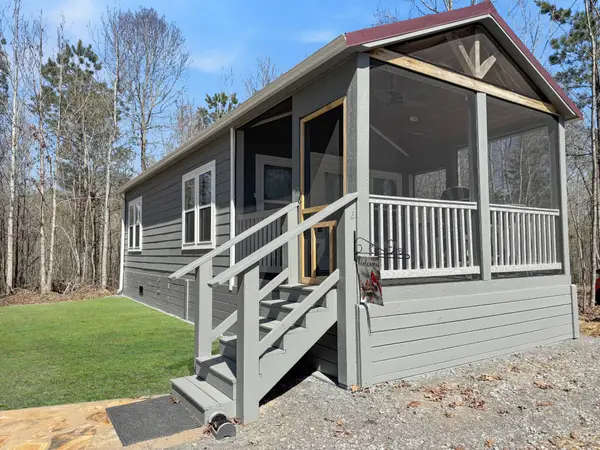 $360,000Active1 beds 1 baths398 sq. ft.
137 Summit Dr, Dover, TN 37058
MLS# 3165091Listed by: CENTURY 21 PLATINUM PROPERTIES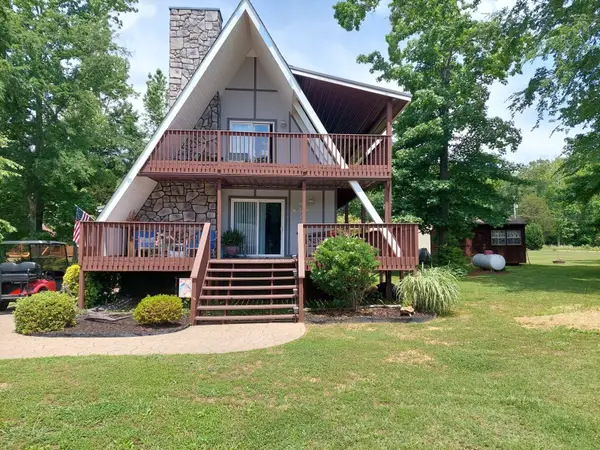 $370,000Active3 beds 2 baths1,536 sq. ft.
117 Sparrow Ln, Dover, TN 37058
MLS# 3164208Listed by: AT HOME REALTY $270,000Active3 beds 2 baths1,680 sq. ft.
106 Fox Squirrel Dr, Dover, TN 37058
MLS# 3163564Listed by: MOODY REALTY COMPANY, INC. $325,000Active48.98 Acres
0 Elk Creek Rd, Cumberland City, TN 37050
MLS# 3158600Listed by: COMPASS TENNESSEE, LLC $239,000Active3 beds 4 baths1,000 sq. ft.
102 Thomas Rd, Dover, TN 37058
MLS# 3155872Listed by: COLDWELL BANKER SOUTHERN REALTY $350,000Active35 Acres
1356 Upper Standing Rock Rd, Dover, TN 37058
MLS# 3152517Listed by: CENTURY 21 PLATINUM PROPERTIES $265,000Pending3 beds 2 baths1,397 sq. ft.
143 Rose Dr, Dover, TN 37058
MLS# 3150029Listed by: PATTY PAGE PROPERTIES, LLC $1,800,000Active6 beds 4 baths5,154 sq. ft.
515 Cox Hollow Rd, Dover, TN 37058
MLS# 3148189Listed by: APERTURE GLOBAL $329,900Active3 beds 2 baths1,384 sq. ft.
2 Trin Hill Drive, Dover, TN 37058
MLS# 3145053Listed by: KELLER WILLIAMS REALTY CLARKSVILLE $53,000Active1.5 Acres
0 Eagle Nest Court, Dover, TN 37058
MLS# 3137674Listed by: REALTY EXECUTIVES HOMETOWN LIVING $102,999Active12.67 Acres
0 Topside Drive, Dover, TN 37058
MLS# 3137533Listed by: MOSSY OAK PROPERTIES CLARKSVILLE, TN LAND & FARM $129,000Active2 beds 2 baths840 sq. ft.
743 Brownfield Rd, Dover, TN 37058
MLS# 3135369Listed by: CENTURY 21 PLATINUM PROPERTIES $369,900Active4 beds 3 baths2,295 sq. ft.
225 Hickory Hill Dr, Dover, TN 37058
MLS# 3112690Listed by: ONWARD REAL ESTATE $75,000Active9.19 Acres
0 Saddleback Dr, Dover, TN 37058
MLS# 3133423Listed by: PATTY PAGE PROPERTIES, LLC $695,000Active3 beds 3 baths2,608 sq. ft.
120 Golden Eagle Dr, Dover, TN 37058
MLS# 3133020Listed by: BYERS & HARVEY INC. $139,900Active20.39 Acres
0 Saddleback Drive, Dover, TN 37058
MLS# 3128052Listed by: EPIQUE REALTY $6,995,000Active6 beds 5 baths6,000 sq. ft.
572 Eagle Shore Dr, Dover, TN 37058
MLS# 3124400Listed by: HAYDEN OUTDOORS LLC $312,000Pending4 beds 2 baths1,721 sq. ft.
3325 Highway 49, Dover, TN 37058
MLS# 3079280Listed by: SWEET HOME REALTY AND PROPERTY MANAGEMENT $122,650Active22.3 Acres
683 Highway 79, Dover, TN 37058
MLS# 3118242Listed by: KELLER WILLIAMS REALTY CLARKSVILLE $10,000Active0.18 Acres
0 Lakeshore Drive, Dover, TN 37058
MLS# 3117234Listed by: LEGACY SIGNATURE PROPERTIES, LLC $68,000Active8.28 Acres
98 Saddleback Drive, Dover, TN 37058
MLS# 3098787Listed by: EPIQUE REALTY $875,900Active4 beds 3 baths3,120 sq. ft.
311 Riverview Dr, Dover, TN 37058
MLS# 3099174Listed by: MID-TN REALTY LLC $50,000Active7.79 Acres
45 Saddleback Dr, Dover, TN 37058
MLS# 3098807Listed by: CENTURY 21 PLATINUM PROPERTIES $16,000Active1.93 Acres
29 Shores Trail, Dover, TN 37058
MLS# 3079420Listed by: PATTY PAGE PROPERTIES, LLC $56,500Active0.43 Acres
1 Donelson Parkway, Dover, TN 37058
MLS# 3079233Listed by: HAUS REALTY & MANAGEMENT LLC $178,330Active19.39 Acres
0 Cox Hollow, Dover, TN 37058
MLS# 3066732Listed by: BYERS & HARVEY INC. $99,790Active11.74 Acres
0 Cox Hollow, Dover, TN 37058
MLS# 3066733Listed by: BYERS & HARVEY INC. $201,710Active33.59 Acres
0 Cox Hollow, Dover, TN 37058
MLS# 3066735Listed by: BYERS & HARVEY INC. $31,500Active3.15 Acres
0 Cox Hollow, Dover, TN 37058
MLS# 3066737Listed by: BYERS & HARVEY INC. $127,080Active21.18 Acres
0 Cox Hollow, Dover, TN 37058
MLS# 3065503Listed by: BYERS & HARVEY INC. $620,500Active73 Acres
738 Keel Hollow Rd, Dover, TN 37058
MLS# 3061409Listed by: CENTURY 21 PLATINUM PROPERTIES $124,040Active17.72 Acres
0 Cox Hollow, Dover, TN 37058
MLS# 3059643Listed by: BYERS & HARVEY INC. $198,840Active33.14 Acres
0 Cox Hollow, Dover, TN 37058
MLS# 3059506Listed by: BYERS & HARVEY INC. $23,300Active2.33 Acres
0 Cox Hollow, Dover, TN 37058
MLS# 3059507Listed by: BYERS & HARVEY INC. $138,160Active17.27 Acres
0 Cox Hollow, Dover, TN 37058
MLS# 3059513Listed by: BYERS & HARVEY INC. $58,400Active2.29 Acres
164 Lewis Cir, Dover, TN 37058
MLS# 3137516Listed by: CLARKSVILLEHOMEOWNER.COM $81,345Active9.57 Acres
0 Cox Hollow, Dover, TN 37058
MLS# 3054608Listed by: BYERS & HARVEY INC. $89,590Active10.54 Acres
0 Cox Hollow, Dover, TN 37058
MLS# 3054609Listed by: BYERS & HARVEY INC. $135,575Active15.95 Acres
0 Cox Hollow, Dover, TN 37058
MLS# 3054610Listed by: BYERS & HARVEY INC. $133,450Active15.7 Acres
0 Cox Hollow, Dover, TN 37058
MLS# 3054611Listed by: BYERS & HARVEY INC. $66,045Active7.77 Acres
0 Cox Hollow, Dover, TN 37058
MLS# 3050935Listed by: BYERS & HARVEY INC. $120,530Active14.18 Acres
0 Cox Hollow, Dover, TN 37058
MLS# 3050936Listed by: BYERS & HARVEY INC. $459,900Active3 beds 3 baths3,128 sq. ft.
130 Wayne Threatt Rd, Dover, TN 37058
MLS# 3039304Listed by: CENTURY 21 PLATINUM PROPERTIES $4,500Active0.43 Acres
0 Lakeshore Dr, Dover, TN 37058
MLS# 3032596Listed by: ASPIRE REALTY LLC $440,000Active3 beds 4 baths3,060 sq. ft.
127 Lena Sykes Rd, Dover, TN 37058
MLS# 3031733Listed by: CENTURY 21 PLATINUM PROPERTIES $199,999Active3 beds 1 baths1,250 sq. ft.
241 Castle Ln, Dover, TN 37058
MLS# 3007016Listed by: HAUS REALTY & MANAGEMENT LLC $349,900Active3 beds 2 baths1,150 sq. ft.
114 Fox Squirrel Dr, Dover, TN 37058
MLS# 3001034Listed by: CRYE-LEIKE, INC., REALTORS $196,000Active29.45 Acres
1 Terrapin Run Rd, Dover, TN 37058
MLS# 3014813Listed by: CENTURY 21 PLATINUM PROPERTIES $254,900Active3 beds 2 baths1,960 sq. ft.
2359 Highway 49, Dover, TN 37058
MLS# 3012956Listed by: CENTURY 21 PLATINUM PROPERTIES $70,635Active8.3 Acres
0 Cox Hollow, Dover, TN 37058
MLS# 3003793Listed by: BYERS & HARVEY INC. $29,800Active2.98 Acres
0 Cox Hollow, Dover, TN 37058
MLS# 3059509Listed by: BYERS & HARVEY INC. $209,900Active2 beds 1 baths1,526 sq. ft.
419 Church St, Dover, TN 37058
MLS# 2998442Listed by: SPOTLIGHT PROPERTIES, LLC $69,900Active0.34 Acres
110 Fox Squirrel Dr, Dover, TN 37058
MLS# 3001031Listed by: CRYE-LEIKE, INC., REALTORS $415,000Active3 beds 2 baths2,114 sq. ft.
143 Saline Trail, Dover, TN 37058
MLS# 2975437Listed by: SPOTLIGHT PROPERTIES, LLC $169,900Active1 beds 1 baths398 sq. ft.
103 Thomas Rd, Dover, TN 37058
MLS# 3097395Listed by: CENTURY 21 PLATINUM PROPERTIES $699,000Active19.3 Acres
124 Hayes Fork Creek Rd, Dover, TN 37058
MLS# 2974316Listed by: PATTY PAGE PROPERTIES, LLC $105,000Active15.45 Acres
4 Cox Hollow Rd, Dover, TN 37058
MLS# 2972471Listed by: SPOTLIGHT PROPERTIES, LLC $208,500Active28.55 Acres
0 Twin Feathers Road, Dover, TN 37058
MLS# 2969748Listed by: CENTURY 21 PLATINUM PROPERTIES $339,000Active5 beds 4 baths3,222 sq. ft.
232 Church St, Dover, TN 37058
MLS# 2962906Listed by: PATTY PAGE PROPERTIES, LLC $699,000Active5 beds 4 baths4,602 sq. ft.
124 Hayes Fork Creek Rd, Dover, TN 37058
MLS# 2946034Listed by: PATTY PAGE PROPERTIES, LLC $244,000Active3 beds 2 baths1,944 sq. ft.
344 Highway 232, Dover, TN 37058
MLS# 2944342Listed by: WHAT ABOUT THAT HOUSE REAL ESTATE SERVICES $10,000Active0.69 Acres
17 Eagle Shore Dr, Dover, TN 37058
MLS# 2941185Listed by: PATTY PAGE PROPERTIES, LLC $99,025Active11.65 Acres
0 Cox Hollow Rd, Dover, TN 37058
MLS# 2920634Listed by: BYERS & HARVEY INC. $88,570Active10.42 Acres
0 Cox Hollow Rd, Dover, TN 37058
MLS# 2920635Listed by: BYERS & HARVEY INC. $65,705Active7.73 Acres
0 Cox Hollow Rd, Dover, TN 37058
MLS# 2920636Listed by: BYERS & HARVEY INC. $546,000Active2 beds 2 baths1,976 sq. ft.
326 Hargis Rd, Dover, TN 37058
MLS# 3072240Listed by: CENTURY 21 PLATINUM PROPERTIES $177,000Active30.02 Acres
1 Saddleback Dr, Dover, TN 37058
MLS# 2865820Listed by: CENTURY 21 PLATINUM PROPERTIES $171,000Active1 Acres
1 Church Street, Dover, TN 37058
MLS# 2819352Listed by: SPOTLIGHT PROPERTIES, LLC $425,000Active1.32 Acres
0 Donelson Pkwy, Dover, TN 37058
MLS# 2818089Listed by: SPOTLIGHT PROPERTIES, LLC $681,000Active4 beds 2 baths2,400 sq. ft.
212 Skyline Rdg, Dover, TN 37058
MLS# 2958756Listed by: CHAPPELL & ASSOCIATES PROPERTY MANAGEMENT $184,999Active3 beds 2 baths1,056 sq. ft.
141 General Buckner Dr, Dover, TN 37058
MLS# 3065496Listed by: HILL AND HOLLOW REALTY $375,900Active3 beds 2 baths1,680 sq. ft.
1557 Donelson Parkway, Dover, TN 37058
MLS# 2747527Listed by: SPOTLIGHT PROPERTIES, LLC $180,000Active4 beds 1 baths1,888 sq. ft.
105 General Rice St, Dover, TN 37058
MLS# 2679085Listed by: PATTY PAGE PROPERTIES, LLC $38,800Active0.5 Acres
1 Golden Eagle Dr, Dover, TN 37058
MLS# 2633116Listed by: CENTURY 21 PLATINUM PROPERTIES $8,500Active0.34 Acres
1 Lakeshore Cir, Dover, TN 37058
MLS# 2626134Listed by: CENTURY 21 PLATINUM PROPERTIES $310,000Active3 beds 3 baths1,270 sq. ft.
120 Thomas Rd, Dover, TN 37058
MLS# 2613322Listed by: BLUE DOOR REALTY GROUP $12,500Active0.68 Acres
0 Eagle Shore Dr, Dover, TN 37058
MLS# 2488234Listed by: CENTURY 21 PLATINUM PROPERTIES $386,000Active4 beds 3 baths1,952 sq. ft.
118 Colson Rd, Dover, TN 37058
MLS# 2569361Listed by: CLARKSVILLE REAL ESTATE, INC.
Local realty services provided by:CENTURY 21 Premier, CENTURY 21 Golden Service Realty & Auction, Inc.
Popular searches near 37058
Popular neighborhoods near 37058
- Anderson Place, Clarksville homes for sale
- Aspen Grove, Clarksville homes for sale
- Avalon, Clarksville homes for sale
- Bluegrass Downs, Clarksville homes for sale
- Creekview Village, Clarksville homes for sale
- Fort Campbell, Woodlawn homes for sale
- Franklin Meadows, Clarksville homes for sale
- Glen Ellen Landing, Clarksville homes for sale
- Greenland Farms, Clarksville homes for sale
- Hillwood, Clarksville homes for sale
- Kenwood, Clarksville homes for sale
- Meriwether Farms, Clarksville homes for sale
- Miller Estates, Clarksville homes for sale
- North Park, Clarksville homes for sale
- Patrick Place, Clarksville homes for sale
- Peachtree, Clarksville homes for sale
- Plantation Estates, Clarksville homes for sale
- Queen's Bluff, Clarksville homes for sale
- Sugar Tree, Clarksville homes for sale
- Wildwood West, Clarksville homes for sale
Counties near Dover, 37058
- Benton County homes for sale
- Caldwell County homes for sale
- Calloway County homes for sale
- Carroll County homes for sale
- Cheatham County homes for sale
- Christian County homes for sale
- Dickson County homes for sale
- Graves County homes for sale
- Henry County homes for sale
- Hickman County homes for sale
- Houston County homes for sale
- Humphreys County homes for sale
- Livingston County homes for sale
- Lyon County homes for sale
- Marshall County homes for sale
- Montgomery County homes for sale
- Stewart County homes for sale
- Todd County homes for sale
- Trigg County homes for sale
- Weakley County homes for sale
Protect your home and budget from life's surprises with an Assurant Home Warranty, backed by a partner that supports you through every step of homeownership. Explore Plans.
©2026 Century 21 Real Estate LLC. All rights reserved. CENTURY 21®, the CENTURY 21 Logo and C21® are service marks owned by Century 21 Real Estate LLC. Century 21 Real Estate LLC fully supports the principles of the Fair Housing Act and the Equal Opportunity Act. Each office is independently owned and operated. Listing information is deemed reliable but not guaranteed accurate.