- Cambridge Lakes, Pingree Grove homes for sale
- Century Oaks West, Elgin homes for sale
- Cobblers Crossing, Elgin homes for sale
- Coventry, Crystal Lake homes for sale
- Del Webb's Sun City, Huntley homes for sale
- Dundee, Carpentersville homes for sale
- Four Colonies, Crystal Lake homes for sale
- Fox River Valley Gardens, Port Barrington homes for sale
- High Hill Farms, Algonquin homes for sale
- Lake Barrington Shores, Lake Barrington homes for sale
- Lake in the Hills Estates, Lake In The Hills homes for sale
- Meadowbrook, Lake In The Hills homes for sale
- Providence, Elgin homes for sale
- Streamwood Green, Streamwood homes for sale
- Talamore, Huntley homes for sale
- The Villages, Crystal Lake homes for sale
- The Villas of Gleneagle Farm, Carpentersville homes for sale
- Turnberry, Lakewood homes for sale
- Winston Park Northwest, Palatine homes for sale
- Woodland Heights, Streamwood homes for sale
Elgin, IL - homes for sale
72 of 72 results displayed
 $545,490Pending4 beds 3 baths2,235 sq. ft.
586 Lismore Circle, Elgin, IL 60124
MLS# 12605125Listed by: HOMESMART CONNECT LLC
 $592,875Pending4 beds 3 baths2,521 sq. ft.
575 Lismore Circle, Elgin, IL 60124
MLS# 12604981Listed by: HOMESMART CONNECT LLC- New
 $593,365Active4 beds 3 baths2,536 sq. ft.
552 Ayre Drive, Elgin, IL 60124
MLS# 12603409Listed by: HOMESMART CONNECT LLC - New
 $594,535Active4 beds 3 baths2,662 sq. ft.
589 Lismore Circle, Elgin, IL 60124
MLS# 12603434Listed by: HOMESMART CONNECT LLC - New
 $529,990Active4 beds 3 baths2,235 sq. ft.
549 Ayre Drive, Elgin, IL 60124
MLS# 12603395Listed by: HOMESMART CONNECT LLC - New
 $708,385Active4 beds 3 baths3,275 sq. ft.
1849 Diamond Drive, Elgin, IL 60124
MLS# 12602828Listed by: HOMESMART CONNECT LLC - New
 $658,310Active3 beds 3 baths2,441 sq. ft.
1848 Chandolin Lane, Elgin, IL 60124
MLS# 12602844Listed by: HOMESMART CONNECT LLC - New
 $647,084Active4 beds 4 baths2,399 sq. ft.
206 Steeple Bush Lane #9137, Schaumburg, IL 60193
MLS# 12601534Listed by: TWIN VINES REAL ESTATE SVCS  $610,325Pending4 beds 3 baths2,536 sq. ft.
571 Lismore Circle, Elgin, IL 60124
MLS# 12599307Listed by: HOMESMART CONNECT LLC $560,000Pending4 beds 3 baths2,648 sq. ft.
585 Lismore Circle, Elgin, IL 60124
MLS# 12599349Listed by: HOMESMART CONNECT LLC $576,990Pending4 beds 3 baths2,662 sq. ft.
581 Lismore Circle, Elgin, IL 60124
MLS# 12599373Listed by: HOMESMART CONNECT LLC $738,860Pending4 beds 4 baths3,876 sq. ft.
1857 Diamond Drive, Elgin, IL 60124
MLS# 12599038Listed by: HOMESMART CONNECT LLC $611,990Active4 beds 3 baths2,437 sq. ft.
3613 Sandstone Circle, Elgin, IL 60124
MLS# 12589948Listed by: HOMESMART CONNECT LLC $579,265Pending4 beds 3 baths2,521 sq. ft.
593 Lismore Circle, Elgin, IL 60124
MLS# 12583182Listed by: HOMESMART CONNECT LLC $582,900Pending4 beds 3 baths2,235 sq. ft.
596 Lismore Circle, Elgin, IL 60124
MLS# 12583203Listed by: HOMESMART CONNECT LLC $614,200Active4 beds 3 baths2,521 sq. ft.
591 Lismore Circle, Elgin, IL 60124
MLS# 12583067Listed by: HOMESMART CONNECT LLC $563,990Pending4 beds 3 baths2,662 sq. ft.
595 Lismore Circle, Elgin, IL 60124
MLS# 12583166Listed by: HOMESMART CONNECT LLC $653,990Active4 beds 3 baths2,932 sq. ft.
Address Withheld By Seller, Elgin, IL 60124
MLS# 12576938Listed by: DAYNAE GAUDIO $657,990Active4 beds 3 baths2,932 sq. ft.
Address Withheld By Seller, Elgin, IL 60124
MLS# 12576968Listed by: DAYNAE GAUDIO $577,990Active3 beds 2 baths1,981 sq. ft.
284 Snowdrop Lane, Elgin, IL 60124
MLS# 12576978Listed by: DAYNAE GAUDIO $609,900Active4 beds 3 baths2,800 sq. ft.
594 Lismore Circle, Elgin, IL 60124
MLS# 12577318Listed by: HOMESMART CONNECT LLC $555,000Pending4 beds 3 baths2,521 sq. ft.
592 Lismore Circle, Elgin, IL 60124
MLS# 12572109Listed by: HOMESMART CONNECT LLC $640,280Pending3 beds 4 baths2,357 sq. ft.
201 Mountain Interval Road #07129, Schaumburg, IL 60193
MLS# 12565233Listed by: TWIN VINES REAL ESTATE SVCS $640,091Pending3 beds 4 baths2,357 sq. ft.
219 Mountain Interval Road #07432, Schaumburg, IL 60193
MLS# 12565260Listed by: TWIN VINES REAL ESTATE SVCS $706,914Pending4 beds 4 baths2,722 sq. ft.
200 Mountain Interval Road #06628, Schaumburg, IL 60193
MLS# 12560727Listed by: TWIN VINES REAL ESTATE SVCS $589,990Active4 beds 3 baths2,717 sq. ft.
274 Snowdrop Lane, Elgin, IL 60124
MLS# 12560458Listed by: DAYNAE GAUDIO $579,490Active4 beds 3 baths2,717 sq. ft.
289 Snowdrop Lane, Elgin, IL 60124
MLS# 12560467Listed by: DAYNAE GAUDIO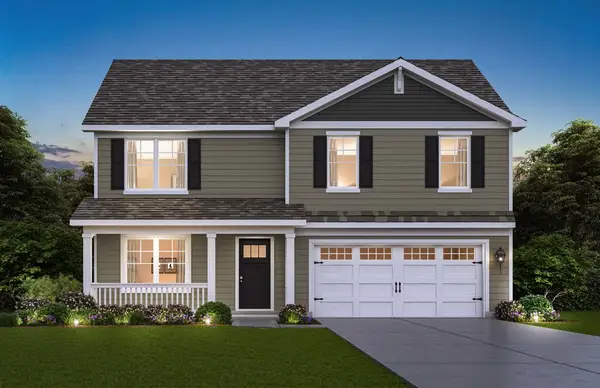 $576,490Active4 beds 3 baths2,717 sq. ft.
285 Snowdrop Lane, Elgin, IL 60124
MLS# 12560473Listed by: DAYNAE GAUDIO $626,490Active4 beds 3 baths2,932 sq. ft.
278 Snowdrop Lane, Elgin, IL 60124
MLS# 12560484Listed by: DAYNAE GAUDIO $636,490Active4 beds 3 baths2,932 sq. ft.
282 Snowdrop Lane, Elgin, IL 60124
MLS# 12560501Listed by: DAYNAE GAUDIO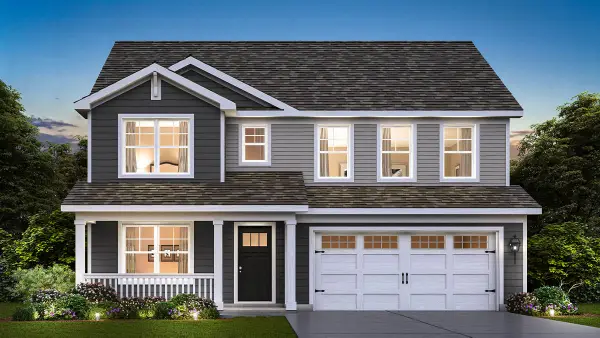 $614,990Active4 beds 3 baths2,932 sq. ft.
283 Snowdrop Lane, Elgin, IL 60124
MLS# 12561136Listed by: DAYNAE GAUDIO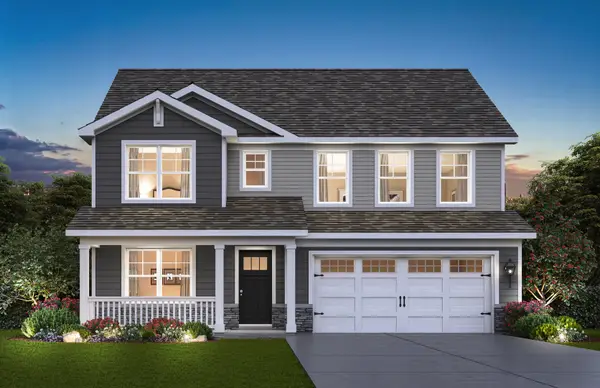 $639,990Active4 beds 3 baths2,932 sq. ft.
272 Snowdrop Lane, Elgin, IL 60124
MLS# 12560479Listed by: DAYNAE GAUDIO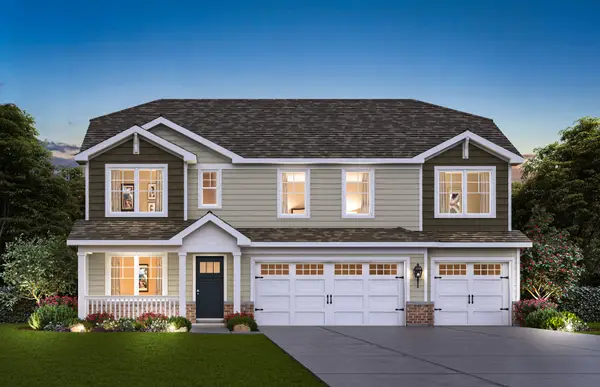 $669,490Active5 beds 3 baths3,044 sq. ft.
280 Snowdrop Lane, Elgin, IL 60124
MLS# 12560508Listed by: DAYNAE GAUDIO $670,990Active4 beds 3 baths2,836 sq. ft.
1208 Tiger Lily Drive, Bartlett, IL 60103
MLS# 12559549Listed by: DAYNAE GAUDIO $578,961Active3 beds 4 baths2,219 sq. ft.
207 Mountain Interval Road #07230, Schaumburg, IL 60193
MLS# 12555762Listed by: TWIN VINES REAL ESTATE SVCS $678,990Pending5 beds 3 baths3,044 sq. ft.
281 Snowdrop Lane, Elgin, IL 60124
MLS# 12542750Listed by: DAYNAE GAUDIO $759,990Active4 beds 2 baths2,371 sq. ft.
3662 Old Bridge Lane, Elgin, IL 60124
MLS# 12542088Listed by: HOME SELL FLAT LLC $579,990Active4 beds 3 baths2,717 sq. ft.
270 Snowdrop Lane, Elgin, IL 60124
MLS# 12520501Listed by: DAYNAE GAUDIO $606,300Pending4 beds 3 baths2,800 sq. ft.
600 Lismore Circle, Elgin, IL 60124
MLS# 12533632Listed by: HOMESMART CONNECT LLC $590,755Pending4 beds 3 baths2,549 sq. ft.
598 Lismore Circle, Elgin, IL 60124
MLS# 12533645Listed by: HOMESMART CONNECT LLC $581,022Pending3 beds 4 baths2,722 sq. ft.
212 Mountain Interval Road #06325, Schaumburg, IL 60193
MLS# 12530398Listed by: TWIN VINES REAL ESTATE SVCS $699,961Pending3 beds 4 baths2,722 sq. ft.
220 Mountain Interval Road #06224, Schaumburg, IL 60193
MLS# 12523264Listed by: TWIN VINES REAL ESTATE SVCS $621,454Pending3 beds 4 baths2,722 sq. ft.
216 Mountain Interval Road #06224, Schaumburg, IL 60193
MLS# 12521422Listed by: TWIN VINES REAL ESTATE SVCS $549,990Pending3 beds 2 baths1,981 sq. ft.
268 Snowdrop Lane, Elgin, IL 60124
MLS# 12520493Listed by: DAYNAE GAUDIO $614,990Active4 beds 3 baths2,932 sq. ft.
264 Snowdrop Lane, Elgin, IL 60124
MLS# 12520517Listed by: DAYNAE GAUDIO $642,990Pending5 beds 3 baths3,044 sq. ft.
266 Snowdrop Lane, Elgin, IL 60124
MLS# 12520546Listed by: DAYNAE GAUDIO $763,330Active4 beds 4 baths3,876 sq. ft.
1851 Diamond Drive, Elgin, IL 60124
MLS# 12514814Listed by: HOMESMART CONNECT LLC $685,420Pending5 beds 3 baths3,055 sq. ft.
1847 Diamond Drive, Elgin, IL 60124
MLS# 12504519Listed by: HOMESMART CONNECT LLC $669,990Pending5 beds 3 baths3,055 sq. ft.
3587 Sandstone Circle, Elgin, IL 60124
MLS# 12502824Listed by: HOMESMART CONNECT LLC $699,900Pending3 beds 3 baths2,441 sq. ft.
1855 Chandolin Lane, Elgin, IL 60124
MLS# 12502838Listed by: HOMESMART CONNECT LLC $769,900Active4 beds 4 baths3,876 sq. ft.
1853 Chandolin Lane, Elgin, IL 60124
MLS# 12502778Listed by: HOMESMART CONNECT LLC $728,900Active4 beds 3 baths3,418 sq. ft.
1855 Diamond Drive, Elgin, IL 60124
MLS# 12502807Listed by: HOMESMART CONNECT LLC $309,990Pending2 beds 3 baths1,579 sq. ft.
1439 Oakfield Lane, Pingree Grove, IL 60140
MLS# 12496178Listed by: DAYNAE GAUDIO $340,990Pending3 beds 3 baths1,758 sq. ft.
1435 Oakfield Lane, Pingree Grove, IL 60140
MLS# 12496250Listed by: DAYNAE GAUDIO $789,880Pending4 beds 4 baths3,876 sq. ft.
3588 Sandstone Circle, Elgin, IL 60124
MLS# 12497141Listed by: HOMESMART CONNECT LLC $299,990Pending2 beds 3 baths1,579 sq. ft.
1415 Oakfield Lane, Pingree Grove, IL 60140
MLS# 12595291Listed by: DAYNAE GAUDIO $690,260Pending4 beds 3 baths3,275 sq. ft.
1854 Chandolin Lane, Elgin, IL 60124
MLS# 12448764Listed by: HOMESMART CONNECT LLC $774,730Pending4 beds 4 baths3,876 sq. ft.
1850 Chandolin Lane, Elgin, IL 60124
MLS# 12435832Listed by: HOMESMART CONNECT LLC $584,990Pending4 beds 3 baths2,932 sq. ft.
313 Snowdrop Lane, Elgin, IL 60124
MLS# 12517518Listed by: DAYNAE GAUDIO $555,000Pending4 beds 3 baths2,853 sq. ft.
2898 Killarny Drive, Elgin, IL 60124
MLS# 12405834Listed by: HOMESMART CONNECT LLC $789,880Pending4 beds 3 baths2,420 sq. ft.
1857 Chandolin Lane, Elgin, IL 60124
MLS# 12402856Listed by: RE/MAX ALL PRO - ST CHARLES $745,990Pending4 beds 4 baths3,876 sq. ft.
3591 Sandstone Circle, Elgin, IL 60124
MLS# 12363419Listed by: RE/MAX ALL PRO - ST CHARLES $701,830Pending3 beds 2 baths2,171 sq. ft.
3590 Sandstone Circle, Elgin, IL 60124
MLS# 12344212Listed by: RE/MAX ALL PRO - ST CHARLES $750,150Pending4 beds 4 baths3,799 sq. ft.
3620 Sahara Road, Elgin, IL 60124
MLS# 12308055Listed by: RE/MAX ALL PRO - ST CHARLES $648,990Pending4 beds 3 baths3,125 sq. ft.
3611 Sandstone Circle, Elgin, IL 60124
MLS# 12308004Listed by: RE/MAX ALL PRO - ST CHARLES $672,830Pending3 beds 2 baths2,171 sq. ft.
1867 Chandolin Lane, Elgin, IL 60124
MLS# 12302906Listed by: RE/MAX ALL PRO - ST CHARLES $731,605Pending4 beds 4 baths3,799 sq. ft.
1843 Diamond Drive, Elgin, IL 60124
MLS# 12302353Listed by: RE/MAX ALL PRO - ST CHARLES $718,860Pending4 beds 4 baths3,799 sq. ft.
1857 Diamond Drive, Elgin, IL 60124
MLS# 12278529Listed by: RE/MAX ALL PRO - ST CHARLES $769,760Pending5 beds 4 baths3,800 sq. ft.
1865 Chandolin Lane, Elgin, IL 60124
MLS# 12276115Listed by: RE/MAX ALL PRO - ST CHARLES $675,446Pending3 beds 2 baths2,171 sq. ft.
1863 Chandolin Lane, Elgin, IL 60124
MLS# 12261684Listed by: RE/MAX ALL PRO - ST CHARLES $637,990Pending3 beds 2 baths2,171 sq. ft.
1848 Chandolin Lane, Elgin, IL 60124
MLS# 12213819Listed by: RE/MAX ALL PRO - ST CHARLES $729,990Pending4 beds 3 baths2,420 sq. ft.
1858 Chandolin Lane, Elgin, IL 60124
MLS# 12206883Listed by: RE/MAX ALL PRO - ST CHARLES
Local realty services provided by:CENTURY 21 New Heritage
Copyright 2026 Midwest Real Estate Data LLC. All rights reserved. The data relating to real estate for sale on this web site comes in part from the Broker Reciprocity Program of the Midwest Real Estate Data LLC. Listing information is deemed reliable but not guaranteed.
Neighborhoods near Elgin, IL
Zip codes near Elgin, IL
- 60010 homes for sale
- 60102 homes for sale
- 60103 homes for sale
- 60107 homes for sale
- 60110 homes for sale
- 60118 homes for sale
- 60120 homes for sale
- 60123 homes for sale
- 60124 homes for sale
- 60133 homes for sale
- 60136 homes for sale
- 60169 homes for sale
- 60174 homes for sale
- 60175 homes for sale
- 60177 homes for sale
- 60184 homes for sale
- 60192 homes for sale
- 60193 homes for sale
- 60194 homes for sale
- 60195 homes for sale
Popular searches near Elgin, IL
- Barrington Township homes for sale
- Barrington Hills homes for sale
- Bartlett homes for sale
- Carpentersville homes for sale
- Dundee homes for sale
- East Dundee homes for sale
- Gilberts homes for sale
- Hanover homes for sale
- Hoffman Estates homes for sale
- Plato homes for sale
- St. Charles Township homes for sale
- St. Charles homes for sale
- Sleepy Hollow homes for sale
- South Barrington homes for sale
- South Elgin homes for sale
- Streamwood homes for sale
- Wayne homes for sale
- Wayne homes for sale
- Wayne Township homes for sale
- West Dundee homes for sale
Protect your home and budget from life's surprises with an Assurant Home Warranty, backed by a partner that supports you through every step of homeownership. Explore Plans.
©2026 Century 21 Real Estate LLC. All rights reserved. CENTURY 21®, the CENTURY 21 Logo and C21® are service marks owned by Century 21 Real Estate LLC. Century 21 Real Estate LLC fully supports the principles of the Fair Housing Act and the Equal Opportunity Act. Each office is independently owned and operated. Listing information is deemed reliable but not guaranteed accurate.