- Addison township homes for sale
- Addison homes for sale
- Bellwood homes for sale
- Bensenville homes for sale
- Berkeley homes for sale
- Elmhurst homes for sale
- Franklin Park homes for sale
- Hillside homes for sale
- Leyden Township homes for sale
- Lombard homes for sale
- Maywood homes for sale
- Melrose Park homes for sale
- Northlake homes for sale
- Oak Brook homes for sale
- Oakbrook Terrace homes for sale
- Proviso homes for sale
- Stone Park homes for sale
- Villa Park homes for sale
- Westchester homes for sale
- York homes for sale
60126, IL - homes for sale
153 of 153 results displayed
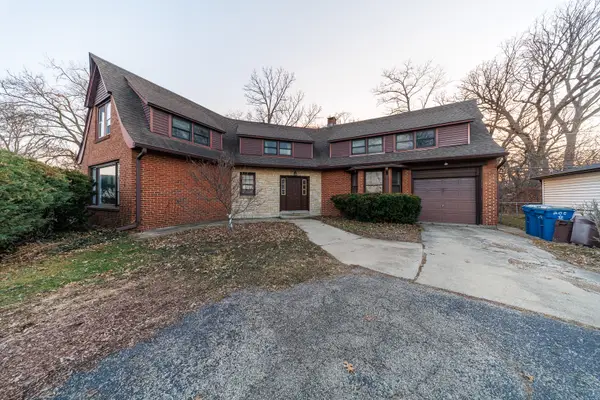
 $1,599,999Pending5 beds 5 baths3,350 sq. ft.
170 W Armitage Avenue, Elmhurst, IL 60126
MLS# 12604455Listed by: AFFORDABLE REAL ESTATE, INC.
- New
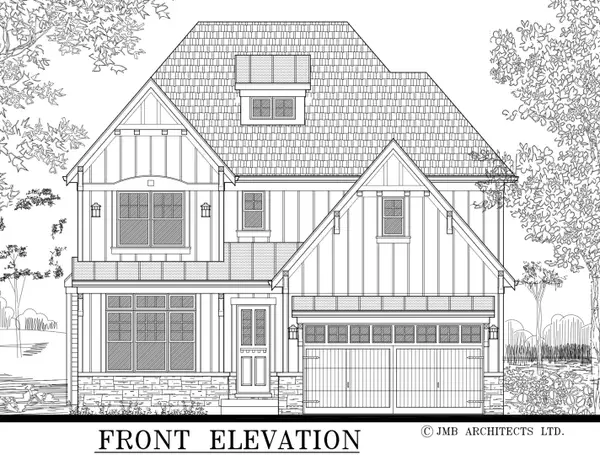
 $575,000Active1 beds -- baths1,166 sq. ft.
270 E Saint Charles Road, Elmhurst, IL 60126
MLS# 12603977Listed by: L.W. REEDY REAL ESTATE - New
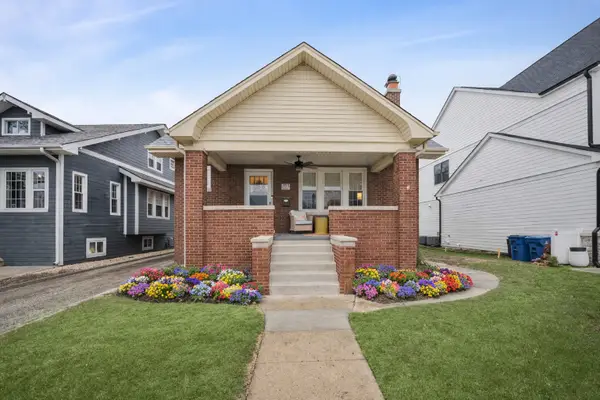
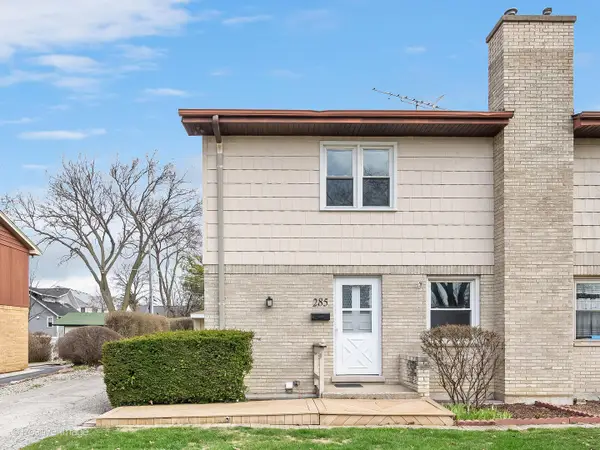 $499,000Active3 beds 2 baths1,430 sq. ft.
285 E 1st Street, Elmhurst, IL 60126
MLS# 12602082Listed by: @PROPERTIES CHRISTIES INTERNATIONAL REAL ESTATE - New
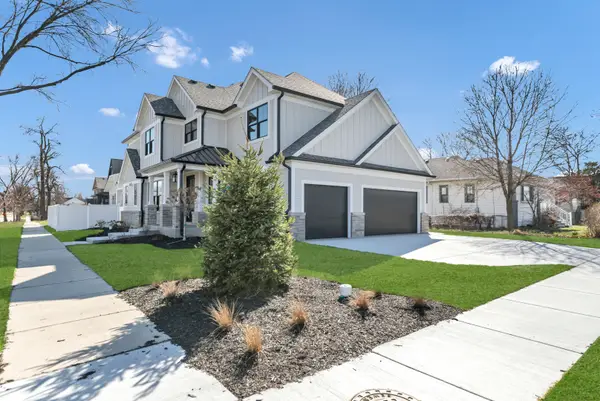
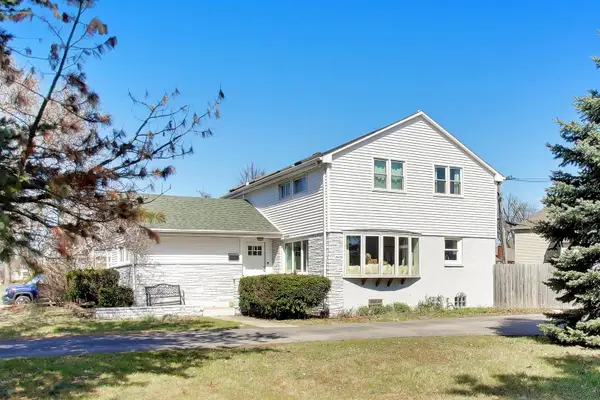
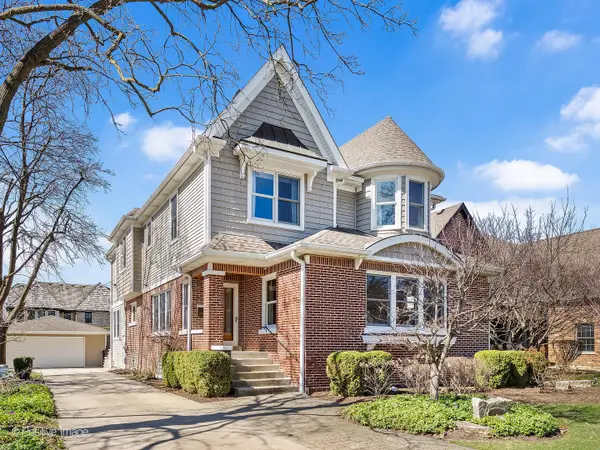 $1,350,000Active6 beds 4 baths4,063 sq. ft.
652 S Fairview Avenue, Elmhurst, IL 60126
MLS# 12600910Listed by: @PROPERTIES CHRISTIES INTERNATIONAL REAL ESTATE - New
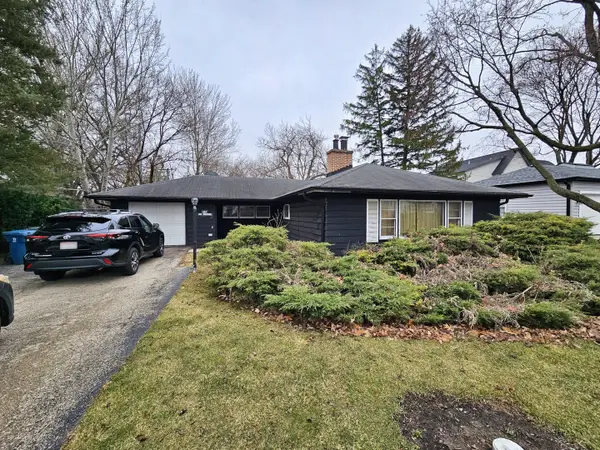
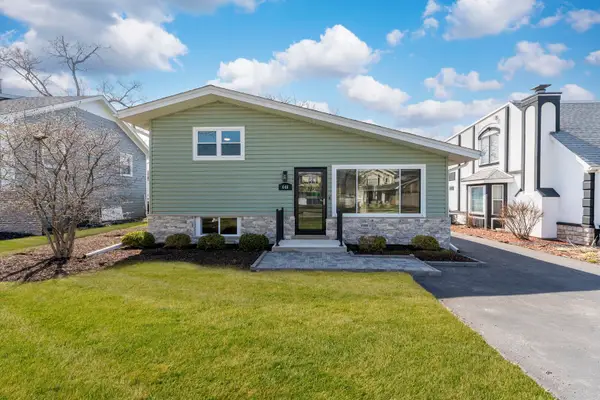
 $475,000Active3 beds 2 baths1,190 sq. ft.
995 S Swain Avenue, Elmhurst, IL 60126
MLS# 12597465Listed by: BERKSHIRE HATHAWAY HOMESERVICES PRAIRIE PATH REALT 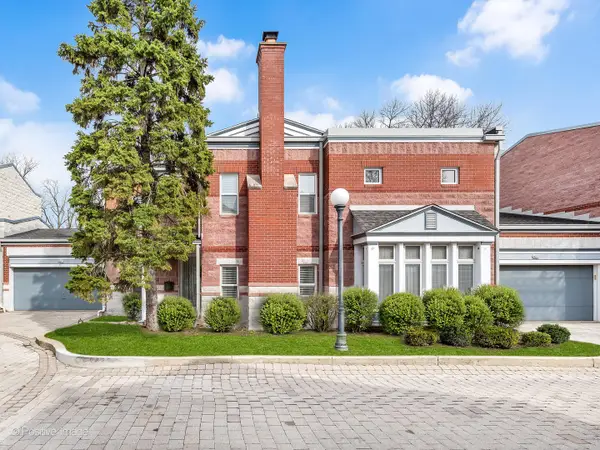 $729,500Pending4 beds 3 baths2,650 sq. ft.
11 Manchester Lane, Elmhurst, IL 60126
MLS# 12599311Listed by: COMPASS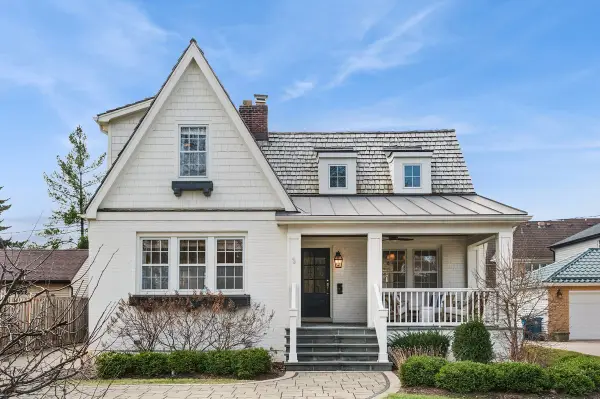 $849,900Pending4 beds 3 baths1,936 sq. ft.
240 W Saint Charles Road, Elmhurst, IL 60126
MLS# 12599436Listed by: BAIRD & WARNER- New
 $739,900Active6 beds 3 baths3,169 sq. ft.
283 N Michigan Avenue, Elmhurst, IL 60126
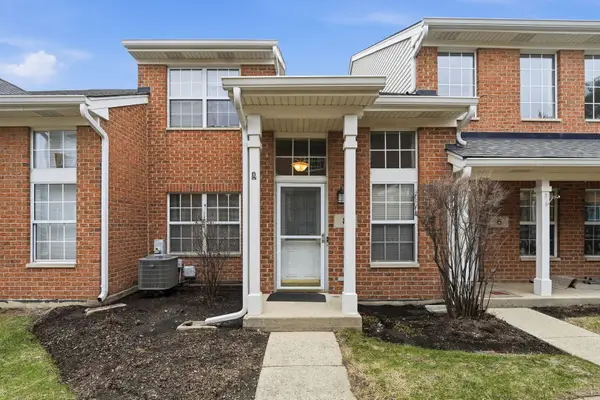
MLS# 12600343Listed by: BAIRD & WARNER  $629,900Pending4 beds 2 baths1,458 sq. ft.
272 N Willow Road, Elmhurst, IL 60126
MLS# 12602391Listed by: COMPASS- New
 $815,000Active4 beds 4 baths2,949 sq. ft.
339 N Emroy Avenue, Elmhurst, IL 60126
MLS# 12598199Listed by: BERKSHIRE HATHAWAY HOMESERVICES STARCK REAL ESTATE - New
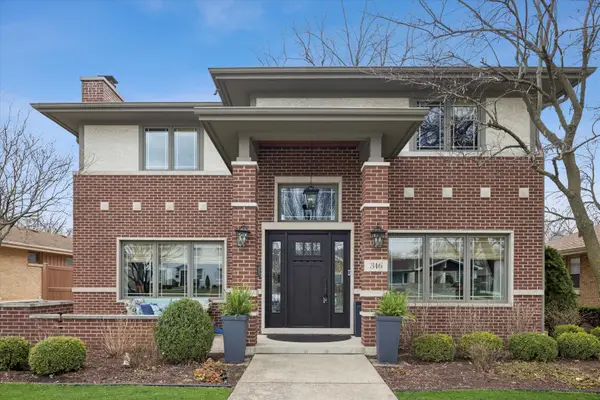 $1,349,900Active4 beds 4 baths3,187 sq. ft.
346 E South Street, Elmhurst, IL 60126
MLS# 12576388Listed by: @PROPERTIES CHRISTIES INTERNATIONAL REAL ESTATE - New
 $415,000Active3 beds 3 baths1,790 sq. ft.
1 Maple Tree Court, Elmhurst, IL 60126
MLS# 12600900Listed by: @PROPERTIES CHRISTIE'S INTERNATIONAL REAL ESTATE - New
 $849,000Active3 beds 3 baths2,047 sq. ft.
221 E Grantley Avenue, Elmhurst, IL 60126
MLS# 12599498Listed by: REMAX LEGENDS  $1,689,000Pending5 beds 6 baths4,345 sq. ft.
936 S Mitchell Avenue, Elmhurst, IL 60126
MLS# 12601281Listed by: TITANIUM REALTY GROUP- New
 $375,000Active3 beds 3 baths1,306 sq. ft.
8 Saint Regis Court, Elmhurst, IL 60126
MLS# 12579246Listed by: XR REALTY 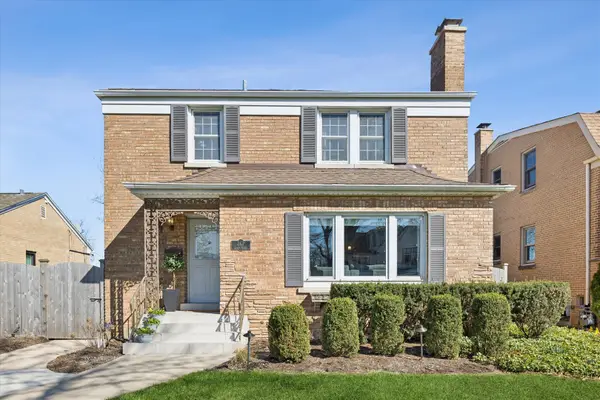 $659,000Pending3 beds 3 baths1,542 sq. ft.
267 N Larch Avenue, Elmhurst, IL 60126
MLS# 12599994Listed by: @PROPERTIES CHRISTIES INTERNATIONAL REAL ESTATE- Open Sat, 11am to 1pmNew
 $725,000Active3 beds 2 baths1,700 sq. ft.
646 W Babcock Avenue, Elmhurst, IL 60126
MLS# 12593924Listed by: CHICAGOLAND BROKERS, INC  $639,000Pending3 beds 2 baths2,854 sq. ft.
348 N Shady Lane, Elmhurst, IL 60126
MLS# 12599214Listed by: KELLER WILLIAMS PREMIERE PROPERTIES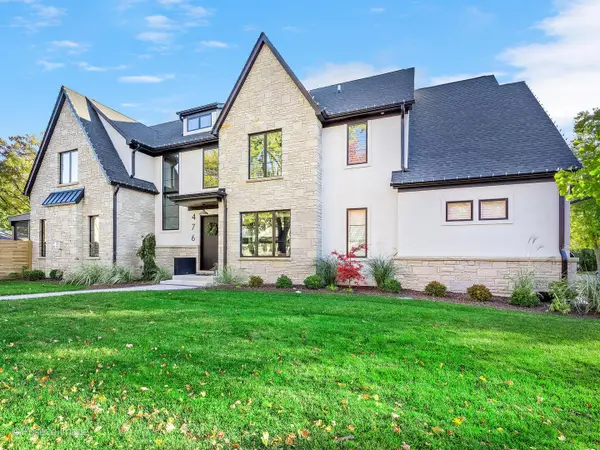 $2,100,000Pending5 beds 5 baths3,778 sq. ft.
476 W Vallette Street, Elmhurst, IL 60126
MLS# 12567975Listed by: JAMESON SOTHEBY'S INTERNATIONAL REALTY- New
 $625,000Active4 beds 3 baths2,280 sq. ft.
206 N Bonnie Brae Avenue, Elmhurst, IL 60126
MLS# 12598639Listed by: REMAX FUTURE - New
 $1,660,000Active5 beds 5 baths4,392 sq. ft.
964 S Hillside Avenue, Elmhurst, IL 60126
MLS# 12590978Listed by: COMPASS 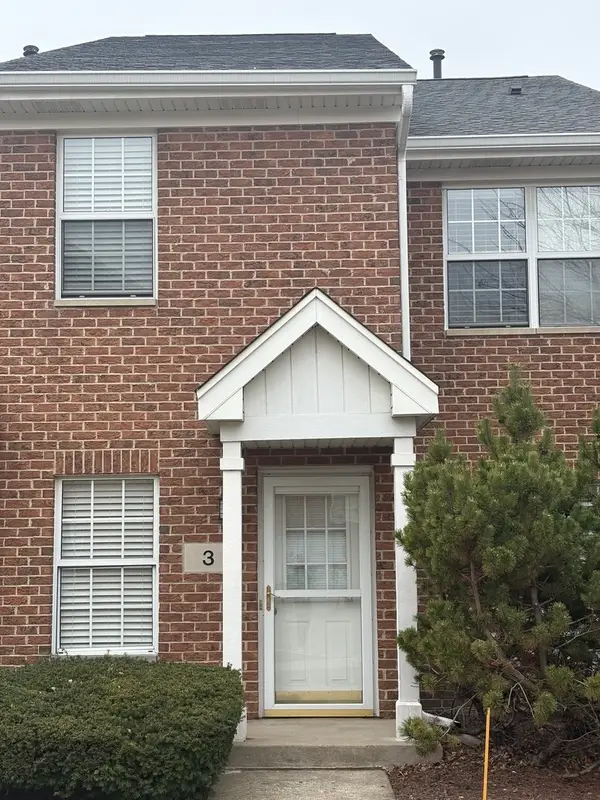 $374,900Pending3 beds 3 baths1,482 sq. ft.
3 Charlotte Circle, Elmhurst, IL 60126
MLS# 12585307Listed by: COYTE ADVANTAGE REALTY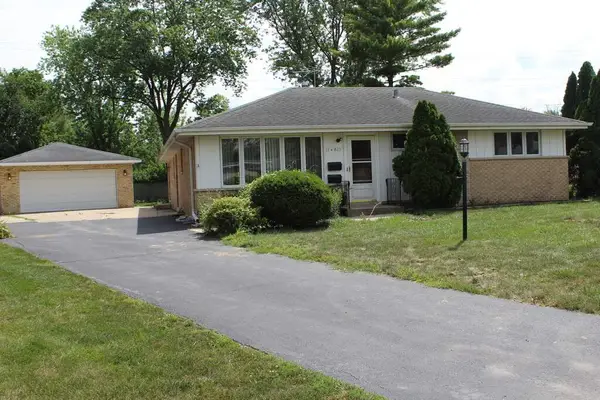 $595,000Active4 beds 3 baths1,837 sq. ft.
15W425 Victory Parkway, Elmhurst, IL 60126
MLS# 12597521Listed by: BERKSHIRE HATHAWAY HOMESERVICES STARCK REAL ESTATE $599,900Pending3 beds 2 baths1,892 sq. ft.
182 E Hale Street, Elmhurst, IL 60126
MLS# 12597185Listed by: COMPASS $430,000Pending3 beds 2 baths1,225 sq. ft.
538 N West Avenue, Elmhurst, IL 60126
MLS# 12586596Listed by: RE/MAX FUTURE $349,900Pending2 beds 3 baths1,305 sq. ft.
3 Dewalt Court, Elmhurst, IL 60126
MLS# 12595907Listed by: @PROPERTIES CHRISTIES INTERNATIONAL REAL ESTATE $749,900Pending3 beds 2 baths1,863 sq. ft.
179 S Lawndale Avenue, Elmhurst, IL 60126
MLS# 12572308Listed by: L.W. REEDY REAL ESTATE $525,000Pending4 beds 2 baths1,613 sq. ft.
293 N Illinois Street, Elmhurst, IL 60126
MLS# 12596130Listed by: @PROPERTIES CHRISTIES INTERNATIONAL REAL ESTATE- New
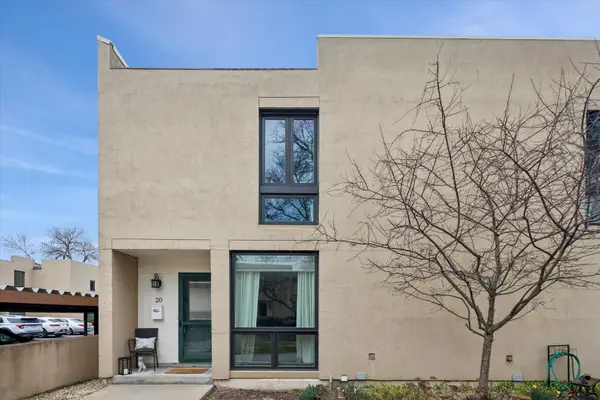 $415,000Active3 beds 3 baths1,790 sq. ft.
20 Oak Tree Court #20, Elmhurst, IL 60126
MLS# 12599831Listed by: @PROPERTIES CHRISTIES INTERNATIONAL REAL ESTATE  $600,000Pending5 beds 3 baths2,300 sq. ft.
330 N Ferndale Avenue, Elmhurst, IL 60126
MLS# 12589059Listed by: COMPASS $220,000Pending2 beds 1 baths
483 N Larch Avenue #204W, Elmhurst, IL 60126
MLS# 12595822Listed by: COMPASS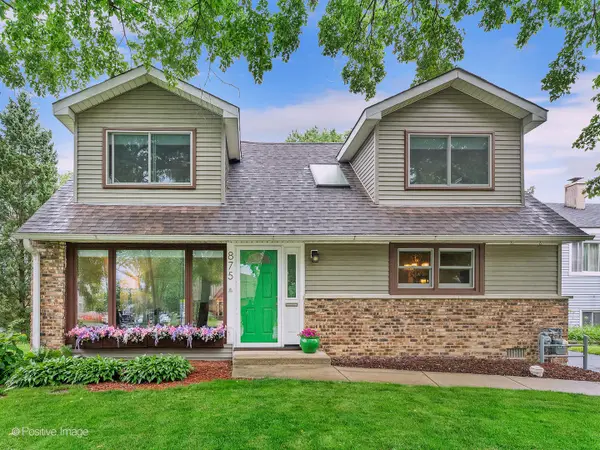 $469,900Active3 beds 2 baths1,716 sq. ft.
875 S York Street, Elmhurst, IL 60126
MLS# 12596193Listed by: COMPASS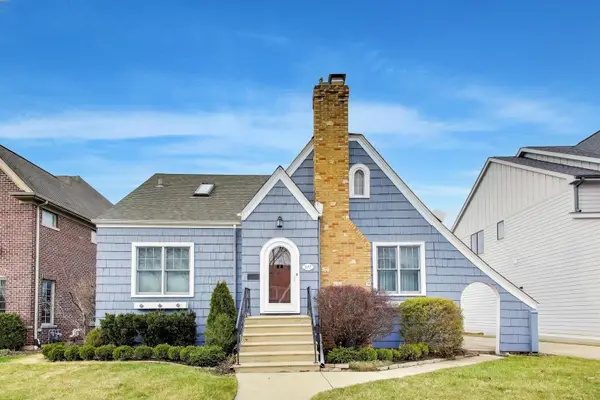 $650,000Pending4 beds 2 baths1,650 sq. ft.
277 E Oneida Avenue, Elmhurst, IL 60126
MLS# 12586202Listed by: COMPASS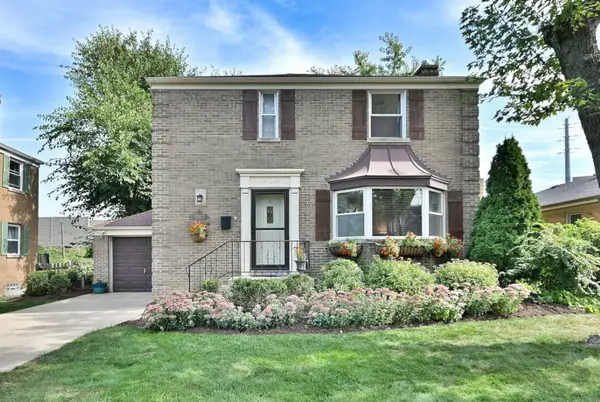 $500,000Active3 beds 2 baths1,272 sq. ft.
593 S Edgewood Avenue, Elmhurst, IL 60126
MLS# 12595539Listed by: KELLER WILLIAMS PREMIERE PROPERTIES $399,000Pending3 beds 1 baths1,327 sq. ft.
413 N Ridgeland Avenue, Elmhurst, IL 60126
MLS# 12595420Listed by: PEZZA REALTY CORPORATION $390,000Active0.23 Acres
426 E Harrison Street, Elmhurst, IL 60126
MLS# 12590985Listed by: COMPASS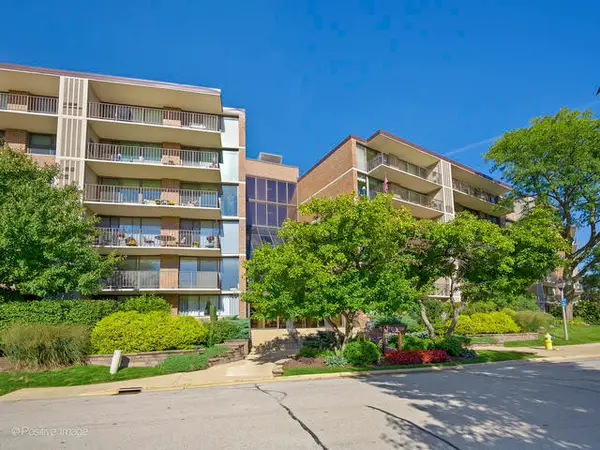 $425,000Pending3 beds 2 baths1,932 sq. ft.
2 S Atrium Way #606, Elmhurst, IL 60126
MLS# 12591824Listed by: L.W. REEDY REAL ESTATE $995,000Pending4 beds 4 baths2,517 sq. ft.
927 S Chatham Avenue, Elmhurst, IL 60126
MLS# 12592341Listed by: REAL PEOPLE REALTY $550,000Pending4 beds 2 baths2,111 sq. ft.
928 S Hillcrest Avenue, Elmhurst, IL 60126
MLS# 12588029Listed by: KELLER WILLIAMS PREMIERE PROPERTIES $1,695,000Active5 beds 5 baths5,569 sq. ft.
602 S Sunnyside Avenue, Elmhurst, IL 60126
MLS# 12589714Listed by: BERKSHIRE HATHAWAY HOMESERVICES CHICAGO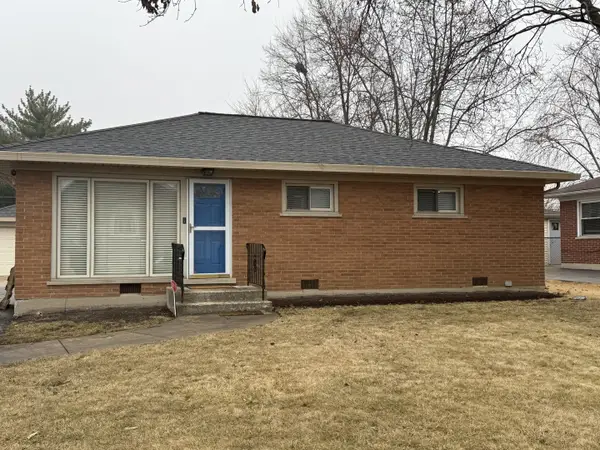 $380,990Pending3 beds 1 baths988 sq. ft.
711 N Kenilworth Avenue, Elmhurst, IL 60126
MLS# 12590433Listed by: CAPORALE REALTY GROUP $519,000Active3 beds 2 baths1,352 sq. ft.
275 W North Avenue, Elmhurst, IL 60126
MLS# 12591350Listed by: @PROPERTIES CHRISTIES INTERNATIONAL REAL ESTATE $1,095,000Pending4 beds 3 baths3,637 sq. ft.
244 S Linden Avenue, Elmhurst, IL 60126
MLS# 12589798Listed by: L.W. REEDY REAL ESTATE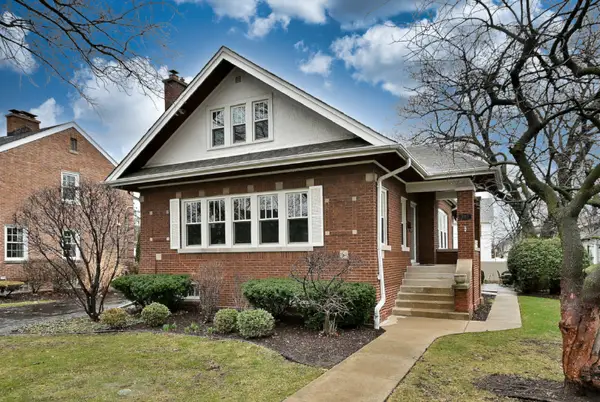 $759,900Pending4 beds 2 baths1,717 sq. ft.
225 S Fairview Avenue, Elmhurst, IL 60126
MLS# 12568357Listed by: L.W. REEDY REAL ESTATE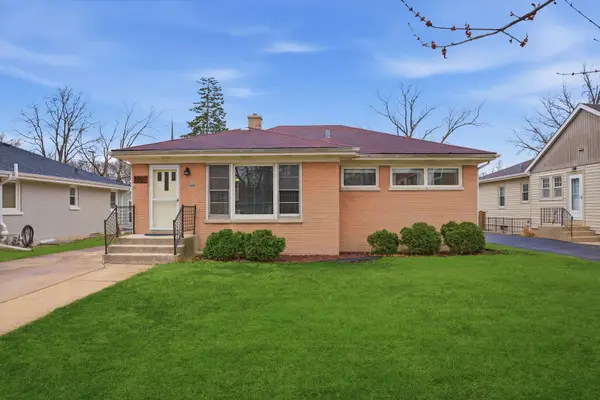 $524,900Pending3 beds 1 baths1,145 sq. ft.
906 S Kirk Avenue, Elmhurst, IL 60126
MLS# 12579557Listed by: KALE REALTY $799,900Pending4 beds 2 baths2,007 sq. ft.
593 S Sunnyside Avenue, Elmhurst, IL 60126
MLS# 12559399Listed by: RE/MAX OF NAPERVILLE $1,399,000Pending5 beds 4 baths3,056 sq. ft.
374 N Myrtle Avenue, Elmhurst, IL 60126
MLS# 12590578Listed by: @PROPERTIES CHRISTIES INTERNATIONAL REAL ESTATE $439,900Pending3 beds 2 baths1,586 sq. ft.
370 N Oak Street, Elmhurst, IL 60126
MLS# 12583125Listed by: KELLER WILLIAMS PREMIERE PROPERTIES $749,000Active4 beds 4 baths1,800 sq. ft.
171 E Cayuga Avenue, Elmhurst, IL 60126
MLS# 12587984Listed by: USREALTY.COM, LLP $775,000Active3 beds 3 baths2,078 sq. ft.
606 S York Street, Elmhurst, IL 60126
MLS# 12582849Listed by: JAMESON SOTHEBY'S INTL REALTY $775,000Active3 beds 2 baths1,968 sq. ft.
105 S Cottage Hill Avenue #206, Elmhurst, IL 60126
MLS# 12579836Listed by: @PROPERTIES CHRISTIES INTERNATIONAL REAL ESTATE $799,900Pending2 beds 4 baths2,187 sq. ft.
142 W 3rd Street #142, Elmhurst, IL 60126
MLS# 12580578Listed by: L.W. REEDY REAL ESTATE $1,799,000Active6 beds 5 baths3,600 sq. ft.
769 S Prospect Avenue, Elmhurst, IL 60126
MLS# 12561873Listed by: @PROPERTIES CHRISTIE'S INTERNATIONAL REAL ESTATE $710,000Active4 beds 3 baths1,900 sq. ft.
656 W Comstock Avenue, Elmhurst, IL 60126
MLS# 12585980Listed by: L.W. REEDY REAL ESTATE $2,200,000Active5 beds 6 baths3,893 sq. ft.
580 S Kearsage Avenue, Elmhurst, IL 60126
MLS# 12583715Listed by: @PROPERTIES CHRISTIES INTERNATIONAL REAL ESTATE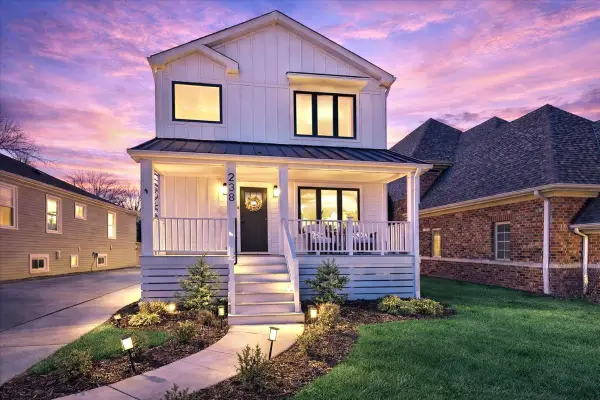 $1,300,000Pending4 beds 5 baths3,508 sq. ft.
238 N Geneva Avenue, Elmhurst, IL 60126
MLS# 12582028Listed by: COMPASS $2,495,000Active5 beds 6 baths5,440 sq. ft.
176 S Arlington Avenue, Elmhurst, IL 60126
MLS# 12585292Listed by: BERKSHIRE HATHAWAY HOMESERVICES CHICAGO $775,000Pending4 beds 2 baths2,147 sq. ft.
124 S Fairlane Avenue, Elmhurst, IL 60126
MLS# 12584352Listed by: WEICHERT, REALTORS - ALL PRO
 $799,000Pending4 beds 2 baths1,700 sq. ft.
558 N Oaklawn Avenue, Elmhurst, IL 60126
MLS# 12584188Listed by: CENTURY 21 CIRCLE $1,750,000Pending5 beds 5 baths3,729 sq. ft.
219 N Clinton Avenue, Elmhurst, IL 60126
MLS# 12574561Listed by: REMAX LEGENDS $189,900Pending2 beds 1 baths950 sq. ft.
3N550 Crown Rd. Road #14, Elmhurst, IL 60126
MLS# 12519960Listed by: ENR REALTY & MANAGEMENT LLC $699,000Pending3 beds 3 baths2,115 sq. ft.
409 S Berkley Avenue, Elmhurst, IL 60126
MLS# 12579506Listed by: @PROPERTIES CHRISTIE'S INTERNATIONAL REAL ESTATE $2,090,000Pending6 beds 5 baths4,193 sq. ft.
Address Withheld By Seller, Elmhurst, IL 60126
MLS# 12564682Listed by: L.W. REEDY REAL ESTATE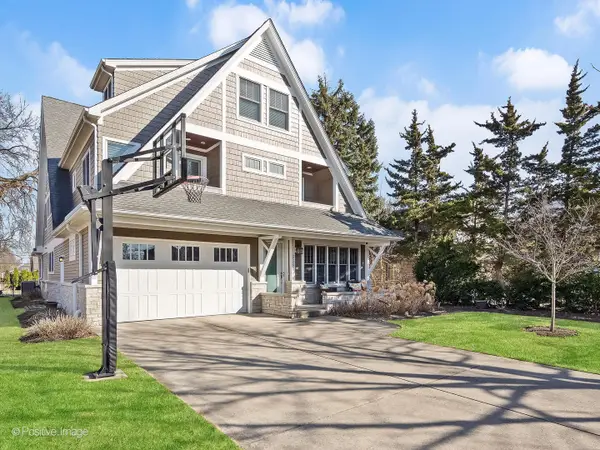 $1,900,000Active6 beds 7 baths5,526 sq. ft.
333 Kenmore Avenue, Elmhurst, IL 60126
MLS# 12583453Listed by: @PROPERTIES CHRISTIES INTERNATIONAL REAL ESTATE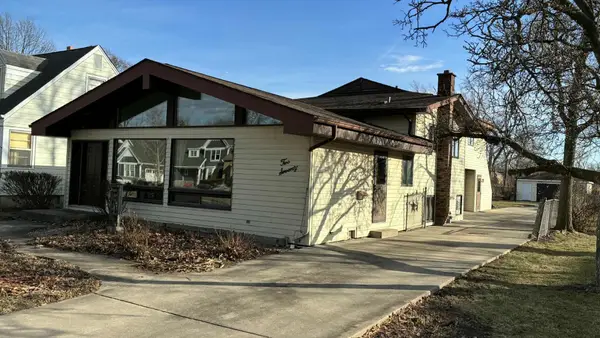 $750,000Active4 beds 3 baths3,217 sq. ft.
270 W Fremont Avenue, Elmhurst, IL 60126
MLS# 12575317Listed by: BAIRD & WARNER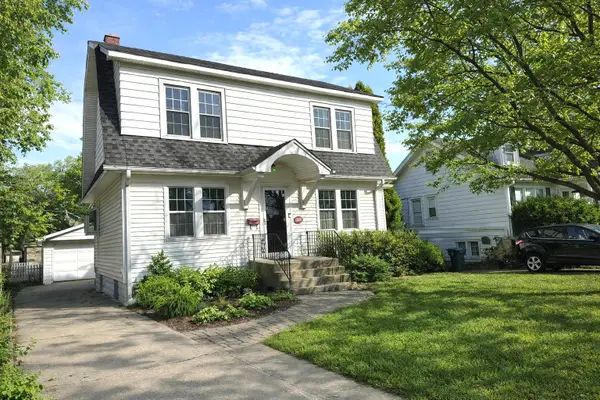 $475,000Active4 beds 2 baths1,935 sq. ft.
251 S Oakland, Elmhurst, IL 60126
MLS# 12578046Listed by: HOMESMART CONNECT LLC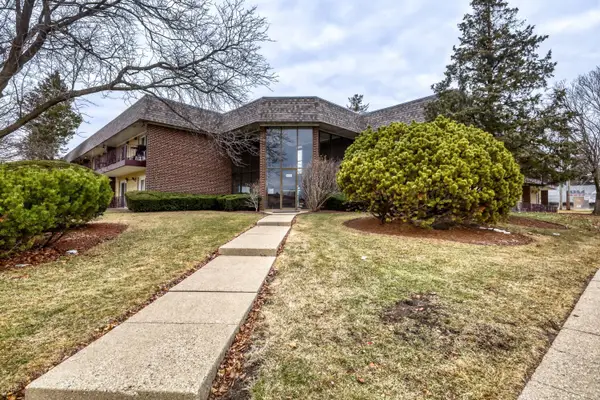 $245,900Pending2 beds 1 baths1,000 sq. ft.
3N550 Crown Road #1, Elmhurst, IL 60126
MLS# 12576723Listed by: THE AGENCY X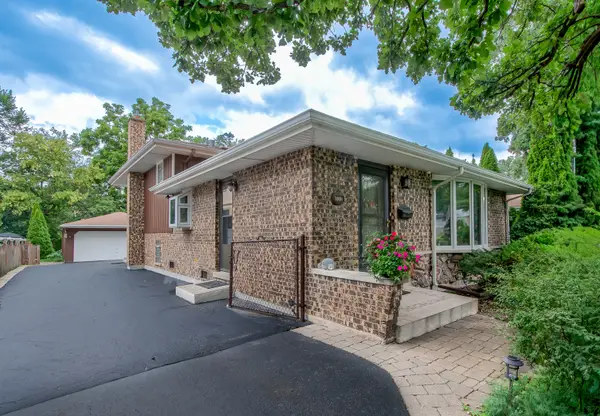 $549,900Pending3 beds 2 baths2,011 sq. ft.
332 N West Avenue, Elmhurst, IL 60126
MLS# 12578956Listed by: SELL SMART REALTY GROUP INC.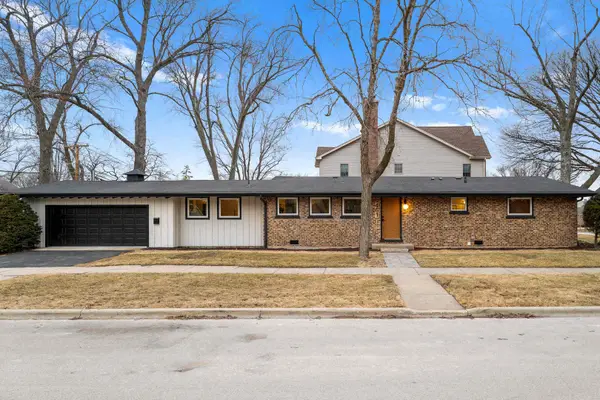 $799,000Pending3 beds 2 baths1,610 sq. ft.
461 W Grantley Avenue, Elmhurst, IL 60126
MLS# 12578296Listed by: CIRCLE ONE REALTY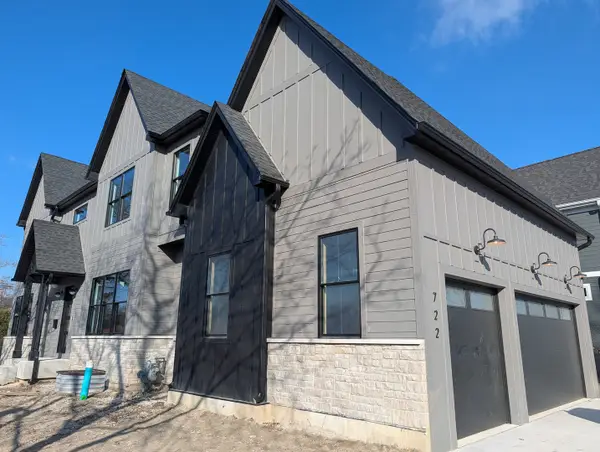 $1,689,900Pending5 beds 5 baths3,450 sq. ft.
722 S Berkley Avenue, Elmhurst, IL 60126
MLS# 12577464Listed by: J D REALTY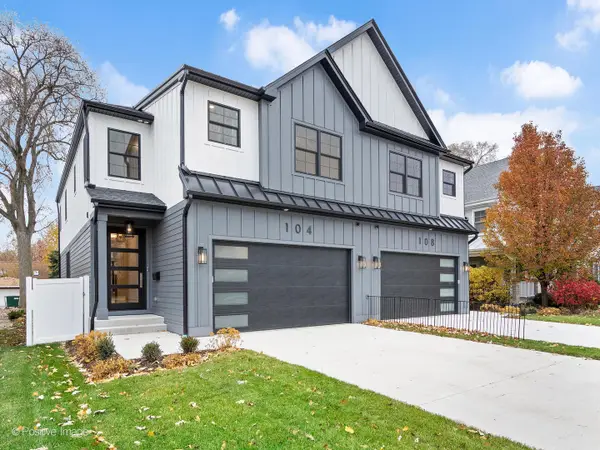 $1,169,000Active3 beds 5 baths2,269 sq. ft.
104 N Evergreen Avenue, Elmhurst, IL 60126
MLS# 12575541Listed by: COMPASS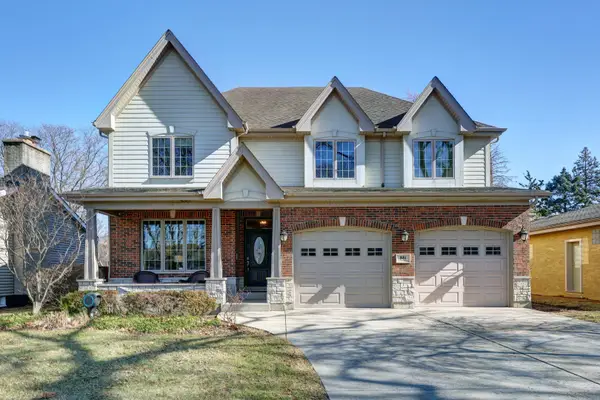 $1,299,000Pending4 beds 5 baths4,470 sq. ft.
881 S Bryan Street, Elmhurst, IL 60126
MLS# 12568752Listed by: COLDWELL BANKER STRATFORD PLACE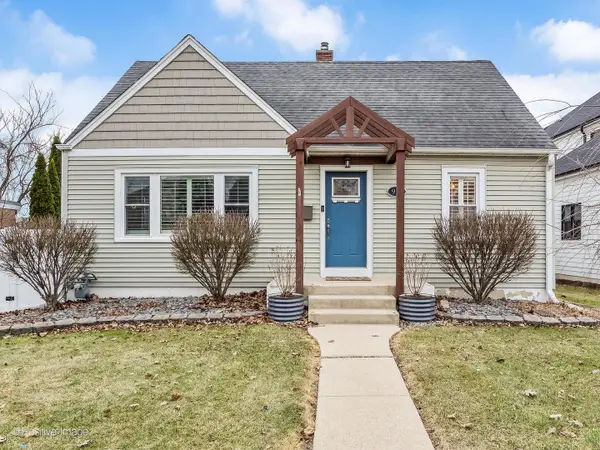 $575,000Pending3 beds 2 baths
918 S Cambridge Avenue, Elmhurst, IL 60126
MLS# 12572942Listed by: COMPASS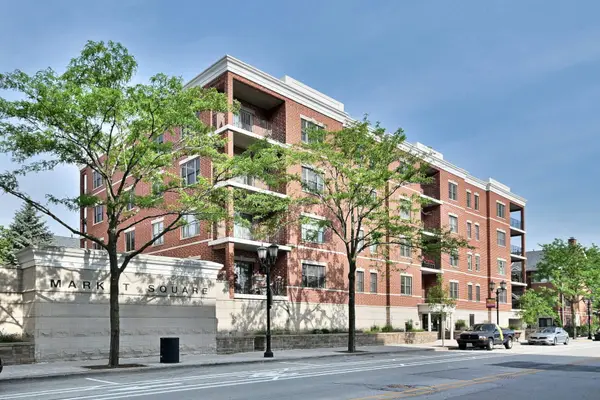 $559,000Active2 beds 2 baths1,260 sq. ft.
210 N Addison Avenue #301, Elmhurst, IL 60126
MLS# 12592311Listed by: L.W. REEDY REAL ESTATE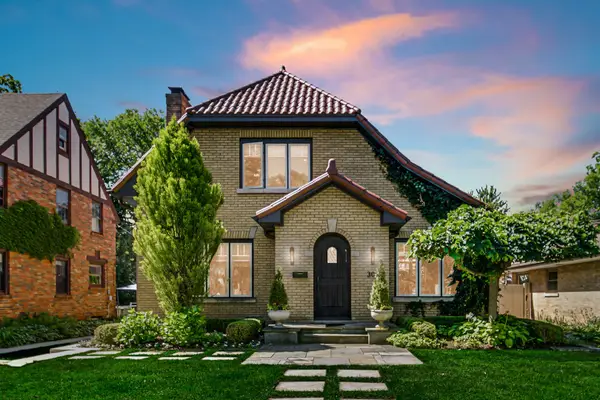 $945,000Pending3 beds 3 baths2,046 sq. ft.
300 W Elm Park Avenue, Elmhurst, IL 60126
MLS# 12566944Listed by: COLDWELL BANKER REALTY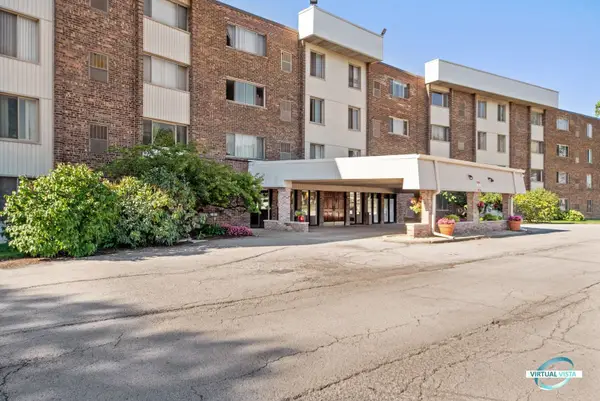 $209,900Pending2 beds 2 baths1,005 sq. ft.
841 N York Street #202, Elmhurst, IL 60126
MLS# 12558862Listed by: EXP REALTY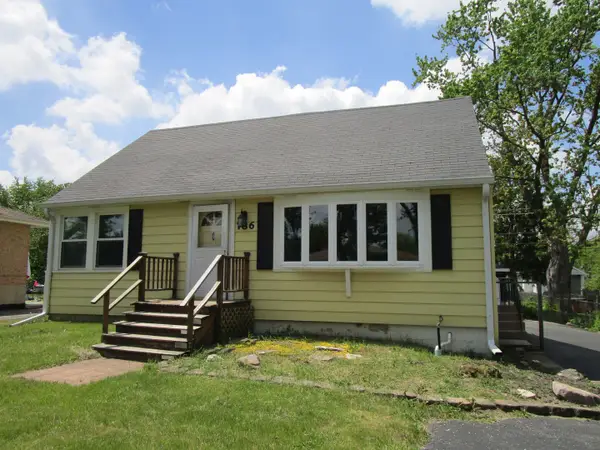 $279,900Pending3 beds 1 baths1,379 sq. ft.
786 N Van Auken Street, Elmhurst, IL 60126
MLS# 12571711Listed by: FIELD STREET PROPERTIES, LLC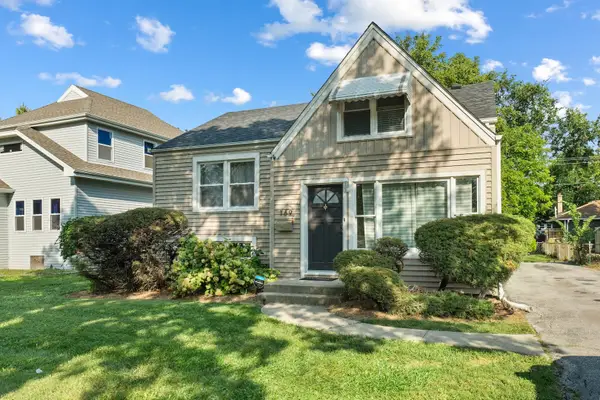 $360,000Pending3 beds 1 baths1,528 sq. ft.
169 S Villa Avenue, Elmhurst, IL 60126
MLS# 12567646Listed by: VESTA PREFERRED LLC $405,000Pending4 beds 2 baths1,191 sq. ft.
237 S Villa Avenue, Elmhurst, IL 60126
MLS# 12570707Listed by: PORCAYO & ASSOCIATES REALTY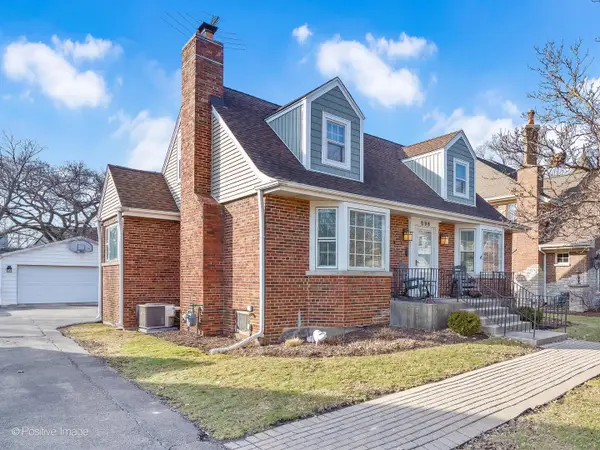 $695,000Pending4 beds 2 baths1,954 sq. ft.
696 S Prospect Avenue, Elmhurst, IL 60126
MLS# 12582771Listed by: PEZZA REALTY CORPORATION $359,900Active3 beds 1 baths938 sq. ft.
192 N Bonnie Brae Avenue, Elmhurst, IL 60126
MLS# 12568369Listed by: EXP REALTY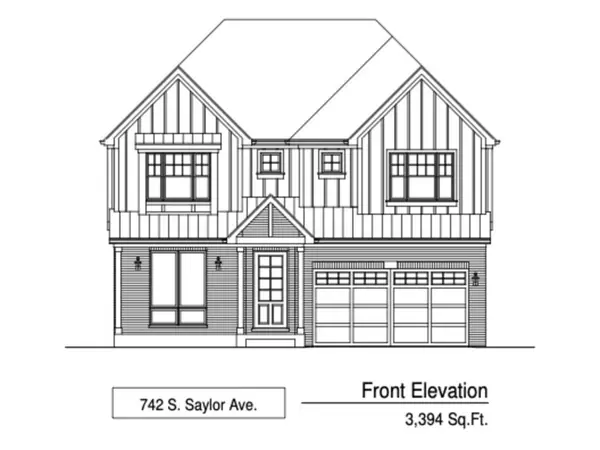 $1,679,900Active5 beds 5 baths3,394 sq. ft.
742 S Saylor Avenue, Elmhurst, IL 60126
MLS# 12565290Listed by: L.W. REEDY REAL ESTATE $1,399,900Active5 beds 5 baths3,807 sq. ft.
406 S Poplar Avenue, Elmhurst, IL 60126
MLS# 12567635Listed by: @PROPERTIES CHRISTIES INTERNATIONAL REAL ESTATE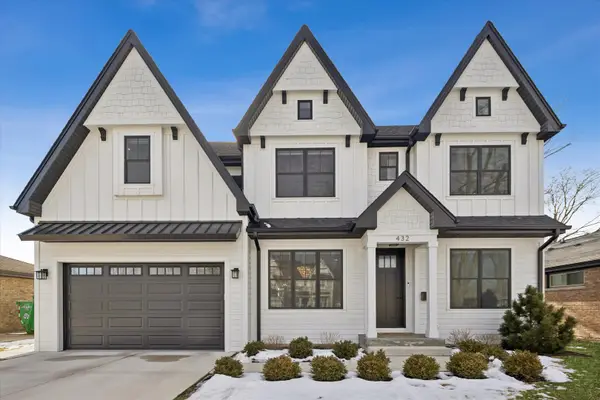 $1,550,000Pending5 beds 5 baths3,713 sq. ft.
432 N Ridgeland Avenue, Elmhurst, IL 60126
MLS# 12552274Listed by: @PROPERTIES CHRISTIES INTERNATIONAL REAL ESTATE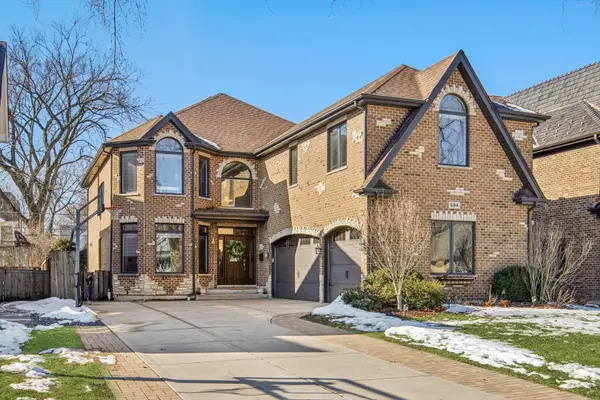 $1,390,000Pending5 beds 5 baths3,643 sq. ft.
594 S Fairfield Avenue, Elmhurst, IL 60126
MLS# 12552191Listed by: @PROPERTIES CHRISTIES INTERNATIONAL REAL ESTATE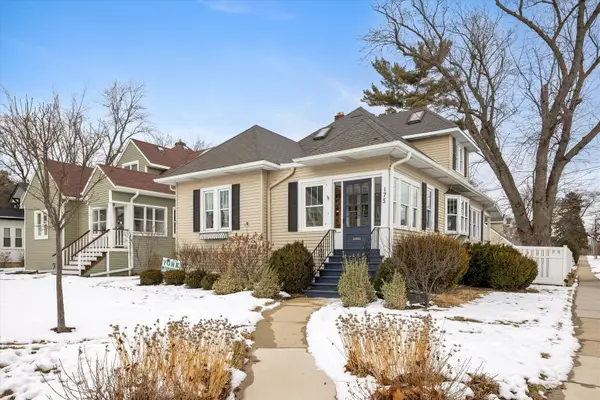 $725,000Pending4 beds 2 baths1,610 sq. ft.
175 N Berteau Avenue, Elmhurst, IL 60126
MLS# 12577483Listed by: @PROPERTIES CHRISTIES INTERNATIONAL REAL ESTATE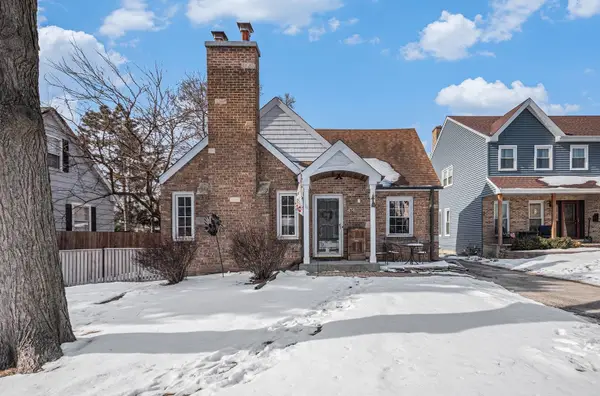 $589,000Pending4 beds 3 baths2,200 sq. ft.
474 S York Street, Elmhurst, IL 60126
MLS# 12560803Listed by: CENTURY 21 INTEGRA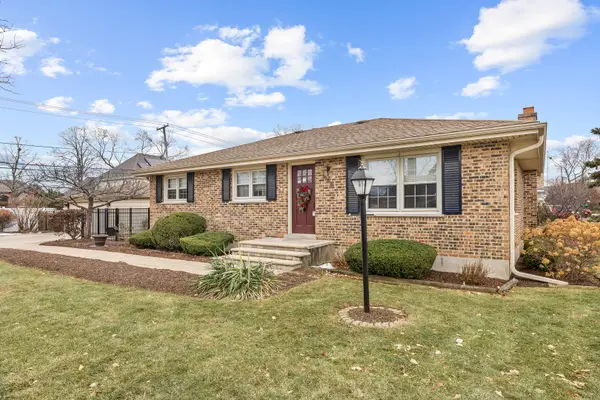 $525,000Pending3 beds 3 baths1,218 sq. ft.
132 E Gladys Avenue, Elmhurst, IL 60126
MLS# 12565651Listed by: RE/MAX PLAZA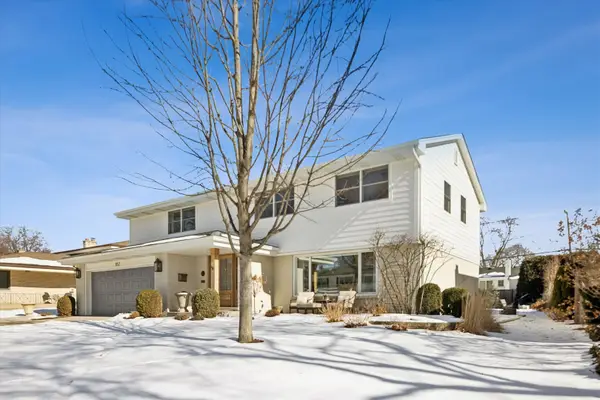 $1,275,000Pending4 beds 3 baths2,863 sq. ft.
857 S Euclid Avenue, Elmhurst, IL 60126
MLS# 12578924Listed by: @PROPERTIES CHRISTIES INTERNATIONAL REAL ESTATE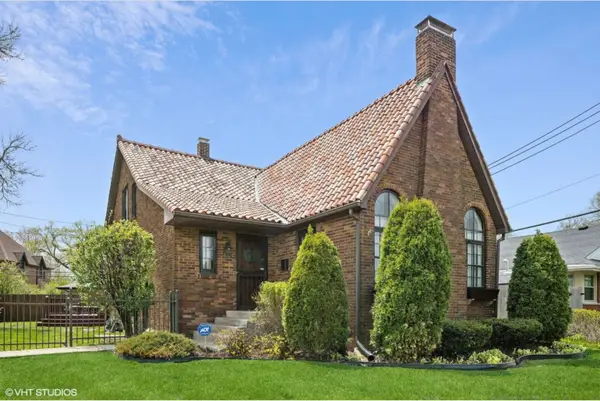 $649,900Pending3 beds 2 baths1,700 sq. ft.
330 E Saint Charles Road, Elmhurst, IL 60126
MLS# 12581029Listed by: COMPASS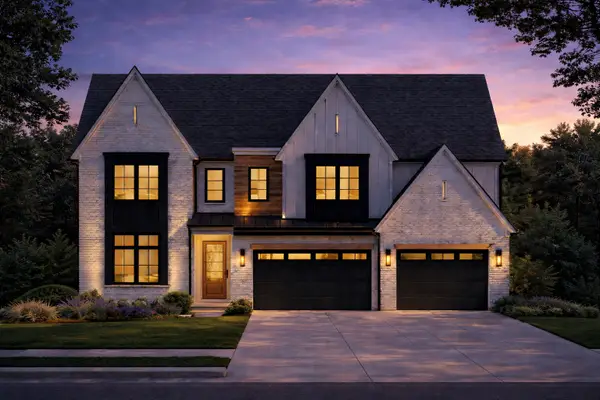 $2,700,000Pending6 beds 6 baths4,850 sq. ft.
215 S Sunnyside Avenue, Elmhurst, IL 60126
MLS# 12562636Listed by: @PROPERTIES CHRISTIES INTERNATIONAL REAL ESTATE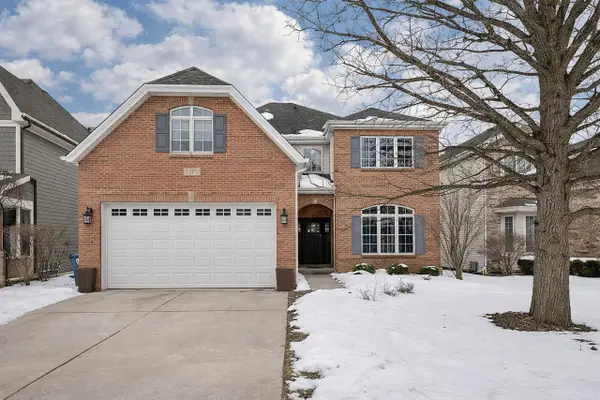 $1,399,900Pending5 beds 4 baths3,237 sq. ft.
146 N Walnut Street, Elmhurst, IL 60126
MLS# 12560821Listed by: @PROPERTIES CHRISTIES INTERNATIONAL REAL ESTATE $459,900Pending3 beds 2 baths
465 W Verret Street, Elmhurst, IL 60126
MLS# 12548630Listed by: KELLER WILLIAMS PREMIERE PROPERTIES $476,000Active4 beds 3 baths1,445 sq. ft.
3N264 N Howard Avenue, Elmhurst, IL 60126
MLS# 12554478Listed by: COLDWELL BANKER REALTY $1,595,000Active5 beds 4 baths3,375 sq. ft.
528 N West Avenue, Elmhurst, IL 60126
MLS# 12548919Listed by: REAL BROKER, LLC $1,495,000Active5 beds 4 baths3,375 sq. ft.
526 N West Avenue, Elmhurst, IL 60126
MLS# 12558328Listed by: REAL BROKER, LLC $489,900Pending2 beds 2 baths1,359 sq. ft.
365 N Walnut Street, Elmhurst, IL 60126
MLS# 12554175Listed by: @PROPERTIES CHRISTIES INTERNATIONAL REAL ESTATE $1,899,900Active5 beds 5 baths3,818 sq. ft.
421 S Berkley Avenue, Elmhurst, IL 60126
MLS# 12558039Listed by: J D REALTY $1,249,900Active3 beds 5 baths2,269 sq. ft.
108 N Evergreen Avenue, Elmhurst, IL 60126
MLS# 12557463Listed by: COMPASS $2,150,000Pending5 beds 6 baths3,702 sq. ft.
147 N Myrtle Avenue, Elmhurst, IL 60126
MLS# 12498838Listed by: @PROPERTIES CHRISTIES INTERNATIONAL REAL ESTATE $185,000Active1 beds 1 baths800 sq. ft.
841 N York Road #218, Elmhurst, IL 60126
MLS# 12551641Listed by: COLDWELL BANKER REALTY $325,000Active0.15 Acres
868 S Spring Road, Elmhurst, IL 60126
MLS# 12523641Listed by: EAR REAL ESTATE, LTD. $169,900Active1 beds 1 baths750 sq. ft.
841 N York Street #109, Elmhurst, IL 60126
MLS# 12549886Listed by: COMPASS $2,199,000Active6 beds 5 baths3,758 sq. ft.
160 E Cayuga Avenue, Elmhurst, IL 60126
MLS# 12492364Listed by: @PROPERTIES CHRISTIES INTERNATIONAL REAL ESTATE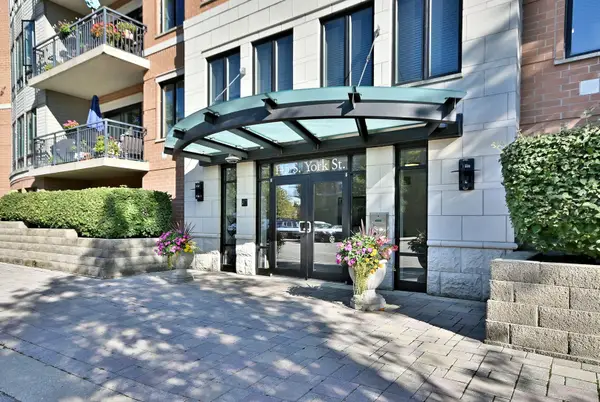 $505,000Active2 beds 2 baths1,200 sq. ft.
145 S York Street #404, Elmhurst, IL 60126
MLS# 12596071Listed by: KELLER WILLIAMS PREMIERE PROPERTIES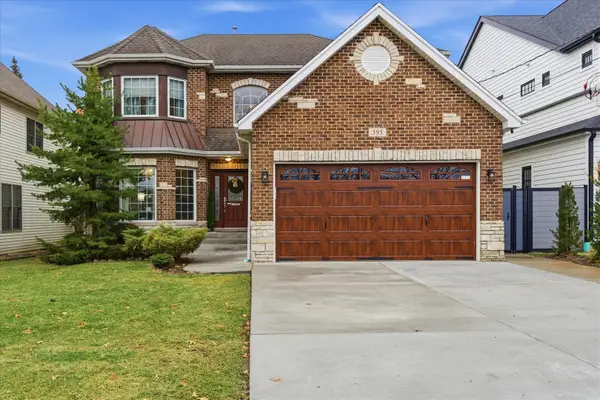 $1,365,000Active7 beds 5 baths3,164 sq. ft.
395 S Scott Street, Elmhurst, IL 60126
MLS# 12546530Listed by: COLDWELL BANKER REALTY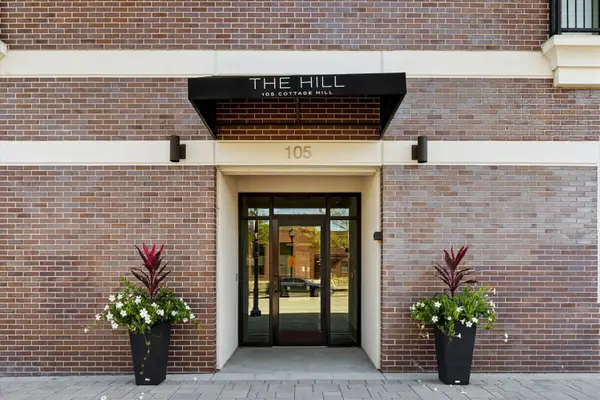 $679,900Active2 beds 2 baths1,352 sq. ft.
105 S Cottage Hill Avenue #304, Elmhurst, IL 60126
MLS# 12547227Listed by: COMPASS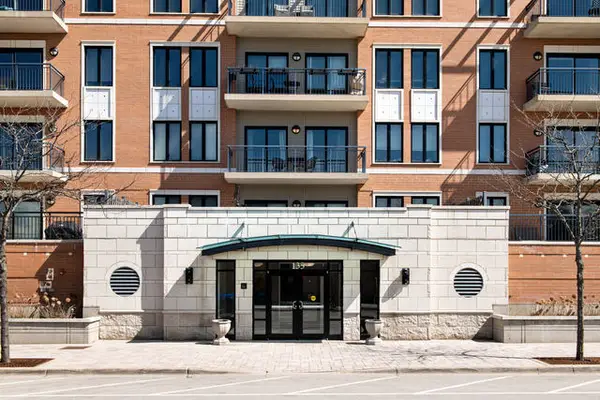 $549,900Pending2 beds 2 baths1,219 sq. ft.
135 S York Street #314, Elmhurst, IL 60126
MLS# 12547030Listed by: BERKSHIRE HATHAWAY HOMESERVICES PRAIRIE PATH REALT $2,300,000Active5 beds 6 baths4,291 sq. ft.
220 N Geneva Avenue, Elmhurst, IL 60126
MLS# 12546375Listed by: @PROPERTIES CHRISTIE'S INTERNATIONAL REAL ESTATE $1,599,999Active5 beds 5 baths3,400 sq. ft.
769 S Fairview Avenue, Elmhurst, IL 60126
MLS# 12546010Listed by: REAL 1 REALTY $509,900Pending4 beds 2 baths1,471 sq. ft.
956 S Cadwell Avenue, Elmhurst, IL 60126
MLS# 12567862Listed by: BAIRD & WARNER $1,679,900Active6 beds 5 baths3,803 sq. ft.
594 W Comstock Avenue, Elmhurst, IL 60126
MLS# 12544929Listed by: L.W. REEDY REAL ESTATE $1,689,000Pending6 beds 5 baths3,803 sq. ft.
456 Elm Street, Elmhurst, IL 60126
MLS# 12541217Listed by: L.W. REEDY REAL ESTATE $1,675,000Active5 beds 5 baths3,600 sq. ft.
663 S Hawthorne Avenue, Elmhurst, IL 60126
MLS# 12541230Listed by: L.W. REEDY REAL ESTATE $1,699,000Active6 beds 5 baths3,803 sq. ft.
367 N Oak Street, Elmhurst, IL 60126
MLS# 12544904Listed by: L.W. REEDY REAL ESTATE $549,900Active0 Acres
655 W Comstock Avenue, Elmhurst, IL 60126
MLS# 12544875Listed by: L.W. REEDY REAL ESTATE $495,000Pending0 Acres
788 S Cambridge Avenue, Elmhurst, IL 60126
MLS# 12542581Listed by: @PROPERTIES CHRISTIE'S INTERNATIONAL REAL ESTATE $3,250,000Active5 beds 6 baths4,244 sq. ft.
224 E May Street, Elmhurst, IL 60126
MLS# 12541768Listed by: @PROPERTIES CHRISTIE'S INTERNATIONAL REAL ESTATE $3,500,000Active6 beds 7 baths5,788 sq. ft.
251 E South Street, Elmhurst, IL 60126
MLS# 12538715Listed by: @PROPERTIES CHRISTIE'S INTERNATIONAL REAL ESTATE $12,400Active0.55 Acres
4 LOTS Elm Drive, Mill Creek, IL 62961
MLS# EB453189Listed by: EXIT REALTY NEW BEGINNINGZ $530,000Active4 beds 3 baths1,500 sq. ft.
516 N Emroy Avenue, Elmhurst, IL 60126
MLS# 12507358Listed by: HOMESMART CONNECT LLC $1,599,900Pending5 beds 5 baths3,550 sq. ft.
284 N Highland Avenue, Elmhurst, IL 60126
MLS# 12532105Listed by: @PROPERTIES CHRISTIES INTERNATIONAL REAL ESTATE $1,625,000Active4 beds 5 baths5,103 sq. ft.
256 Addison Avenue N, Elmhurst, IL 60126
MLS# 12531434Listed by: L.W. REEDY REAL ESTATE $449,500Pending0.47 Acres
740 N Junior Terrace, Elmhurst, IL 60126
MLS# 12529756Listed by: RE/MAX LIBERTY $2,200,000Active5 beds 6 baths3,750 sq. ft.
515 S Parkview Avenue, Elmhurst, IL 60126
MLS# 12526981Listed by: @PROPERTIES CHRISTIES INTERNATIONAL REAL ESTATE $1,699,900Pending5 beds 6 baths4,153 sq. ft.
234 E Grantley Avenue, Elmhurst, IL 60126
MLS# 12521476Listed by: @PROPERTIES CHRISTIES INTERNATIONAL REAL ESTATE $1,850,000Active5 beds 5 baths4,959 sq. ft.
837 S Kearsage Avenue, Elmhurst, IL 60126
MLS# 12520597Listed by: COYTE ADVANTAGE REALTY $1,250,000Pending3 beds 3 baths2,162 sq. ft.
195 N Addison Avenue #PH03, Elmhurst, IL 60126
MLS# 12517102Listed by: BAIRD & WARNER FOX VALLEY - GENEVA $1,599,999Active5 beds 5 baths3,400 sq. ft.
444 E Schiller Street, Elmhurst, IL 60126
MLS# 12513475Listed by: REAL 1 REALTY $1,399,999Pending5 beds 5 baths3,400 sq. ft.
Address Withheld By Seller, Elmhurst, IL 60126
MLS# 12513472Listed by: REAL 1 REALTY $2,150,000Pending5 beds 6 baths3,702 sq. ft.
196 N Walnut Street, Elmhurst, IL 60126
MLS# 12539986Listed by: @PROPERTIES CHRISTIES INTERNATIONAL REAL ESTATE $230,000Pending3 beds 2 baths1,302 sq. ft.
110 W Butterfield Road #502S, Elmhurst, IL 60126
MLS# 12504906Listed by: BETTER HOMES & GARDENS REAL ESTATE CONNECTIONS $528,000Pending3 beds 3 baths1,739 sq. ft.
634 S Spring Road, Elmhurst, IL 60126
MLS# 12504659Listed by: COLDWELL BANKER REALTY $724,900Active3 beds 3 baths2,184 sq. ft.
15 Manchester Lane, Elmhurst, IL 60126
MLS# 12594026Listed by: COLDWELL BANKER REALTY $1,650,000Active5 beds 5 baths3,841 sq. ft.
15W320 Concord Street, Elmhurst, IL 60126
MLS# 12487686Listed by: @PROPERTIES CHRISTIES INTERNATIONAL REAL ESTATE $1,625,000Pending3 beds 5 baths5,103 sq. ft.
254 N Addison Avenue, Elmhurst, IL 60126
MLS# 12405704Listed by: L.W. REEDY REAL ESTATE $2,199,000Pending5 beds 5 baths4,319 sq. ft.
274 E Crescent Avenue, Elmhurst, IL 60126
MLS# 12337649Listed by: BERKSHIRE HATHAWAY HOMESERVICES CHICAGO $1,729,000Pending5 beds 5 baths4,959 sq. ft.
286 N Indiana Avenue, Elmhurst, IL 60126
MLS# 12579443Listed by: COYTE ADVANTAGE REALTY $1,199,900Pending4 beds 4 baths3,429 sq. ft.
557 N Myrtle Avenue, Elmhurst, IL 60126
MLS# 12504223Listed by: @PROPERTIES CHRISTIES INTERNATIONAL REAL ESTATE $1,625,000Pending3 beds 5 baths5,103 sq. ft.
260 N Addison Avenue, Elmhurst, IL 60126
MLS# 12405700Listed by: L.W. REEDY REAL ESTATE $1,675,000Pending6 beds 5 baths5,480 sq. ft.
322 N Highland Avenue, Elmhurst, IL 60126
MLS# 12481416Listed by: L.W. REEDY REAL ESTATE $375,000Pending3 beds 1 baths1,060 sq. ft.
738 N Parker Street, Elmhurst, IL 60126
MLS# 12560918Listed by: @PROPERTIES CHRISTIES INTERNATIONAL REAL ESTATE $1,575,000Pending4 beds 5 baths3,500 sq. ft.
468 N Highland Avenue, Elmhurst, IL 60126
MLS# 12478828Listed by: @PROPERTIES CHRISTIES INTERNATIONAL REAL ESTATE $2,575,000Pending5 beds 6 baths5,867 sq. ft.
153 S Kenmore Avenue, Elmhurst, IL 60126
MLS# 12540436Listed by: @PROPERTIES CHRISTIES INTERNATIONAL REAL ESTATE $329,000Active2 beds 2 baths1,201 sq. ft.
1200 S Prospect Avenue #108, Elmhurst, IL 60126
MLS# 12466494Listed by: @PROPERTIES CHRISTIES INTERNATIONAL REAL ESTATE $1,675,000Active4 beds 5 baths3,500 sq. ft.
183 E Grantley Avenue, Elmhurst, IL 60126
MLS# 12447392Listed by: @PROPERTIES CHRISTIES INTERNATIONAL REAL ESTATE $1,670,000Active5 beds 5 baths3,293 sq. ft.
570 S Parkside Avenue, Elmhurst, IL 60126
MLS# 12567175Listed by: L.W. REEDY REAL ESTATE $1,799,000Active6 beds 6 baths4,055 sq. ft.
680 S Bryan Street, Elmhurst, IL 60126
MLS# 12542649Listed by: L.W. REEDY REAL ESTATE $2,399,000Active7 beds 7 baths5,700 sq. ft.
377 S Prairie Avenue, Elmhurst, IL 60126
MLS# 12566097Listed by: @PROPERTIES CHRISTIE'S INTERNATIONAL REAL ESTATE $1,625,000Active4 beds 5 baths5,103 sq. ft.
258 Addison Avenue, Elmhurst, IL 60126
MLS# 12464430Listed by: L.W. REEDY REAL ESTATE $1,800,000Pending6 beds 6 baths4,420 sq. ft.
208 S Highland Avenue, Elmhurst, IL 60126
MLS# 12343427Listed by: @PROPERTIES CHRISTIE'S INTERNATIONAL REAL ESTATE $795,000Active4 beds 3 baths1,944 sq. ft.
366 S Rex Boulevard, Elmhurst, IL 60126
MLS# 11947407Listed by: COLDWELL BANKER REALTY $275,000Active0.32 Acres
909 N Addison Avenue, Elmhurst, IL 60126
MLS# 12449212Listed by: BERKSHIRE HATHAWAY HOMESERVICES PRAIRIE PATH REALT
Local realty services provided by:CENTURY 21 Affiliated
Copyright 2026 Midwest Real Estate Data LLC. All rights reserved. The data relating to real estate for sale on this web site comes in part from the Broker Reciprocity Program of the Midwest Real Estate Data LLC. Listing information is deemed reliable but not guaranteed.
Popular searches near 60126
Popular neighborhoods near 60126
- Austin, Chicago homes for sale
- Belmont Cragin, Chicago homes for sale
- Big Oaks, Chicago homes for sale
- Brook Forest, Oak Brook homes for sale
- Dunning, Chicago homes for sale
- Field Park, Western Springs homes for sale
- Galewood, Elmwood Park homes for sale
- Hinsbrook, Darien homes for sale
- King Arthur, Melrose Park homes for sale
- Montclare, Elmwood Park homes for sale
- Northwest Side, Chicago homes for sale
- Norwood Park, Chicago homes for sale
- Norwood Park West, Chicago homes for sale
- Oriole Park, Chicago homes for sale
- Portage Park, Chicago homes for sale
- Schorsch Forest View, Chicago homes for sale
- Springdale, Western Springs homes for sale
- Timber Trails, Western Springs homes for sale
- Winston Hills, Woodridge homes for sale
- Woodridge Center, Woodridge homes for sale
Counties near Elmhurst, 60126
- Berrien County homes for sale
- Boone County homes for sale
- Cook County homes for sale
- DeKalb County homes for sale
- DuPage County homes for sale
- Grundy County homes for sale
- Kane County homes for sale
- Kankakee County homes for sale
- Kendall County homes for sale
- Kenosha County homes for sale
- Lake County homes for sale
- Lake County homes for sale
- LaPorte County homes for sale
- LaSalle County homes for sale
- McHenry County homes for sale
- Newton County homes for sale
- Porter County homes for sale
- Racine County homes for sale
- Walworth County homes for sale
- Will County homes for sale
Protect your home and budget from life's surprises with an Assurant Home Warranty, backed by a partner that supports you through every step of homeownership. Explore Plans.
©2026 Century 21 Real Estate LLC. All rights reserved. CENTURY 21®, the CENTURY 21 Logo and C21® are service marks owned by Century 21 Real Estate LLC. Century 21 Real Estate LLC fully supports the principles of the Fair Housing Act and the Equal Opportunity Act. Each office is independently owned and operated. Listing information is deemed reliable but not guaranteed accurate.