- Cañon City properties for sale
- Coaldale properties for sale
- Cotopaxi properties for sale
- Cripple Creek properties for sale
- Florence properties for sale
- Guffey properties for sale
- Howard properties for sale
- Lake George properties for sale
- Lincoln Park properties for sale
- Midland properties for sale
- Park Center properties for sale
- Penrose properties for sale
- Penrose-Portland properties for sale
- Rockvale properties for sale
- Salida properties for sale
- Silver Cliff properties for sale
- Texas Creek properties for sale
- Victor properties for sale
- Westcliffe properties for sale
- Wetmore properties for sale
Fremont County, CO - homes for sale
300 of 431 results displayed
- New
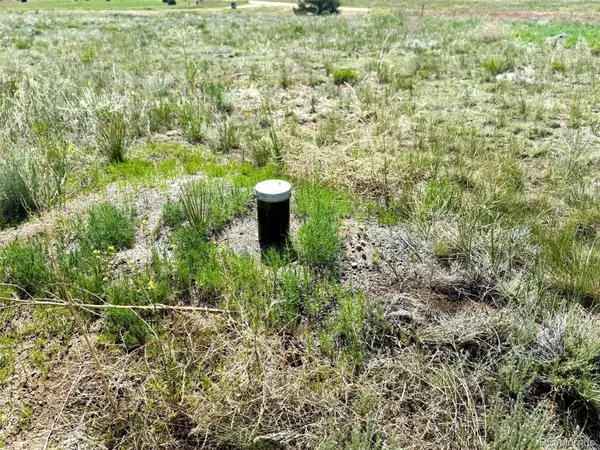 $85,000Active2.57 Acres
1888 19th Trail, Cotopaxi, CO 81223
MLS# 4818866Listed by: HOMESMART PREFERRED REALTY
- New
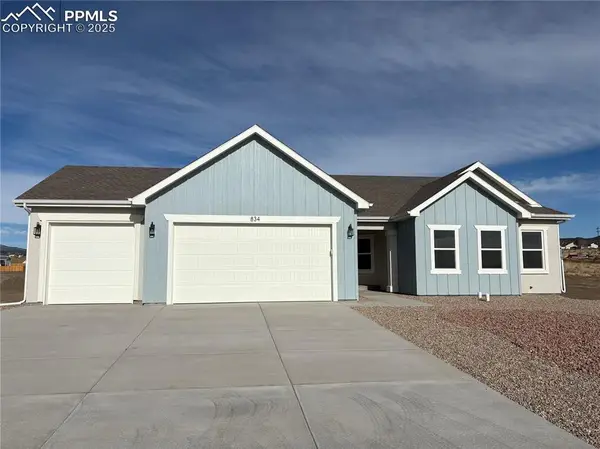 $415,990Active4 beds 2 baths1,583 sq. ft.
834 Keystone Loop, Canon City, CO 81212
MLS# 3244155Listed by: NEW HOME STAR LLC - New
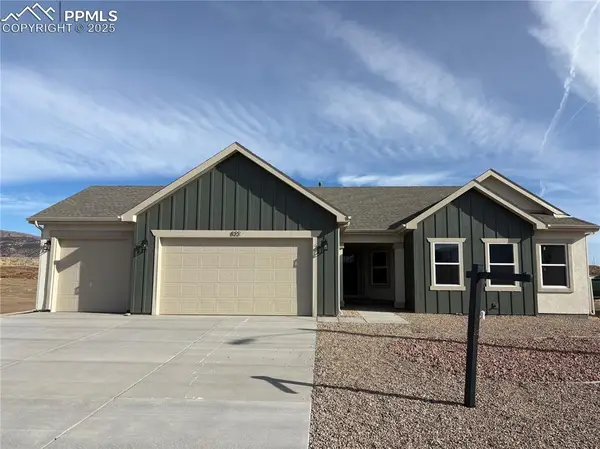 $415,990Active4 beds 2 baths1,583 sq. ft.
822 Keystone Loop, Canon City, CO 81212
MLS# 6372799Listed by: NEW HOME STAR LLC - New
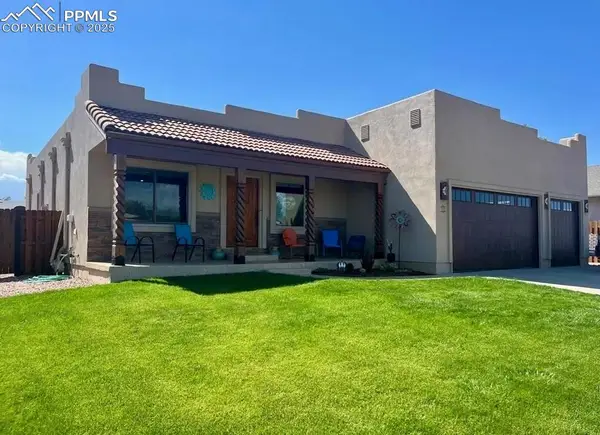
 $697,000Active6 beds 4 baths4,912 sq. ft.
29 Kyndra Ct, Canon City, CO 81212
MLS# 4303046Listed by: Real Broker, LLC DBA Real - New
 $599,000Active4 beds 3 baths3,136 sq. ft.
187 High Meadows Drive, Florence, CO 81226
MLS# 8024725Listed by: BETTER HOMES AND GARDENS REAL ESTATE KENNEY & COMPANY - New
 $497,500Active3 beds 2 baths1,984 sq. ft.
111 Rocchio Drive, Florence, CO 81226
MLS# 8943453Listed by: TRELORA REALTY - New
 $1,250,000Active3 beds 2 baths2,833 sq. ft.
716 Dakota Hideout, Canon City, CO 81212
MLS# 236102Listed by: REAL BROKER, LLC DBA REAL - New

 $500,000Active1 Acres
8255 Us Highway 50, Howard, CO 81233
MLS# 9964442Listed by: CENTURY 21 COMMUNITY FIRST - New
 $350,000Active3 beds 1 baths1,920 sq. ft.
490 A St, Penrose, CO 81240
MLS# 236085Listed by: RE/MAX OF PUEBLO INC - New
 $539,000Active4 beds 2 baths2,142 sq. ft.
Address Withheld By Seller, Canon City, CO 81212
MLS# 3780411Listed by: HomeSmart Preferred Realty - New
 $455,000Active3 beds 2 baths1,456 sq. ft.
99 N Eagle Dr, Canon City, CO 81212
MLS# 5319020Listed by: HomeSmart Preferred Realty - New
 $455,000Active3 beds 2 baths1,456 sq. ft.
99 N Eagle Drive, Canon City, CO 81212
MLS# 1375803Listed by: HOMESMART PREFERRED REALTY - New
 $455,000Active3 beds 2 baths1,456 sq. ft.
99 N Eagle Drive, Canon City, CO 81212
MLS# 5319020Listed by: HOMESMART PREFERRED REALTY - New
 $599,900Active4 beds 3 baths4,045 sq. ft.
7191 Copper Gulch Rd, Cotopaxi, CO 81223
MLS# 7607180Listed by: Real Broker, LLC DBA Real - New
 $599,900Active4 beds 3 baths4,045 sq. ft.
7191 Copper Gulch Road, Cotopaxi, CO 81223
MLS# 7607180Listed by: REAL BROKER, LLC DBA REAL - New
 $299,900Active4 beds 2 baths1,932 sq. ft.
375 14th Street, Penrose, CO 81240
MLS# 1361510Listed by: REAL BROKER, LLC DBA REAL - New
 $495,000Active4 beds 3 baths2,184 sq. ft.
747 D Street, Penrose, CO 81240
MLS# 3637307Listed by: FATHOM REALTY COLORADO LLC - New
 $435,000Active30.8 Acres
779 County Road 48, Howard, CO 81233
MLS# 9974213Listed by: Pinon Real Estate Group LLC - New
 $435,000Active30.8 Acres
779 County Road 48, Howard, CO 81233
MLS# 9974213Listed by: PINON REAL ESTATE GROUP LLC - New
 $399,900Active3 beds 2 baths1,600 sq. ft.
528 Brookeway, Florence, CO 81226
MLS# 4729240Listed by: KURT ZERBY REAL ESTATE GROUP, LLC  $65,000Active2 beds 1 baths720 sq. ft.
1625 Chestnut St. #18, Canon City, CO 81212
MLS# 235976Listed by: KELLER WILLIAMS PERFORMANCE REALTY $370,000Active3 beds 2 baths1,456 sq. ft.
203 N Frazier Ave, Florence, CO 81226
MLS# 7335613Listed by: Real Broker, LLC DBA Real- Open Fri, 2 to 4pm
 $370,000Active3 beds 2 baths1,456 sq. ft.
203 N Frazier Avenue, Florence, CO 81226
MLS# 7335613Listed by: REAL BROKER, LLC DBA REAL  $182,500Active3 beds 1 baths864 sq. ft.
114 Riverside Drive, Florence, CO 81212
MLS# 235944Listed by: PROPERTIES OF COLORADO CC $192,500Active1 beds 1 baths576 sq. ft.
911 Elm Avenue, Canon City, CO 81212
MLS# 3351810Listed by: HOMESMART PREFERRED REALTY $335,000Active4 beds 2 baths1,680 sq. ft.
626 Mystic Ave, Canon City, CO 81212
MLS# 5880878Listed by: HomeSmart Preferred Realty $485,000Active3 beds 2 baths1,713 sq. ft.
425 Miners Rd, Canon City, CO 81212
MLS# 3993889Listed by: HomeSmart Preferred Realty $149,999Active40 Acres
725 Van Egmond Dr, Penrose, CO 81240
MLS# 3888261Listed by: Whitetail Properties Real Estate Llc $554,000Active4 beds 2 baths1,983 sq. ft.
100 Pleasure Trl, Penrose, CO 81240
MLS# 3063867Listed by: HomeSmart $175,000Active20.42 Acres
Cedar Avenue, Canon City, CO 81212
MLS# 7487448Listed by: Legacy Real Estate Company LLC $175,000Active20.42 Acres
Tbd. Cedar Avenue, Canon City, CO 81212
MLS# 7487448Listed by: LEGACY REAL ESTATE COMPANY LLC $444,000Active4 beds 2 baths1,583 sq. ft.
817 Keystone Loop, Canon City, CO 81212
MLS# 3953097Listed by: NEW HOME STAR LLC $3,850,000Active2 beds 2 baths3,200 sq. ft.
1544 County Road 45, Salida, CO 81201
MLS# 7035908Listed by: CENTURY 21 COMMUNITY FIRST $77,777Active3 beds 2 baths1,216 sq. ft.
598 County Road 12, Cotopaxi, CO 81223
MLS# 4204184Listed by: CENTURY 21 COMMUNITY FIRST $315,000Active2 beds 1 baths1,140 sq. ft.
949 Coyote Circle, Coal Creek, CO 81221
MLS# 4944471Listed by: REAL BROKER, LLC DBA REAL $69,000Active2.42 Acres
1713 7th Trail, Cotopaxi, CO 81223
MLS# 4409763Listed by: SCHWABE REAL ESTATE INC. $300,000Pending4 beds 4 baths2,636 sq. ft.
1106 Main St, Canon City, CO 81212
MLS# 9937917Listed by: Frontier West Realty $425,490Active3 beds 2 baths2,356 sq. ft.
1376 B St, Penrose, CO 81240
MLS# 4925364Listed by: Atlas Real Estate Group $379,900Active3 beds 2 baths1,568 sq. ft.
1535 17th St, Penrose, CO 81240
MLS# 235629Listed by: HOMESMART PREFERRED REALTY $468,035Active3 beds 3 baths1,807 sq. ft.
3524 Telegraph Tr, Canon City, CO 81212
MLS# 235623Listed by: KELLER WILLIAMS PERFORMANCE REALTY $589,000Active4 beds 3 baths1,676 sq. ft.
371 Holiday Hills Drive, Howard, CO 81233
MLS# 5167645Listed by: PINON REAL ESTATE GROUP LLC $498,000Active3 beds 2 baths2,770 sq. ft.
34 Wild Rose Dr, Canon City, CO 81212
MLS# 233279Listed by: REAL BROKER, LLC DBA REAL $269,900Active3 beds 2 baths1,864 sq. ft.
1316 York Ave, Canon City, CO 81212
MLS# 235541Listed by: HOMESMART PREFERRED REALTY $189,900Active4 beds 2 baths1,568 sq. ft.
510 N 19th St #49, Canon City, CO 81212
MLS# 235520Listed by: KELLER WILLIAMS REALTY DOWNTOWN $189,900Active4 beds 2 baths1,568 sq. ft.
510 N 19th Street, Canon City, CO 81212
MLS# 4717035Listed by: KELLER WILLIAMS REALTY DOWNTOWN LLC $550,000Active3 beds 2 baths5,752 sq. ft.
2945 Paw Prints, Canon City, CO 81212
MLS# 4167034Listed by: HomeSmart Preferred Realty $525,000Active5 beds 3 baths3,212 sq. ft.
430 Frontier Place, Canon City, CO 81212
MLS# 1599826Listed by: BERKSHIRE HATHAWAY HOMESERVICES ROCKY MOUNTAIN $345,000Active3 beds 2 baths1,378 sq. ft.
47 Bob Richards Dr, Cotopaxi, CO 81223
MLS# 3945845Listed by: Real Broker, LLC DBA Real $160,000Active38.5 Acres
340 Huntley Pl, Cotopaxi, CO 81223
MLS# 7880270Listed by: Real Broker, LLC DBA Real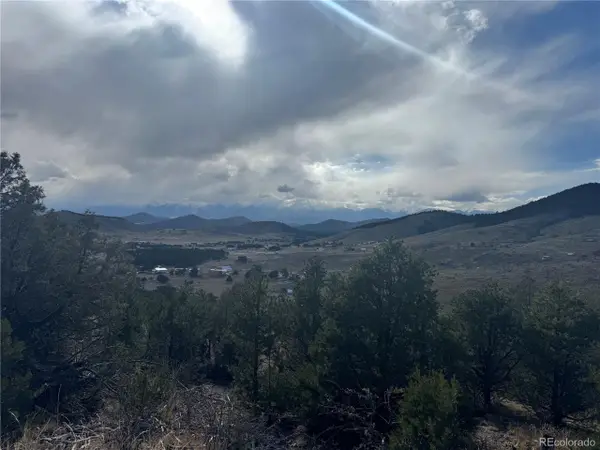 $21,000Active2.43 Acres
0 27th Trl, Cotopaxi, CO 81223
MLS# 8316554Listed by: Real Broker, LLC DBA Real $299,900Active3 beds 2 baths1,188 sq. ft.
171 Sunset Trl, Cotopaxi, CO 81223
MLS# 8613489Listed by: Real Broker, LLC DBA Real $150,000Active12.86 Acres
500 Cottonwood Dr, Cotopaxi, CO 81223
MLS# 235501Listed by: ROCKY MOUNTAIN REALTY $647,500Active6 beds 3 baths3,658 sq. ft.
438 Miners Road, Canon City, CO 81212
MLS# 5710136Listed by: BETTER HOMES AND GARDENS REAL ESTATE KENNEY & COMPANY $515,000Active3 beds 2 baths2,192 sq. ft.
442 Gold Canon Road, Canon City, CO 81212
MLS# 5472127Listed by: BETTER HOMES AND GARDENS REAL ESTATE KENNEY & COMPANY $1,150,000Active4.54 Acres
1548 County Road 45, Salida, CO 81201
MLS# 6092231Listed by: CENTURY 21 COMMUNITY FIRST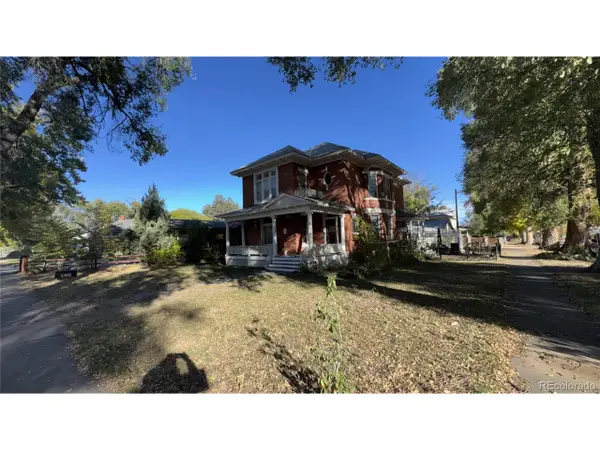 $270,000Active5 beds 2 baths3,069 sq. ft.
429 E 3rd St, Florence, CO 81226
MLS# 9421647Listed by: JPAR Modern Real Estate $487,000Active4 beds 3 baths3,622 sq. ft.
303 High Meadows Drive, Florence, CO 81226
MLS# 2758915Listed by: ENGEL & VLKERS ASPEN $205,000Active3 beds 1 baths1,344 sq. ft.
1539 Rosedale Ln, Canon City, CO 81212
MLS# 235465Listed by: ROCKY MOUNTAIN REALTY $125,000Active1 Acres
97 Loop Drive, Howard, CO 81233
MLS# 2774674Listed by: Pinon Real Estate Group LLC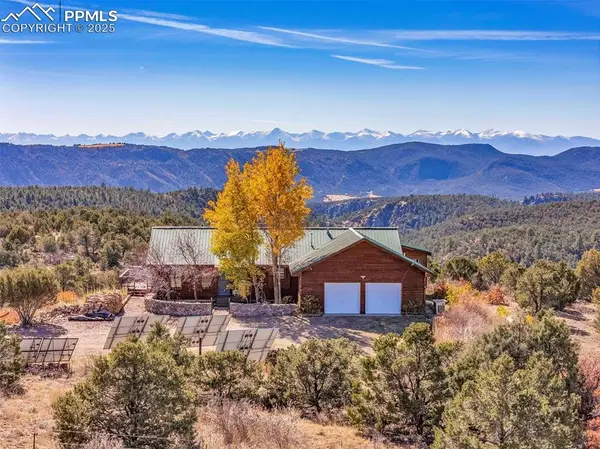 $550,000Active3 beds 2 baths1,670 sq. ft.
9421 County Road 69, Canon City, CO 81212
MLS# 5172084Listed by: REAL BROKER, LLC DBA REAL $350,000Active4 beds 2 baths2,196 sq. ft.
1110 Phay Ave, Canon City, CO 81212
MLS# 8624171Listed by: HomeSmart Preferred Realty $120,000Active5 Acres
J Street, Penrose, CO 81240
MLS# 2905531Listed by: ALL SEASONS LLC $550,000Active4 beds 2 baths1,949 sq. ft.
1037 12th Street, Penrose, CO 81240
MLS# 7661494Listed by: ALL SEASONS LLC $275,000Active4 beds 2 baths1,960 sq. ft.
290 Field Avenue, Canon City, CO 81212
MLS# 9937548Listed by: REAL BROKER, LLC DBA REAL $199,000Active80 Acres
1731 County Road 69, Canon City, CO 81212
MLS# 1022369Listed by: ROCKY MOUNTAIN RANCH & LAND LLC $450,000Active155 Acres
601 County Road 69, Canon City, CO 81212
MLS# 3285721Listed by: ROCKY MOUNTAIN RANCH & LAND LLC $55,000Active10 Acres
TBD 14th St, Penrose, CO 81240
MLS# 235341Listed by: ALL SEASONS LLC. $330,000Active3 beds 2 baths1,250 sq. ft.
212 High Meadows Court, Florence, CO 81226
MLS# 4890608Listed by: REAL BROKER, LLC DBA REAL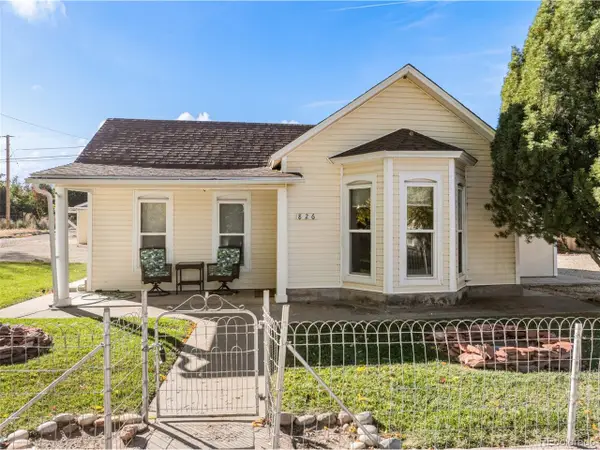 $399,000Active3 beds 2 baths1,472 sq. ft.
826 Griffin Ave, Canon City, CO 81212
MLS# 7635846Listed by: RE/MAX Associates $795,000Active105.38 Acres
159 Falling Rock Rd, Cotopaxi, CO 81223
MLS# 4036743Listed by: Mattie Burtt Realty Inc $699,000Active5 beds 5 baths3,558 sq. ft.
1160 Diamond Back Trail, Canon City, CO 81212
MLS# 7452787Listed by: THE WARNER GROUP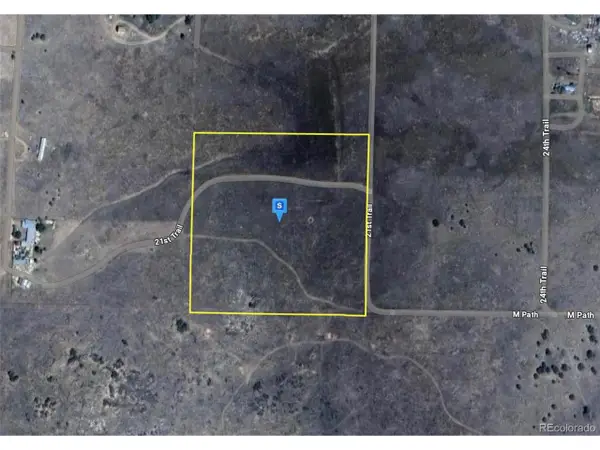 $52,999Active9.72 Acres
1263 23rd Trl, Cotopaxi, CO 81223
MLS# 9762288Listed by: PlatLabs LLC $210,000Active36.9 Acres
0 Rosebush Rd, Canon City, CO 81212
MLS# 9058744Listed by: Great Plains Land Company, LLC $210,000Active36.9 Acres
000 Rosebush Rd, Canon City, CO 81212
MLS# 235242Listed by: GREAT PLAINS LAND COMPANY, LLC $210,000Active36.9 Acres
Rosebush Road, Canon City, CO 81212
MLS# 9831071Listed by: GREAT PLAINS LAND COMPANY $399,900Active2 beds 2 baths1,924 sq. ft.
401 Dozier, Canon City, CO 81212
MLS# 3774107Listed by: HomeSmart Preferred Realty $492,835Pending3 beds 2 baths1,984 sq. ft.
111 Rocchio Drive, Florence, CO 81226
MLS# 4982812Listed by: TRELORA REALTY $31,999Active4.36 Acres
560 10th Trail, Cotopaxi, CO 81223
MLS# 1680586Listed by: PlatLabs LLC $55,000Active10 Acres
C St, Penrose, CO 81240
MLS# 4414934Listed by: HomeSmart Preferred Realty $659,999Active4 beds 3 baths3,024 sq. ft.
38 Mac Donnell Drive, Cotopaxi, CO 81223
MLS# 2852857Listed by: DIANE STOECKLE $190,000Active37.2 Acres
0 Cap Rock Road, Canon City, CO 81212
MLS# 9221627Listed by: LIV SOTHEBY'S INTERNATIONAL $58,000Active10 Acres
1374 C St, Penrose, CO 81240
MLS# 8480627Listed by: HomeSmart Preferred Realty $57,500Active10 Acres
380 13th St, Penrose, CO 81240
MLS# 4238931Listed by: HomeSmart Preferred Realty $375,000Active4 beds 2 baths1,705 sq. ft.
358 13th St, Penrose, CO 81240
MLS# 4319248Listed by: HomeSmart Preferred Realty $57,500Active10 Acres
380 13th Street, Penrose, CO 81240
MLS# 7124960Listed by: HOMESMART PREFERRED REALTY $65,000Active2 Acres
15 Needham Road, Florence, CO 81226
MLS# 8047150Listed by: ALL SEASONS LLC $254,500Active3 beds 1 baths1,400 sq. ft.
710 Woodlawn, Canon City, CO 81212
MLS# 2173859Listed by: HomeSmart Preferred Realty $47,000Active2 beds 2 baths924 sq. ft.
600 Raintree Blvd #98, Canon City, CO 81212
MLS# 2250790Listed by: HomeSmart Preferred Realty $269,900Active3 beds 2 baths1,864 sq. ft.
1316 York Ave, Canon City, CO 81212
MLS# 4352844Listed by: HomeSmart Preferred Realty $285,000Active2 beds 1 baths1,215 sq. ft.
826 Myrtle Ave, Canon City, CO 81212
MLS# 235151Listed by: HOMESMART PREFERRED REALTY $273,000Active-- beds -- baths880 sq. ft.
312 Fremont St, Penrose, CO 81240
MLS# 2399235Listed by: Real Broker, LLC DBA Real $510,000Active4 beds 2 baths2,140 sq. ft.
3542 Saddle Drive, Canon City, CO 81212
MLS# 5354312Listed by: COLDWELL BANKER REALTY $425,000Active3 beds 2 baths1,242 sq. ft.
12 9th Ave, Penrose, CO 81240
MLS# 235138Listed by: RE/MAX OF PUEBLO INC $500,000Active4 beds 3 baths1,960 sq. ft.
7878 County Road 28 Road, Cotopaxi, CO 81223
MLS# 2590056Listed by: MEGASTAR REALTY $215,000Active3 beds 1 baths1,196 sq. ft.
118 E New York Ave., Canon City, CO 81212
MLS# 235130Listed by: KELLER WILLIAMS PERFORMANCE REALTY $329,000Active3 beds 2 baths1,824 sq. ft.
1544 Birch St, Canon City, CO 81212
MLS# 8288486Listed by: Home Savings Realty $675,000Active3 beds 3 baths4,872 sq. ft.
1785 County Road 120, Penrose, CO 81240
MLS# 4401092Listed by: ALL SEASONS LLC $245,000Active2 beds 1 baths1,116 sq. ft.
1574 4th St, Penrose, CO 81240
MLS# 3379089Listed by: HomeSmart Preferred Realty $1,300,000Active2 beds 2 baths1,682 sq. ft.
159 Mineshaft Place, Cotopaxi, CO 81223
MLS# 4202160Listed by: DIANE STOECKLE $699,000Active3 beds 3 baths2,746 sq. ft.
190 Smith Ln, Howard, CO 81233
MLS# 4461208Listed by: Pinon Real Estate Group LLC $130,000Active1.67 Acres
1450 Locust Elm Ave, Canon City, CO 81212
MLS# 235091Listed by: KELLER WILLIAMS PERFORMANCE REALTY $342,500Active3 beds 2 baths1,739 sq. ft.
701 Harrison Ave, Canon City, CO 81212
MLS# 5918969Listed by: HomeSmart Preferred Realty $343,000Active4 beds 3 baths1,816 sq. ft.
467 Crestmoor Rd, Canon City, CO 81212
MLS# 235044Listed by: HOMESMART PREFERRED REALTY $150,000Active35.2 Acres
Corral Street, Cotopaxi, CO 81223
MLS# 5584754Listed by: BETTER HOMES AND GARDENS REAL ESTATE KENNEY & COMPANY $271,500Active2 beds 1 baths936 sq. ft.
1860 Central Avenue, Canon City, CO 81212
MLS# 235031Listed by: KURT ZERBY REAL ESTATE GROUP $271,500Active2 beds 1 baths936 sq. ft.
1860 Central Avenue, Canon City, CO 81212
MLS# 4881746Listed by: KURT ZERBY REAL ESTATE GROUP, LLC $299,000Active35 Acres
10719 County Road 69, Canon City, CO 81212
MLS# 2876984Listed by: Saddle Up Realty LLC $249,000Active3 beds 2 baths1,253 sq. ft.
1006 I Street, Penrose, CO 81240
MLS# 1387631Listed by: THE CUTTING EDGE $469,900Active1 beds 1 baths576 sq. ft.
1005 13th St, Penrose, CO 81240
MLS# 235007Listed by: RE/MAX ROYAL GORGE $29,900Active5.24 Acres
176 Arnold Dr, Cotopaxi, CO 81223
MLS# 2212514Listed by: EXIT Elevation Realty $669,000Active3 beds 2 baths3,132 sq. ft.
47 Top Rail Trail, Penrose, CO 81240
MLS# 9341561Listed by: BETTER HOMES AND GARDENS REAL ESTATE KENNEY & COMPANY $34,500Active5.01 Acres
Tbd 33rd, Cotopaxi, CO 81223
MLS# 8519005Listed by: Real Broker, LLC DBA Real $52,000Active5.47 Acres
69 Coyote Run Rd, Cotopaxi, CO 81223
MLS# 9900893Listed by: Real Broker, LLC DBA Real $12,000Active2.58 Acres
Vacant Land, Texas Creek, CO 81223
MLS# 4732431Listed by: Ed Prather Real Estate $435,000Active40 Acres
92 Bear Trax Dr, Canon City, CO 81212
MLS# 8275742Listed by: Real Broker, LLC DBA Real $310,000Active3 beds 2 baths1,274 sq. ft.
1002 E 2nd St, Florence, CO 81226
MLS# 8810295Listed by: eXp Realty - ROCC $59,900Active1.54 Acres
110 Hideaway Trail, Rockvale, CO 81244
MLS# 222762Listed by: ALL SEASONS LLC. $50,000Active0.09 Acres
000 Highway 115, Penrose, CO 81240
MLS# 233714Listed by: PROPERTIES OF COLORADO CC $375,000Active103.67 Acres
0 Highway 50, Penrose, CO 81240
MLS# 234037Listed by: BHHS ROCKY MOUNTAIN, REALTORS $115,000Active3.85 Acres
TBD Cr 119, Florence, CO 81226
MLS# 234418Listed by: KELLER WILLIAMS PERFORMANCE REALTY $399,000Pending2 beds 1 baths1,141 sq. ft.
13564 County Road 45, Coaldale, CO 81222
MLS# 2303673Listed by: HomeSmart Preferred Realty $18,500Active2.2 Acres
42nd Trl, Cotopaxi, CO 81223
MLS# 5289784Listed by: EXIT Elevation Realty $585,000Active2 beds 2 baths1,704 sq. ft.
10990 Us Highway 50, Howard, CO 81233
MLS# 2996526Listed by: CENTURY 21 COMMUNITY FIRST $445,000Active3 beds 2 baths1,404 sq. ft.
1410 Ranch Road, Canon City, CO 81212
MLS# 7341264Listed by: ROCKY MOUNTAIN RANCH & LAND LLC $119,000Active35 Acres
19S Old Crow Path, Canon City, CO 81212
MLS# 9666790Listed by: ROCKY MOUNTAIN RANCH & LAND LLC $450,000Active5 beds 3 baths2,790 sq. ft.
622 Cowboy Way, Canon City, CO 81212
MLS# 5621575Listed by: HomeSmart Preferred Realty $298,400Active3 beds 2 baths1,260 sq. ft.
634 E 2nd St, Florence, CO 81226
MLS# 234790Listed by: HOMESMART PREFERRED REALTY $30,000Active2.31 Acres
Lot 90 7th Trail, Cotopaxi, CO 81223
MLS# 233944Listed by: SCHWABE REAL ESTATE INC $30,000Active2.31 Acres
Lot 100 7th Trail, Cotopaxi, CO 81223
MLS# 233945Listed by: SCHWABE REAL ESTATE INC $60,000Active5.02 Acres
Lot 53 6th Trail, Cotopaxi, CO 81223
MLS# 233946Listed by: SCHWABE REAL ESTATE INC $129,999Active4.45 Acres
739 17th Trl, Cotopaxi, CO 81223
MLS# 3750374Listed by: eXp Realty, LLC $199,000Active36.29 Acres
771 Chris Ct, Canon City, CO 81212
MLS# 2300173Listed by: Properties of Colorado Real Estate Inc $1,375,000Active3 beds 3 baths2,915 sq. ft.
18530 Highway 115, Penrose, CO 81240
MLS# 8958188Listed by: HOMESMART $675,000Active7 beds 6 baths1,900 sq. ft.
10240 W Us Highway 50, Howard, CO 81233
MLS# 8209602Listed by: COLDWELL BANKER COLLEGIATE PEAKS REALTY $825,000Active4 beds 3 baths3,700 sq. ft.
860 Texas Creek Ln, Cotopaxi, CO 81223
MLS# 5343251Listed by: United Country Wapiti Ranch Realty and Auction LLC $417,000Active3 beds 2 baths1,885 sq. ft.
2840 Spartan Dr, Canon City, CO 81212
MLS# 2077846Listed by: RE/MAX Edge $185,000Active35.2 Acres
TBD L 27 Copper Mountain Road, Cotopaxi, CO 18223
MLS# 7515310Listed by: HOMESMART PREFERRED REALTY $55,000Active8 Acres
Address Withheld By Seller, Cotopaxi, CO 81223
MLS# 8816708Listed by: Kentwood Real Estate Cherry Creek $999,999Active5 beds 3 baths4,006 sq. ft.
1183 2nd Street, Penrose, CO 81240
MLS# 1549189Listed by: BETTER HOMES AND GARDENS REAL ESTATE KENNEY & COMPANY $415,000Active4 beds 3 baths1,595 sq. ft.
618 Cowboy Way, Canon City, CO 81212
MLS# 8586945Listed by: VELOCITY REAL ESTATE & INVESTMENTS $875,000Pending4 beds 3 baths4,242 sq. ft.
12426 Us Highway 50, Howard, CO 81233
MLS# 6891292Listed by: CENTURY 21 COMMUNITY FIRST $338,999Active3 beds 2 baths1,524 sq. ft.
807 Harding Ave, Canon City, CO 81212
MLS# 4011374Listed by: Flynn Realty $990,000Active5 beds 3 baths3,870 sq. ft.
1675 M St, Penrose, CO 81240
MLS# 234647Listed by: RE/MAX ASSOCIATES $990,000Active4 beds 3 baths2,506 sq. ft.
11648 County Road 45, Coaldale, CO 81222
MLS# 6198611Listed by: Pinon Real Estate Group LLC $775,000Active3 beds 2 baths1,890 sq. ft.
234 Bremer Rd, Howard, CO 81233
MLS# 8879294Listed by: HomeSmart Preferred Realty $775,000Active3 beds 2 baths1,890 sq. ft.
234 Bremer Road, Howard, CO 81233
MLS# 8879294Listed by: HOMESMART PREFERRED REALTY $239,000Pending2 beds 1 baths1,170 sq. ft.
510 W 2nd Street, Florence, CO 81226
MLS# 1100577Listed by: BERKSHIRE HATHAWAY HOMESERVICES ROCKY MOUNTAIN $1,050,000Active4 beds 5 baths4,620 sq. ft.
692 Sunrise Ridge, Cotopaxi, CO 81223
MLS# 3722648Listed by: HomeSmart Preferred Realty $271,500Active2 beds 1 baths936 sq. ft.
1860 Central Ave, Canon City, CO 81212
MLS# 9988276Listed by: Kurt Zerby Real Estate Group $14,742Active4.58 Acres
1 G Path, Cotopaxi, CO 81223
MLS# 6445040Listed by: Real Broker, LLC DBA Real $375,000Active3 beds 1 baths1,352 sq. ft.
525 D Street, Penrose, CO 81240
MLS# 6407715Listed by: YOU 1ST REALTY $1,299,500Active5 beds 4 baths6,041 sq. ft.
271 County Road 33, Cotopaxi, CO 81223
MLS# 7037980Listed by: Real Broker, LLC $15,000Active10.23 Acres
30th And H Path, Cotopaxi, CO 81223
MLS# 9884455Listed by: Real Broker, LLC DBA Real $205,000Active0 Acres
958 L St, Penrose, CO 81240
MLS# 234540Listed by: KELLER WILLIAMS PERFORMANCE REALTY $250,000Active35 Acres
0 Peak View Ridge, Canon City, CO 81212
MLS# 7208135Listed by: Western Mountain Real Estate $745,000Active4 beds 4 baths4,405 sq. ft.
1893 County Rd 127, Penrose, CO 81240
MLS# 234525Listed by: HOMESMART PREFERRED REALTY $94,500Active3 beds 2 baths1,280 sq. ft.
860 Zona St #32, Canon City, CO 81212
MLS# 234511Listed by: KELLER WILLIAMS PERFORMANCE REALTY $698,900Active3 beds 2 baths1,800 sq. ft.
880 Burno Mountain Rd, Cotopaxi, CO 81223
MLS# 7739826Listed by: Equitable Commerce & Land Co $125,000Active35.8 Acres
0 Gold Pan Trl, Cotopaxi, CO 81223
MLS# 3607095Listed by: Mossy Oak Properties Colorado Mountain Realty $2,100,000Active5 beds 5 baths5,088 sq. ft.
1751 County Rd 3, Canon City, CO 81212
MLS# 234475Listed by: EXIT ELEVATION REALTY $579,000Active2 beds 2 baths1,438 sq. ft.
10300 Us Highway 50, Howard, CO 81233
MLS# 6847988Listed by: Pinon Real Estate Group LLC $158,000Active3 beds 2 baths1,350 sq. ft.
2401 Central Ave #19, Canon City, CO 81212
MLS# 8023841Listed by: Sweet Homes Realty $347,500Pending3 beds 2 baths1,270 sq. ft.
1101 Rudd Ave, Canon City, CO 81212
MLS# 8887414Listed by: Real Broker, LLC DBA Real $325,000Active3 beds 1 baths1,014 sq. ft.
1160 Illinois Ave, Canon City, CO 81212
MLS# 5421421Listed by: Cruz Colorado Homes LLC $380,000Active4 beds 2 baths2,126 sq. ft.
303 W 7th St, Florence, CO 81226
MLS# 8048183Listed by: HomeSmart Preferred Realty $380,000Active4 beds 2 baths1,705 sq. ft.
303 W 7th St #2, Florence, CO 81226
MLS# 234343Listed by: HOMESMART PREFERRED REALTY $198,900Pending3 beds 2 baths1,943 sq. ft.
607 College Ave, Canon City, CO 81212
MLS# 7968584Listed by: Flynn Realty $99,000Active1.28 Acres
TBD S Robinson Ave, Florence, CO 81226
MLS# 234263Listed by: ALL SEASONS LLC. $250,000Active2 beds 1 baths1,114 sq. ft.
609 Rudd Avenue, Canon City, CO 81212
MLS# 7125908Listed by: EXP REALTY LLC $770,000Active4 beds 3 baths4,633 sq. ft.
Address Withheld By Seller, Penrose, CO 81240
MLS# 6288250Listed by: HomeSmart Preferred Realty $175,000Active2 beds 2 baths1,608 sq. ft.
1016 W 2nd Street, Florence, CO 81226
MLS# 8466777Listed by: EXP REALTY LLC $499,999Pending3 beds 2 baths1,906 sq. ft.
709 Pisgah Street, Canon City, CO 81212
MLS# 8910239Listed by: THE CUTTING EDGE $59,000Pending2.38 Acres
876 Q Path, Cotopaxi, CO 81223
MLS# 9254392Listed by: eXp Realty, LLC $595,900Active3 beds 2 baths1,750 sq. ft.
279 Horseshoe Dr, Canon City, CO 81212
MLS# 3727367Listed by: HomeSmart Preferred Realty $374,999Active3 beds 2 baths1,740 sq. ft.
560 Oak Creek Avenue, Rockvale, CO 81244
MLS# 4652531Listed by: ALL SEASONS LLC $299,000Active43.34 Acres
188 Looters Ln, Westcliffe, CO 81252
MLS# 2789689Listed by: Colorado Premier Resort Properties $22,000Pending2.5 Acres
1876 F Path, Texas Creek, CO 81223
MLS# 1131825Listed by: THE CUTTING EDGE $240,000Active35.06 Acres
87A Flat Top Drive, Canon City, CO 81212
MLS# 3290498Listed by: HOMESMART $240,000Active35.06 Acres
Flat Top Drive, Canon City, CO 81212
MLS# 4925859Listed by: HomeSmart $435,000Active2 beds 1 baths784 sq. ft.
163 Holiday Hills Boulevard, Howard, CO 81233
MLS# 5787804Listed by: CENTURY 21 COMMUNITY FIRST $650,000Active3 beds 2 baths1,660 sq. ft.
426 Leprechaun Ln, Howard, CO 81233
MLS# 1568521Listed by: HomeSmart Preferred Realty $444,900Pending3 beds 3 baths2,055 sq. ft.
805 Keystone Loop, Canon City, CO 81212
MLS# 5941118Listed by: NEW HOME STAR LLC $27,900Active2.39 Acres
21st Trail, Cotopaxi, CO 81223
MLS# 1871091Listed by: eXp Realty, LLC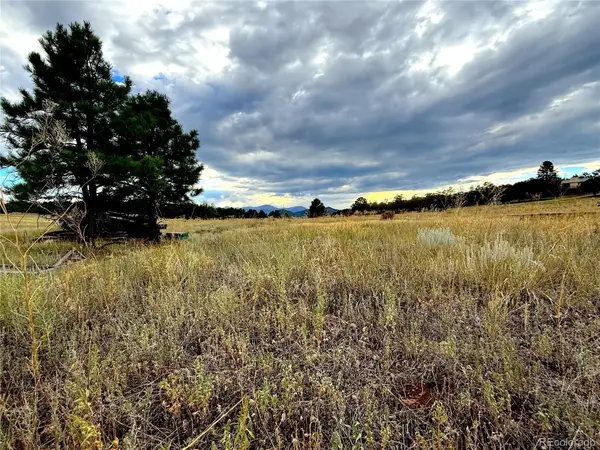 $27,250Active2.52 Acres
Tbd #2, 23rd Trail, Cotopaxi, CO 81223
MLS# 5749188Listed by: CENTURY 21 COMMUNITY FIRST $329,000Active3 beds 2 baths1,697 sq. ft.
1038 Ohio Ave, Canon City, CO 81212
MLS# 8467298Listed by: HomeSmart Preferred Realty $279,900Active2 beds 1 baths1,006 sq. ft.
477 N Raynolds Ave, Canon City, CO 81212
MLS# 4404901Listed by: Real Broker, LLC DBA Real $600,000Active2 beds 2 baths1,232 sq. ft.
586 Cuesta Dr, Cotopaxi, CO 81223
MLS# 8402727Listed by: Your Castle Real Estate Inc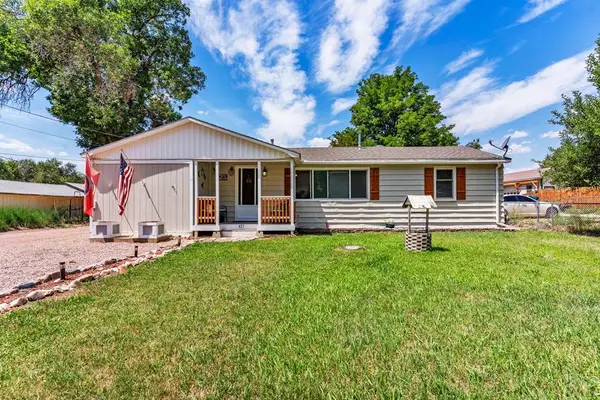 $279,900Active2 beds 1 baths1,006 sq. ft.
477 N Raynolds Ave, Canon City, CO 81212
MLS# 234062Listed by: REAL BROKER, LLC DBA REAL $275,000Pending3 beds 2 baths1,810 sq. ft.
705 Allison Avenue, Canon City, CO 81212
MLS# 5574345Listed by: HOMESMART PREFERRED REALTY $600,000Active80 Acres
586 Cuesta Dr, Cotopaxi, CO 81223
MLS# 5063094Listed by: Your Castle Real Estate Inc $256,000Active2 beds 1 baths920 sq. ft.
1023 S 3rd Street, Canon City, CO 81212
MLS# 7346679Listed by: REAL BROKER, LLC DBA REAL $335,000Active4 beds 2 baths1,792 sq. ft.
732 Rudd Ave, Canon City, CO 81212
MLS# 4882186Listed by: Berkshire Hathaway Home Services Rocky Mtn Realtors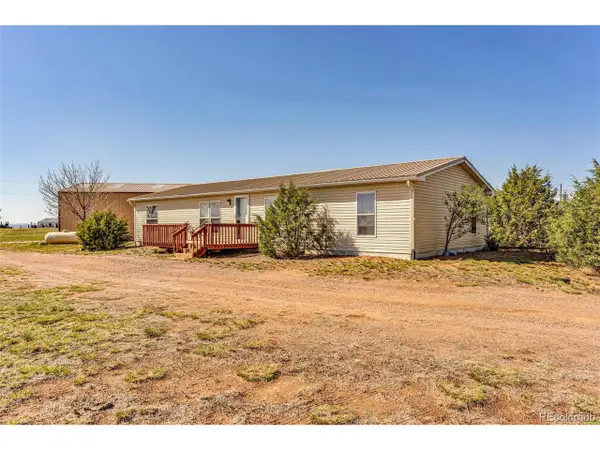 $370,000Pending3 beds 2 baths1,456 sq. ft.
5101 County Road 123, Penrose, CO 81240
MLS# 6291056Listed by: Sweet Homes Realty $265,000Active2 beds 1 baths920 sq. ft.
1023 S 3rd St, Canon City, CO 81212
MLS# 233964Listed by: REAL BROKER, LLC DBA REAL $949,314Active3 beds 4 baths3,600 sq. ft.
580 N Pine Vista, Canon City, CO 81212
MLS# 1837823Listed by: Dream Real Estate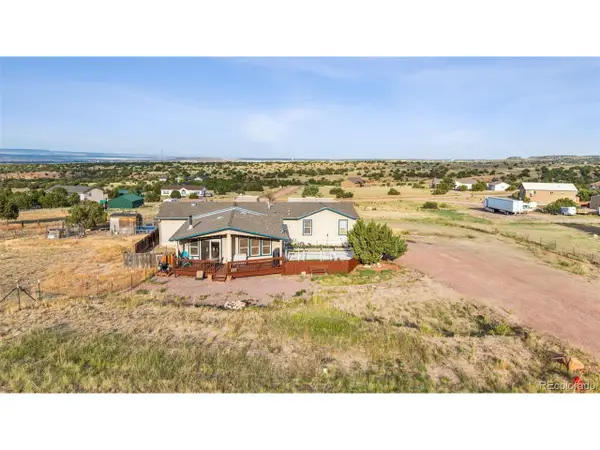 $420,000Active4 beds 2 baths2,002 sq. ft.
160 Shannon, Rockvale, CO 81244
MLS# 4607899Listed by: Sellstate Alliance Realty $564,900Active5 beds 3 baths3,780 sq. ft.
5 Cory Lane, Williamsburg, CO 81226
MLS# 233929Listed by: RE/MAX OF PUEBLO INC $212,500Active4 beds 2 baths1,568 sq. ft.
36 Orlando Lane, Cotopaxi, CO 81223
MLS# 233925Listed by: KELLER WILLIAMS REALTY DOWNTOWN $109,900Active3 beds 1 baths1,280 sq. ft.
813 Robbie Lane, Canon City, CO 81212
MLS# 233910Listed by: KELLER WILLIAMS REALTY DOWNTOWN $127,000Pending35 Acres
10305 County Road 69, Canon City, CO 81212
MLS# 8747736Listed by: RE/MAX ALLIANCE $250,000Active20 Acres
0 11th St, Penrose, CO 81212
MLS# 7059918Listed by: HomeSmart Preferred Realty $250,000Active20 Acres
TBD 11th St, Penrose, CO 81212
MLS# 233891Listed by: HOMESMART PREFERRED REALTY $14,500Pending5.19 Acres
121 19th Trl, Cotopaxi, CO 81223
MLS# 4662479Listed by: Real Broker, LLC DBA Real $80,000Active1 Acres
87 Eagle Crest Loop, Canon City, CO 81212
MLS# 4910354Listed by: HomeSmart Preferred Realty $3,725,000Active4 beds 3 baths6,922 sq. ft.
157 Cap Rock Rd, Canon City, CO 81212
MLS# 6391168Listed by: Great Western Ranch and Land, LLC $699,500Active5 beds 2 baths3,383 sq. ft.
417 Greenwood Ave, Canon City, CO 81212
MLS# 5309819Listed by: Kurt Zerby Real Estate Group $667,400Active5 beds 3 baths3,600 sq. ft.
200 Wolf Cub Trail, Canon City, CO 81212
MLS# 7329174Listed by: BERKSHIRE HATHAWAY HOMESERVICES ROCKY MOUNTAIN $4,150,000Active3 beds 4 baths3,904 sq. ft.
560 Cap Rock Dr, Canon City, CO 81212
MLS# 4747761Listed by: Western Mountain Real Estate $342,500Active3 beds 2 baths1,802 sq. ft.
10719 Highway 115, Florence, CO 81226
MLS# 6278576Listed by: BERKSHIRE HATHAWAY HOMESERVICES ROCKY MOUNTAIN $127,000Active35.2 Acres
35 Autumn Creek Dr, Canon City, CO 81212
MLS# 8965021Listed by: eXp Realty, LLC $375,000Active3 beds 2 baths1,709 sq. ft.
1304 Flora Dr, Canon City, CO 81212
MLS# 1704070Listed by: Real Broker, LLC DBA Real $160,000Active3 beds 1 baths1,032 sq. ft.
785 Harrow Court, Canon City, CO 81212
MLS# 9263821Listed by: SPRINGS LIFESTYLES REAL ESTATE INC. $15,500Active2.58 Acres
32nd Trl, Cotopaxi, CO 81223
MLS# 4465156Listed by: EXIT Elevation Realty $1,200,000Active26.76 Acres
00 Shoop Dr, Florence, CO 81212
MLS# 233712Listed by: PROPERTIES OF COLORADO CC $1,000,000Active0.19 Acres
205 Royal Gorge Blvd, Canon City, CO 81212
MLS# 233717Listed by: PROPERTIES OF COLORADO CC $53,000Active5.1 Acres
839 Shannon Trail, Cotopaxi, CO 81213
MLS# 233678Listed by: PROPERTIES OF COLORADO CC $595,000Active2 beds 2 baths1,950 sq. ft.
477 W View Rd, Cotopaxi, CO 81223
MLS# 2963411Listed by: Real Broker, LLC DBA Real $450,000Active3 beds 2 baths1,560 sq. ft.
763 15th Trl, Cotopaxi, CO 81223
MLS# 1831838Listed by: LPT Realty $200,000Active35.57 Acres
781 Ridgeway Rd, Cotopaxi, CO 81223
MLS# 4048398Listed by: Full Circle Real Estate Group $500,000Active3 beds 2 baths1,846 sq. ft.
156 Osprey Ct, Canon City, CO 81212
MLS# 6821057Listed by: Sellstate Alliance Realty $229,999Active4 beds 2 baths1,800 sq. ft.
20 Wilmont Circle, Florence, CO 81226
MLS# 1683853Listed by: HOMESMART PREFERRED REALTY $140,000Active5.66 Acres
County Road 119, Florence, CO 81226
MLS# 9957974Listed by: ALL SEASONS LLC $69,000Active3.17 Acres
County Road 119, Florence, CO 81226
MLS# 5311801Listed by: ALL SEASONS LLC $41,999Active0.65 Acres
105 Bobwhite Loop, Canon City, CO 81212
MLS# 233569Listed by: HOMESMART PREFERRED REALTY $365,000Pending3 beds 2 baths1,568 sq. ft.
1337 York Ave, Canon City, CO 81212
MLS# 1668603Listed by: HomeSmart Preferred Realty $4,000,000Active4 beds 3 baths4,806 sq. ft.
2490 County Road 1a, Cotopaxi, CO 81223
MLS# 5521445Listed by: Mossy Oak Properties / Mountain Ranch and Home Brokers $350,000Active2 beds 1 baths904 sq. ft.
531 County Road 119, Florence, CO 81226
MLS# 4713492Listed by: ALL SEASONS LLC $336,900Active3 beds 2 baths1,883 sq. ft.
315 N Pikes Peak Avenue, Florence, CO 81226
MLS# 3789352Listed by: BERKSHIRE HATHAWAY HOMESERVICES ROCKY MOUNTAIN $725,000Active1 beds 1 baths1,180 sq. ft.
18461 Highway 115, Penrose, CO 81240
MLS# 7236642Listed by: TRELORA REALTY $41,500Active2.63 Acres
182 Kelsey Kourt, Cotopaxi, CO 81223
MLS# 1528738Listed by: KELLER WILLIAMS CLIENTS CHOICE REALTY $22,500Active2.39 Acres
43rd Trl, Cotopaxi, CO 81223
MLS# 6835047Listed by: EXIT Elevation Realty $745,000Active5.2 Acres
14527 Us Highway 50, Coaldale, CO 81222
MLS# 5318036Listed by: HomeSmart Preferred Realty $499,500Active3 beds 2 baths1,696 sq. ft.
415 Empire Rd, Canon City, CO 81212
MLS# 7849536Listed by: Brokers Guild Real Estate $299,900Active2 beds 1 baths841 sq. ft.
92 Carpenter Trl, Cotopaxi, CO 81223
MLS# 7317930Listed by: Real Broker, LLC DBA Real $246,000Active2 beds 2 baths1,150 sq. ft.
965 Kelly Ave, Rockvale, CO 81244
MLS# 233474Listed by: HOMESMART PREFERRED REALTY $875,000Pending2 beds 2 baths3,769 sq. ft.
896 Cap Rock Drive, Canon City, CO 81212
MLS# 8812835Listed by: ROCKY MOUNTAIN RANCH & LAND LLC $145,000Active35.67 Acres
8 Newlin Ridge Rd, Florence, CO 81226
MLS# 7821339Listed by: Four Mile Realty $145,000Active35.67 Acres
TBD Lot 8 Newlin Ridge Road, Florence, CO 81226
MLS# 7821339Listed by: FOUR MILE REALTY $749,000Active2 beds 2 baths1,458 sq. ft.
7845 Us Highway 50, Howard, CO 81233
MLS# 7767962Listed by: RE/MAX Properties Of The Summit $484,900Pending3 beds 2 baths1,814 sq. ft.
3010 Grandview Ave, Canon City, CO 81212
MLS# 7475252Listed by: HomeSmart Preferred Realty $197,900Pending2 beds 1 baths1,070 sq. ft.
921 Florida Street, Canon City, CO 81212
MLS# 9549973Listed by: ABODE REAL ESTATE $289,900Active3 beds 1 baths1,660 sq. ft.
1016 Macon Avenue, Canon City, CO 81212
MLS# 1547736Listed by: ABODE REAL ESTATE $53,350Active0.23 Acres
3535 Telegraph Trl, Canon City, CO 81212
MLS# 4361201Listed by: Four Mile Realty $385,000Active3 beds 2 baths1,630 sq. ft.
12 Grant Ave, Penrose, CO 81240
MLS# 233332Listed by: KELLER WILLIAMS PERFORMANCE REALTY $469,000Active5 beds 3 baths2,584 sq. ft.
369 Sunlight Way, Canon City, CO 81212
MLS# 3179152Listed by: Keller Williams Partners Realty $479,000Active3 beds 3 baths3,170 sq. ft.
136 High Meadows Drive, Florence, CO 81226
MLS# 4879687Listed by: ALL SEASONS LLC $539,989Active3 beds 2 baths1,704 sq. ft.
3559 Saddle Dr, Canon City, CO 81212
MLS# 4277980Listed by: Four Mile Realty $55,000Active2.17 Acres
216 West View Road, Cotopaxi, CO 81223
MLS# 5455524Listed by: COLDWELL BANKER REALTY BK $490,000Active2 beds 2 baths1,344 sq. ft.
21691 County Road 67, Penrose, CO 81240
MLS# 7797988Listed by: eXp Realty, LLC $898,000Active2 beds 2 baths4,146 sq. ft.
161 Shannon Rd, Cotopaxi, CO 81223
MLS# 9642815Listed by: HomeSmart Preferred Realty $280,000Active4 beds 1 baths1,593 sq. ft.
1615 Locust St, Canon City, CO 81212
MLS# 4561845Listed by: Four Mile Realty $150,000Active0.43 Acres
319 St Lawrence Avenue, Canon City, CO 81212
MLS# 4037323Listed by: KELLER WILLIAMS CLIENTS CHOICE REALTY $343,000Active3 beds 2 baths1,258 sq. ft.
723 Griffin Ave, Canon City, CO 81212
MLS# 2230919Listed by: HomeSmart Preferred Realty $525,000Active3 beds 2 baths896 sq. ft.
24938 Us Highway 50, Cotopaxi, CO 81223
MLS# 9082880Listed by: Full Circle Real Estate Group $54,500Active1.66 Acres
1880 Copper Gulch Road, Cotopaxi, CO 81223
MLS# 8284776Listed by: CENTURY 21 COMMUNITY FIRST $389,900Pending3 beds 2 baths1,612 sq. ft.
862 N Raynolds Avenue, Canon City, CO 81212
MLS# 1337983Listed by: NEW HOME STAR LLC $349,900Active2 beds 1 baths1,208 sq. ft.
640 Ridgeway Drive, Cotopaxi, CO 81223
MLS# 8547821Listed by: CENTURY 21 COMMUNITY FIRST $425,000Active-- beds -- baths
305 W 2nd Street, Florence, CO 81226
MLS# 8252738Listed by: BERKSHIRE HATHAWAY HOMESERVICES ROCKY MOUNTAIN $1,500,000Active4 beds 3 baths5,444 sq. ft.
573 Beasley Blvd, Cotopaxi, CO 81223
MLS# 4814162Listed by: Summit & Main Realty Group $334,900Active3 beds 2 baths1,188 sq. ft.
762 Main St, Coal Creek, CO 81221
MLS# 233063Listed by: CORNERSTONE REAL ESTATE TEAM $499,000Active4 beds 2 baths3,871 sq. ft.
207 Savage Loop, Canon City, CO 81212
MLS# 3162285Listed by: Real Broker, LLC DBA Real $21,000Active2.55 Acres
30th & I Path, Cotopaxi, CO 81223
MLS# 3732253Listed by: CENTURY 21 COMMUNITY FIRST $139,900Pending35.2 Acres
17 White Wing Way, Cotopaxi, CO 81223
MLS# 8765130Listed by: EXIT Elevation Realty $390,000Active4 beds 3 baths2,383 sq. ft.
207 Fremont St, Penrose, CO 81240
MLS# 2633198Listed by: HomeSmart Preferred Realty $2,600,000Active-- beds -- baths7,061 sq. ft.
Address Withheld By Seller, Canon City, CO 81212
MLS# 2439922Listed by: EXIT Elevation Realty $299,900Active3 beds 2 baths1,621 sq. ft.
414 Griffin Avenue, Canon City, CO 81212
MLS# 2916199Listed by: BERKSHIRE HATHAWAY HOMESERVICES ROCKY MOUNTAIN $319,000Pending3 beds 3 baths1,782 sq. ft.
3063 Autumn Creek Dr, Canon City, CO 81212
MLS# 9173585Listed by: eXp Realty, LLC $324,900Pending3 beds 2 baths1,617 sq. ft.
2925 M Path, Cotopaxi, CO 81223
MLS# 6308343Listed by: MAX BROWN REALTY $999,000Active3 beds 4 baths2,900 sq. ft.
895 Acorn Rd, Cotopaxi, CO 81223
MLS# 6547907Listed by: eXp Realty, LLC $56,000Active6.29 Acres
134 Knight Ln, Cotopaxi, CO 81223
MLS# 6009538Listed by: EXIT Elevation Realty $99,000Active0.76 Acres
Tbd South St, Canon City, CO 81212
MLS# 7465526Listed by: Real Broker, LLC DBA Real $4,495,000Active6 beds 5 baths6,721 sq. ft.
1768 Running Bear, Cotopaxi, CO 81223
MLS# 6962255Listed by: Legacy Properties of Colorado $360,000Active3 beds 1 baths868 sq. ft.
25500 Us Highway 50, Cotopaxi, CO 81223
MLS# 6851293Listed by: LPT Realty $1,375,000Active2 beds 3 baths2,220 sq. ft.
1310 Sunrise Rdg, Cotopaxi, CO 81223
MLS# 7140039Listed by: Whitetail Properties Real Estate Llc $600,000Pending2 beds 1 baths1,200 sq. ft.
3377 Buckhorn Lane, Canon City, CO 81212
MLS# 2608507Listed by: CORCORAN PERRY & CO. $258,500Active10.39 Acres
53 Trail Dr, Cotopaxi, CO 81223
MLS# 4251090Listed by: Full Circle Real Estate Group $390,000Pending3 beds 2 baths1,744 sq. ft.
1367 18th Street, Penrose, CO 81240
MLS# 5776455Listed by: RE/MAX ADVANTAGE REALTY, INC. $199,000Active3 beds 2 baths1,216 sq. ft.
205 Illinois St, Penrose, CO 81240
MLS# 5562162Listed by: Properties of Colorado Real Estate Inc $499,000Pending3 beds 2 baths1,529 sq. ft.
236 Boreen Way, Howard, CO 81233
MLS# 5181693Listed by: Legacy Properties of Colorado $100,000Active2.78 Acres
83 Top Rail Trail, Penrose, CO 81240
MLS# 8440288Listed by: ALL SEASONS LLC $500,000Active3 beds 3 baths1,960 sq. ft.
7878 Copper Gulch Rd, Cotopaxi, CO 81223
MLS# 3653947Listed by: Megastar Realty $35,424Active6.5 Acres
8099 County Rd 28, Cotopaxi, CO 81223
MLS# 232596Listed by: ROCKY MOUNTAIN REALTY $57,000Active5.01 Acres
464 Burroback Ct, Cotopaxi, CO 81223
MLS# 5328775Listed by: Real Broker, LLC DBA Real $200,000Active36.22 Acres
County Road 5, Lot 1, Canon City, CO 81212
MLS# 8962946Listed by: XLV Realty $139,999Active35.6 Acres
TR3 Mineshaft Place, Cotopaxi, CO 81223
MLS# 8082524Listed by: DIANE STOECKLE $260,000Pending2 beds 1 baths1,127 sq. ft.
819 Clover Avenue, Canon City, CO 81212
MLS# 6902433Listed by: EXP REALTY LLC $1,500,000Pending5 beds 3 baths4,446 sq. ft.
Address Withheld By Seller, Canon City, CO 81212
MLS# 7697108Listed by: HomeSmart Preferred Realty $710,000Active2 beds 2 baths1,528 sq. ft.
2555 New Mill Gulch Rd, Canon City, CO 81212
MLS# 2835528Listed by: Frontier West Realty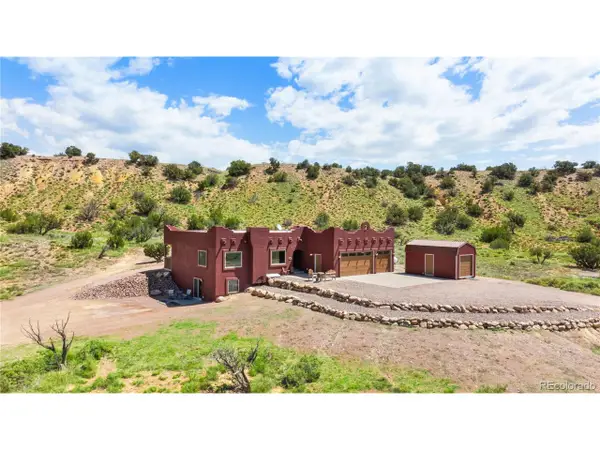 $969,900Active5 beds 4 baths4,918 sq. ft.
507 Van Egmond Dr, Penrose, CO 81240
MLS# 8612179Listed by: Whitetail Properties Real Estate Llc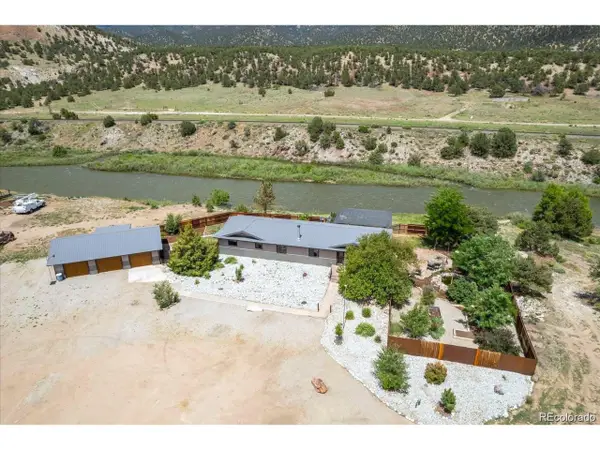 $1,499,000Active3 beds 2 baths1,924 sq. ft.
11679 Us Highway 50, Howard, CO 81233
MLS# 2905997Listed by: Mossy Oak Properties / Mountain Ranch and Home Brokers $184,999Pending5.1 Acres
401 Sleepy Hollow Trail, Cotopaxi, CO 81223
MLS# 4920130Listed by: DIANE STOECKLE $39,999Active5.24 Acres
567 Trails End Court, Cotopaxi, CO 81223
MLS# 8316220Listed by: DIANE STOECKLE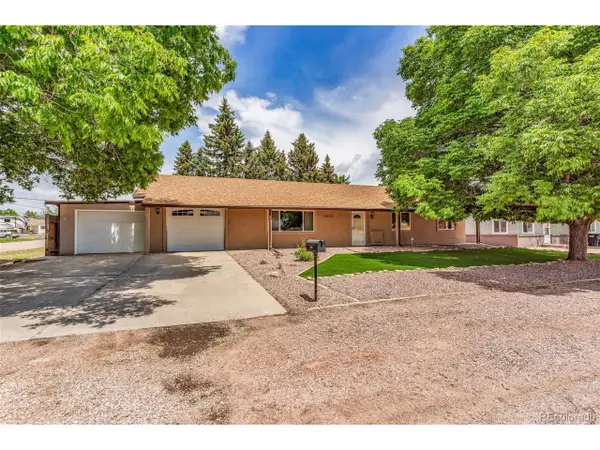 $394,975Active3 beds 2 baths1,588 sq. ft.
2401 Clayton Dr, Canon City, CO 81212
MLS# 9568056Listed by: EXIT Elevation Realty $260,000Pending3 beds 2 baths1,568 sq. ft.
10 Ridgeway Drive, Williamsburg, CO 81226
MLS# 3193060Listed by: THE CUTTING EDGE $200,000Pending3 beds 2 baths1,341 sq. ft.
608 Harding Avenue, Canon City, CO 81212
MLS# 9064779Listed by: KELLER WILLIAMS CLIENTS CHOICE REALTY $392,000Pending2 beds 2 baths1,860 sq. ft.
388 14th Trl, Cotopaxi, CO 81223
MLS# 6480538Listed by: Summit & Main Realty Group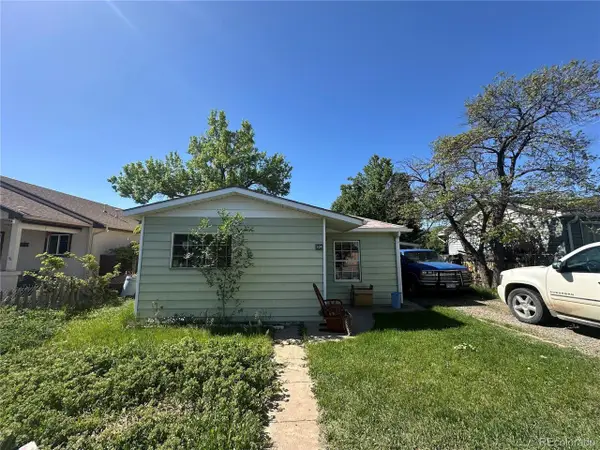 $199,000Active1 beds 1 baths1,221 sq. ft.
Address Withheld By Seller, Canon City, CO 81212
MLS# 6071013Listed by: Keller Williams Premier Realty, LLC $425,000Active-- beds -- baths
621 Royal Gorge Boulevard, Canon City, CO 81212
MLS# 2660340Listed by: BERKSHIRE HATHAWAY HOMESERVICES ROCKY MOUNTAIN $35,000Active6.46 Acres
7080 Copper Gulch Rd, Cotopaxi, CO 81223
MLS# 4428147Listed by: Keller Williams Clients Choice Realty $339,000Pending5 beds 3 baths2,040 sq. ft.
1046 Indiana Ave, Canon City, CO 81212
MLS# 1516238Listed by: HomeSmart Preferred Realty
Local realty services provided by:CENTURY 21 Trenka Real Estate, CENTURY 21 Top Dog Properties, CENTURY 21 Cornerstone
Based on information submitted to the MLS GRID as of December 17, 2025 06:31 PM. All data is obtained from various sources and may not have been verified by broker or MLS GRID. Supplied Open House information is subject to change without notice. All information should be independently reviewed and verified for accuracy. Properties may or may not be listed by the office/agent presenting the information.
The information being provided by Pikes Peak REALTOR® Services Corp. is for the consumer's personal, non-commercial use and may not be used for any purpose other than to identify prospective properties consumer may be interested in purchasing. Any information relating to real estate for sale referenced on this web site comes from the Internet Data Exchange (IDX) program of the Pikes Peak REALTOR® Services Corp.. CENTURY 21 Top Dog Properties is not a Multiple Listing Service (MLS), nor does it offer MLS access. This website is a service of CENTURY 21 Top Dog Properties, a broker participant of Pikes Peak REALTOR® Services Corp.. This web site may reference real estate listing(s) held by a brokerage firm other than the broker and/or agent who owns this web site.
The accuracy of all information, regardless of source, including but not limited to open house information, square footages and lot sizes, is deemed reliable but not guaranteed and should be personally verified through personal inspection by and/or with the appropriate professionals. The data contained herein is copyrighted by Pikes Peak REALTOR® Services Corp. and is protected by all applicable copyright laws. Any unauthorized dissemination of this information is in violation of copyright laws and is strictly prohibited.
The real estate listing information and related content displayed on this site is provided exclusively for consumers' personal, non-commercial use and may not be used for any purpose other than to identify prospective properties consumers may be interested in purchasing. This information and related content is deemed reliable but is not guaranteed accurate by the Pikes Peak REALTOR® Services Corp.
Copyright 2025 Pikes Peak REALTOR® Services Corp. All rights reserved.
The real estate listing information and related content displayed on this site is provided exclusively for consumer's personal, non-commercial use and may not be used for any purpose other than to identify prospective properties consumers may be interested in purchasing. This information and related content is deemed reliable but is not guaranteed accurate by Information and Real Estate Services, LLC.
Information source: Information and Real Estate Services, LLC. Provided for limited non-commercial use only under IRES Rules © Copyright IRES. The information being provided by Information and Real Estate Services is for the consumer's personal, non-commercial use and may not be used for any purpose other than to identify prospective properties consumer may be interested in purchasing. Any information relating to real estate for sale referenced on this web site comes from the Internet Data Exchange (IDX) program of the Information and Real Estate Services. This web site may reference real estate listing(s) held by a brokerage firm other than the broker and/or agent who owns this web site.
The accuracy of all information, regardless of source, including but not limited to open house information, square footages and lot sizes, is deemed reliable but not guaranteed and should be personally verified through personal inspection by and/or with the appropriate professionals. The data contained herein is copyrighted by Information and Real Estate Services and is protected by all applicable copyright laws. Any unauthorized dissemination of this information is in violation of copyright laws and is strictly prohibited.
All information deemed reliable but not guaranteed and should be independently verified. All properties are subject to prior sale, change or withdrawal. Neither listing broker(s) nor CENTURY 21 Top Dog Properties shall be responsible for any typographical errors, misinformation, misprints and shall be held totally harmless. Information being provided is for consumers' personal, non-commercial use and may not be used for any other purpose. The content relating to real estate for sale on this Web site comes in part from Pueblo Assocation of Realtors.
Popular searches near Fremont County, CO
Popular neighborhoods near Fremont County, CO
- Broadmoor, Colorado Springs properties for sale
- Broadmoor Bluffs, Colorado Springs properties for sale
- Broadmoor Heights, Colorado Springs properties for sale
- Broadmoor Hills, Colorado Springs properties for sale
- Canejos - Las Vegas, Colorado Springs properties for sale
- Cedar Heights, Colorado Springs properties for sale
- Cheyenne Hills, Colorado Springs properties for sale
- Dorchester Park, Colorado Springs properties for sale
- Gold Hill Mesa, Colorado Springs properties for sale
- Ivywild, Colorado Springs properties for sale
- Liberty Point, Pueblo properties for sale
- Lower Skyway, Colorado Springs properties for sale
- Manitou Springs, Manitou Springs properties for sale
- Old Broadmoor Road, Colorado Springs properties for sale
- Old Colorado City, Colorado Springs properties for sale
- Pleasant Valley, Colorado Springs properties for sale
- Southwest Colorado Springs, Colorado Springs properties for sale
- Stratmoor Hills, Colorado Springs properties for sale
- Stratton Meadows, Colorado Springs properties for sale
- Upper Skyway, Colorado Springs properties for sale
Zip codes near Fremont County, CO
- 80809 properties for sale
- 80813 properties for sale
- 80814 properties for sale
- 80816 properties for sale
- 80820 properties for sale
- 80829 properties for sale
- 80860 properties for sale
- 80926 properties for sale
- 81143 properties for sale
- 81201 properties for sale
- 81212 properties for sale
- 81222 properties for sale
- 81223 properties for sale
- 81226 properties for sale
- 81233 properties for sale
- 81240 properties for sale
- 81242 properties for sale
- 81244 properties for sale
- 81252 properties for sale
- 81253 properties for sale
©2025 Century 21 Real Estate LLC. All rights reserved. CENTURY 21®, the CENTURY 21 Logo and C21® are service marks owned by Century 21 Real Estate LLC. Century 21 Real Estate LLC fully supports the principles of the Fair Housing Act and the Equal Opportunity Act. Each office is independently owned and operated. Listing information is deemed reliable but not guaranteed accurate.
©2025 Century 21 Real Estate LLC. All rights reserved. CENTURY 21®, the CENTURY 21 Logo and C21® are service marks owned by Century 21 Real Estate LLC. Century 21 Real Estate LLC fully supports the principles of the Fair Housing Act and the Equal Opportunity Act. Each office is independently owned and operated. Listing information is deemed reliable but not guaranteed accurate.