- Aberdeen, Hampton homes for sale
- Chestnut, Newport News homes for sale
- Downtown, Hampton homes for sale
- Huntington, Newport News homes for sale
- Jefferson Park, Newport News homes for sale
- Marshall, Newport News homes for sale
- Mercury Central, Hampton homes for sale
- New Market, Newport News homes for sale
- Newsome, Newport News homes for sale
- Newsome Park, Newport News homes for sale
- North King Street, Hampton homes for sale
- North Newport News, Newport News homes for sale
- Northhampton, Hampton homes for sale
- Phoebus, Hampton homes for sale
- Salters Creek, Newport News homes for sale
- Stuart Gardens, Newport News homes for sale
- Tidemill Farm, Hampton homes for sale
- West Hampton, Hampton homes for sale
- Wickham, Newport News homes for sale
- Wythe, Hampton homes for sale
Greater Wythe, Hampton, VA - homes for sale
4 of 4 results displayed
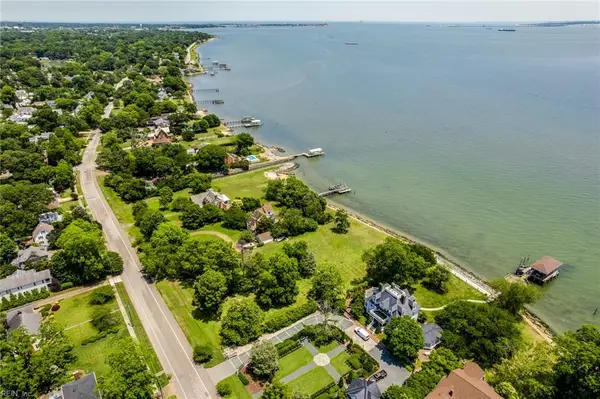 $560,000Active0.63 Acres
1508 Chesapeake Avenue, Hampton, VA 23661
MLS# 10620863Listed by: Atlantic Sothebys Int'l Realty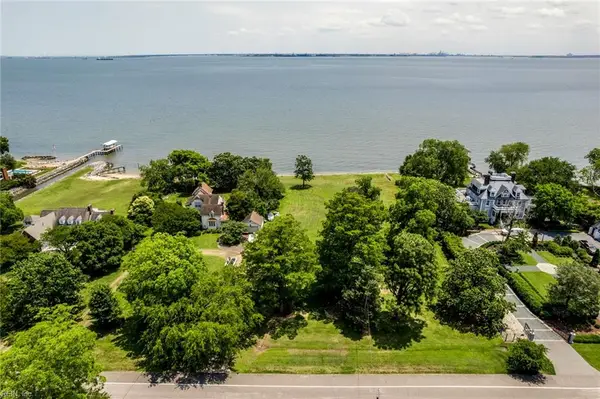 $565,000Active0.65 Acres
1506 Chesapeake Avenue, Hampton, VA 23661
MLS# 10620869Listed by: Atlantic Sothebys Int'l Realty $30,000Active0.08 Acres
732 Vaughan Avenue, Hampton, VA 23661
MLS# 10615116Listed by: AQ Realty LLC $40,000Pending0 Acres
2711 Shell Road, Hampton, VA 23661
MLS# 10395815Listed by: BHHS RW Towne Realty
Local realty services provided by:CENTURY 21 Realty @ Home
The listings data displayed on this medium comes in part from the Real Estate Information Network Inc. (REIN) and has been authorized by participating listing Broker Members of REIN for display. REIN's listings are based upon Data submitted by its Broker Members, and REIN therefore makes no representation or warranty regarding the accuracy of the Data. All users of REIN's listings database should confirm the accuracy of the listing information directly with the listing agent. 2026 REIN. REIN's listings Data and information is protected under federal copyright laws. Federal law prohibits, among other acts, the unauthorized copying or alteration of, or preparation of derivative works from, all or any part of copyrighted materials, including certain compilations of Data and information. COPYRIGHT VIOLATORS MAY BE SUBJECT TO SEVERE FINES AND PENALTIES UNDER FEDERAL LAW. REIN updates its listings on a daily basis. Data last updated: March 19, 2026 This application does not include information on all of the properties available for sale at this time.
Some listings may be duplicated in the search results due to the co-mingling of listings from more than one multiple listing service. Should there be different listing information between the duplicated listings; user is advised to verify the accuracy of the listing information before making any financial decisions.
2026 REIN, Inc. Information Deemed Reliable But Not Guaranteed.
Popular neighborhoods near Greater Wythe, Hampton, VA
Zip codes near Greater Wythe, Hampton, VA
- 23314 homes for sale
- 23433 homes for sale
- 23436 homes for sale
- 23503 homes for sale
- 23505 homes for sale
- 23507 homes for sale
- 23508 homes for sale
- 23517 homes for sale
- 23601 homes for sale
- 23605 homes for sale
- 23606 homes for sale
- 23607 homes for sale
- 23661 homes for sale
- 23662 homes for sale
- 23663 homes for sale
- 23664 homes for sale
- 23666 homes for sale
- 23669 homes for sale
- 23693 homes for sale
- 23703 homes for sale
Counties near Greater Wythe, Hampton, VA
- Charles City County homes for sale
- Chesapeake city County homes for sale
- Franklin city County homes for sale
- Gates County homes for sale
- Gloucester County homes for sale
- Hampton city County homes for sale
- Isle of Wight County homes for sale
- James City County homes for sale
- Mathews County homes for sale
- Newport News city County homes for sale
- Norfolk city County homes for sale
- Northampton County homes for sale
- Poquoson city County homes for sale
- Portsmouth city County homes for sale
- Southampton County homes for sale
- Suffolk city County homes for sale
- Surry County homes for sale
- Virginia Beach city County homes for sale
- Williamsburg city County homes for sale
- York County homes for sale
Protect your home and budget from life's surprises with an Assurant Home Warranty, backed by a partner that supports you through every step of homeownership. Explore Plans.
©2026 Century 21 Real Estate LLC. All rights reserved. CENTURY 21®, the CENTURY 21 Logo and C21® are service marks owned by Century 21 Real Estate LLC. Century 21 Real Estate LLC fully supports the principles of the Fair Housing Act and the Equal Opportunity Act. Each office is independently owned and operated. Listing information is deemed reliable but not guaranteed accurate.