- Batavia homes for sale
- Blackberry homes for sale
- Burlington Township homes for sale
- Campton homes for sale
- Campton Hills homes for sale
- Elburn homes for sale
- Geneva homes for sale
- Kaneville Township homes for sale
- Maple Park homes for sale
- North Aurora homes for sale
- Pingree Grove homes for sale
- Plato homes for sale
- Prestbury homes for sale
- St. Charles homes for sale
- St. Charles Township homes for sale
- South Elgin homes for sale
- Virgil Township homes for sale
- Wayne homes for sale
- Wayne homes for sale
- West Chicago homes for sale
Kane County, IL - homes for sale
300 of 1,629 results displayed
- Open Sat, 12 to 2pmNew
 $299,000Active4 beds 2 baths
302 Hubbard Avenue, Elgin, IL 60123
MLS# 12604588Listed by: MPOWER RESIDENTIAL BROKERAGE LLC
- New
 $275,000Active2 beds 2 baths1,400 sq. ft.
121 Monroe Avenue, Elgin, IL 60123
MLS# 12597559Listed by: REAL 1 REALTY - New
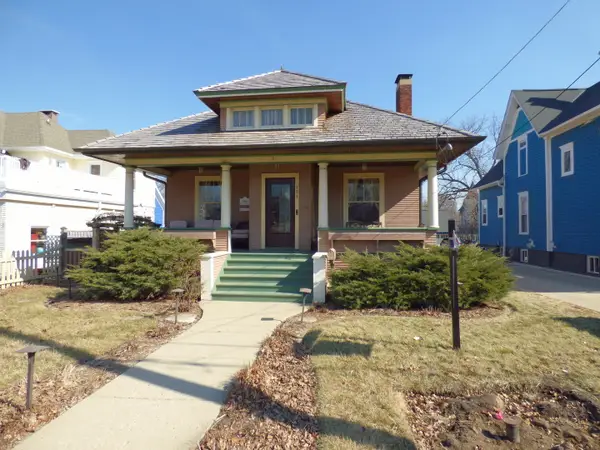
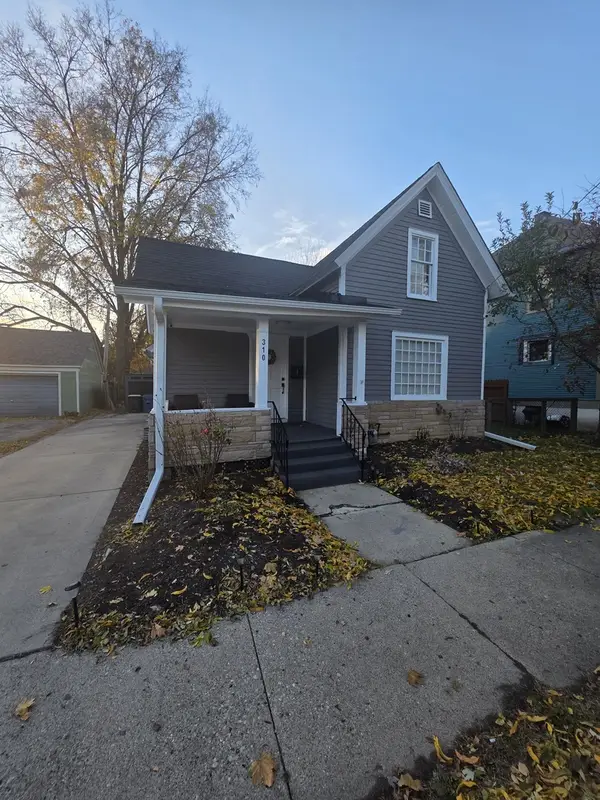 $268,000Active4 beds 2 baths1,278 sq. ft.
310 N Chestnut Street, Aurora, IL 60506
MLS# 12604590Listed by: CM REALTORS - New
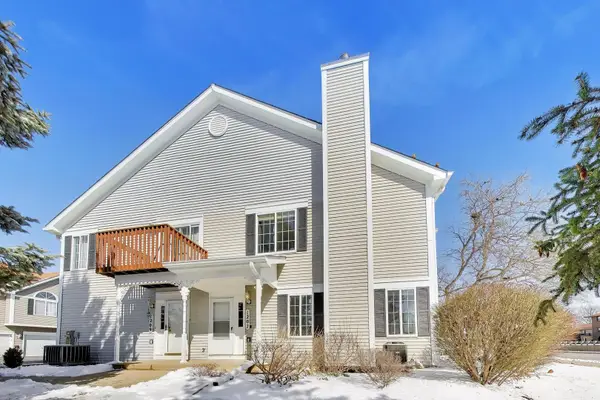 $275,000Active2 beds 2 baths1,830 sq. ft.
1207 Sandhurst Lane #C, South Elgin, IL 60177
MLS# 12577772Listed by: BERKSHIRE HATHAWAY HOMESERVICES STARCK REAL ESTATE - New
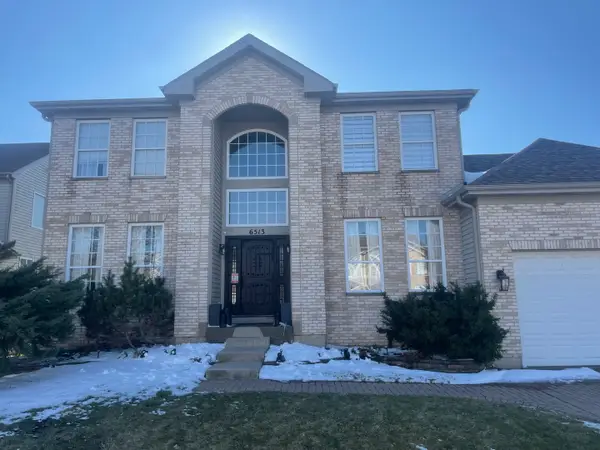 $469,000Active4 beds 3 baths2,450 sq. ft.
6513 Pine Hollow Road, Carpentersville, IL 60110
MLS# 12604388Listed by: ARC RED INC ARC REALTY GROUP - New
 $415,000Active4 beds 3 baths2,848 sq. ft.
616 Seneca Drive, Aurora, IL 60506
MLS# 12538043Listed by: CENTURY 21 CIRCLE - AURORA - New
 $289,000Active2 beds 1 baths907 sq. ft.
2311 Bluebell Court, Aurora, IL 60506
MLS# 12604386Listed by: O'NEIL PROPERTY GROUP, LLC - New
 $319,900Active3 beds 3 baths1,524 sq. ft.
1701 Deer Pointe Drive, South Elgin, IL 60177
MLS# 12600097Listed by: BROKEROCITY INC - New
 $485,000Active3 beds 2 baths2,171 sq. ft.
1494 Keller Street, Elburn, IL 60119
MLS# 12604355Listed by: BERKSHIRE HATHAWAY HOMESERVICES STARCK REAL ESTATE - New
 $379,000Active2 beds 2 baths1,551 sq. ft.
12939 Mesa Street, Huntley, IL 60142
MLS# 12603619Listed by: BERKSHIRE HATHAWAY HOMESERVICES STARCK REAL ESTATE - New
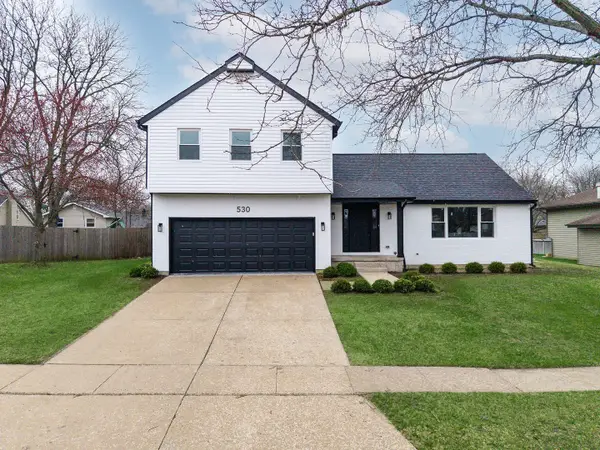 $695,000Active4 beds 3 baths2,589 sq. ft.
530 Cumberland Trail, Elgin, IL 60123
MLS# 12604056Listed by: PETER DROSSOS REAL ESTATE 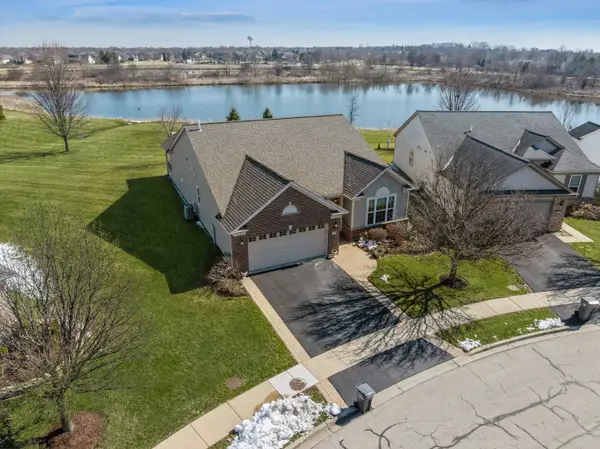 $480,000Pending2 beds 2 baths1,933 sq. ft.
2791 Beacon Point Circle, Elgin, IL 60124
MLS# 12593171Listed by: BAIRD & WARNER- New
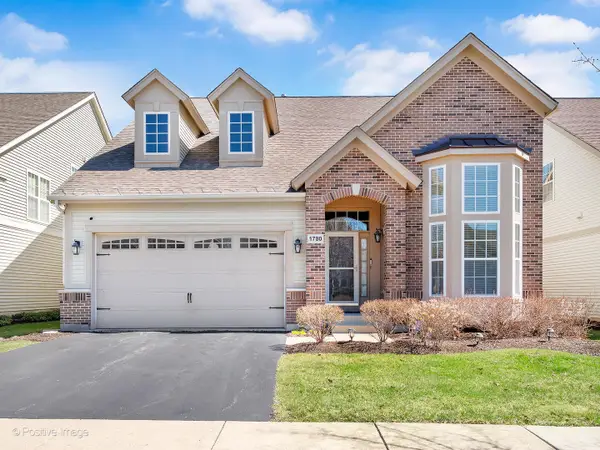 $539,900Active3 beds 3 baths2,686 sq. ft.
1780 Briarheath Drive, Aurora, IL 60505
MLS# 12602281Listed by: HOMESMART REALTY GROUP - New
 $354,900Active2 beds 2 baths1,450 sq. ft.
12942 Wisconsin Circle, Huntley, IL 60142
MLS# 12582421Listed by: HUNTLEY REALTY - New
 $995,000Active5 beds 4 baths4,281 sq. ft.
825 Persimmon Drive, St. Charles, IL 60174
MLS# 12602458Listed by: BAIRD & WARNER FOX VALLEY - GENEVA - New
 $625,000Active4 beds 4 baths2,031 sq. ft.
359 Johnson Woods Drive, Batavia, IL 60510
MLS# 12598010Listed by: HOMESMART CONNECT LLC - New
 $285,000Active2 beds 2 baths1,200 sq. ft.
115 Hunt Club Drive #114N, St. Charles, IL 60174
MLS# 12602106Listed by: ONE SOURCE REALTY - New
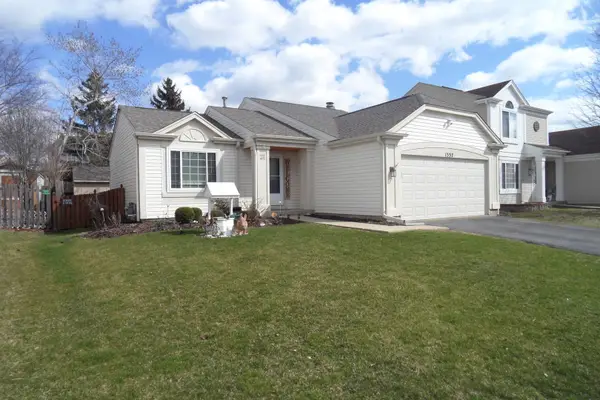 $359,000Active3 beds 2 baths1,440 sq. ft.
1337 Eastwood Drive, Aurora, IL 60506
MLS# 12603465Listed by: CENTURY 21 CIRCLE - AURORA - New
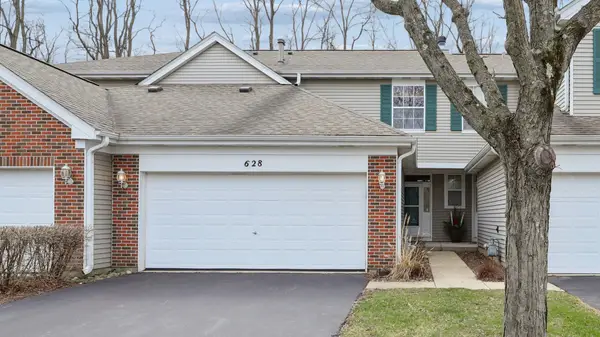 $372,500Active3 beds 3 baths1,780 sq. ft.
628 King Court #628, East Dundee, IL 60118
MLS# 12595263Listed by: WALL STREET PROPERTY GROUP, INC - New
 $249,900Active4 beds 2 baths1,440 sq. ft.
70 Railroad Street, Gilberts, IL 60136
MLS# 12598924Listed by: BROKEROCITY - New
 $459,000Active4 beds 3 baths1,908 sq. ft.
906 Bristol Street, Pingree Grove, IL 60140
MLS# 12602057Listed by: BAIRD & WARNER FOX VALLEY - GENEVA - New
 $214,900Active2 beds 1 baths1,164 sq. ft.
714 Division Street #G1-G2, South Elgin, IL 60177
MLS# 12603950Listed by: HOMESMART CONNECT LLC - Open Wed, 5:30 to 7:30pmNew
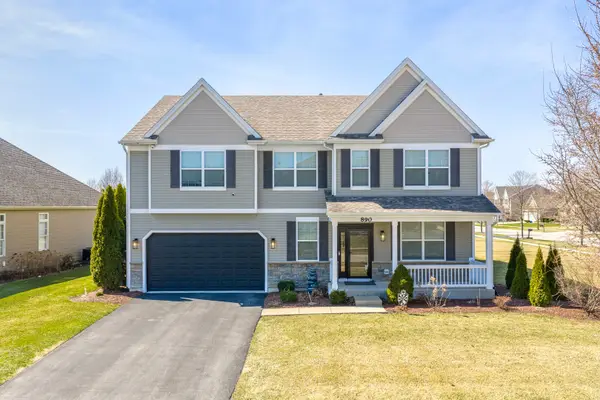 $630,000Active5 beds 4 baths3,360 sq. ft.
890 Stratford Drive, North Aurora, IL 60542
MLS# 12589751Listed by: KELLER WILLIAMS PREFERRED RLTY - New
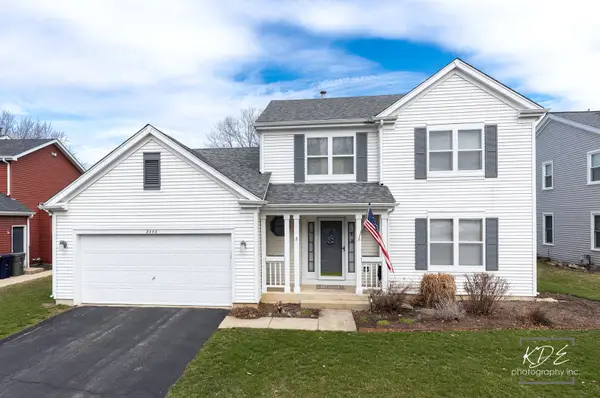 $410,000Active4 beds 3 baths1,872 sq. ft.
2478 Crystal Creek Lane, Elgin, IL 60124
MLS# 12593495Listed by: KELLER WILLIAMS INFINITY - New
 $415,000Active4 beds 3 baths3,187 sq. ft.
585 Park Street, Elgin, IL 60120
MLS# 12602532Listed by: RE/MAX ALL PRO - New
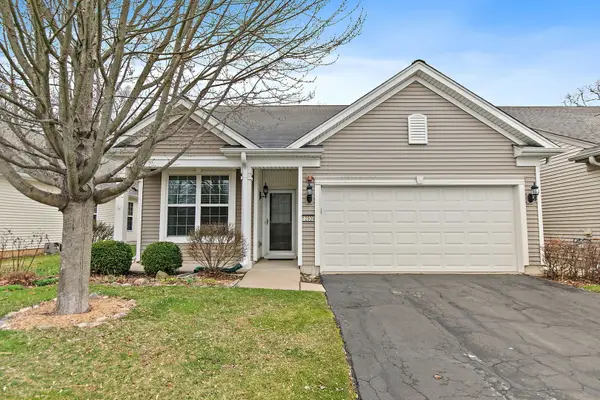
 $295,000Active3 beds 3 baths1,450 sq. ft.
1780 Pebble Beach Circle, Elgin, IL 60123
MLS# 12603928Listed by: LUNA REAL ESTATE INC. - Open Sat, 1 to 3pmNew
 $439,900Active5 beds 3 baths2,800 sq. ft.
1836 Ness Way, Montgomery, IL 60538
MLS# 12584224Listed by: COLDWELL BANKER REALTY  $474,900Pending4 beds 3 baths1,926 sq. ft.
313 S 1st Street, West Dundee, IL 60118
MLS# 12602587Listed by: CENTURY 21 NEW HERITAGE WEST- New
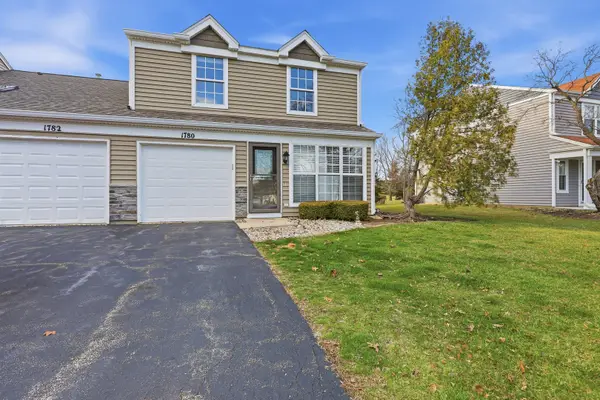
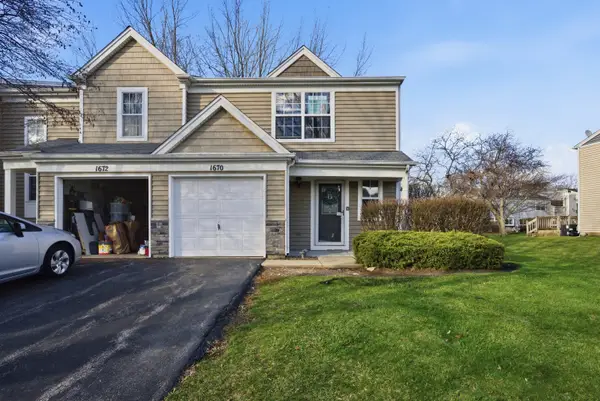 $270,000Active3 beds 2 baths1,255 sq. ft.
1670 College Green Drive, Elgin, IL 60123
MLS# 12603535Listed by: MPOWER RESIDENTIAL BROKERAGE LLC - New
 $522,500Active3 beds 3 baths2,052 sq. ft.
Unit 4B Prairie Grove Drive, Geneva, IL 60134
MLS# 12600342Listed by: EXP REALTY - ST. CHARLES - New
 $499,000Active2 beds 2 baths1,713 sq. ft.
Unit 8A Prairie Grove Drive, Geneva, IL 60134
MLS# 12600345Listed by: EXP REALTY - ST. CHARLES - New
 $510,000Active3 beds 2 baths1,898 sq. ft.
Unit 8B Prairie Grove Drive, Geneva, IL 60134
MLS# 12600348Listed by: EXP REALTY - ST. CHARLES - New
 $451,990Active4 beds 3 baths2,051 sq. ft.
468 Vista Drive, Hampshire, IL 60140
MLS# 12602788Listed by: DAYNAE GAUDIO - New
 $446,990Active4 beds 3 baths2,051 sq. ft.
469 Vista Drive, Hampshire, IL 60140
MLS# 12603286Listed by: DAYNAE GAUDIO - New
 $315,000Active3 beds 3 baths1,756 sq. ft.
2509 Bella Drive, Pingree Grove, IL 60140
MLS# 12603588Listed by: SUBURBAN LIFE REALTY, LTD - New
 $399,990Active2 beds 2 baths1,468 sq. ft.
402 Comstock Road, South Elgin, IL 60177
MLS# 12603610Listed by: LITTLE REALTY - New
 $299,000Active2 beds 3 baths1,521 sq. ft.
99 Ione Drive #B, South Elgin, IL 60177
MLS# 12603626Listed by: REAL BROKER LLC - New
 $458,990Active4 beds 3 baths2,051 sq. ft.
450 Vista Drive, Hampshire, IL 60140
MLS# 12603267Listed by: DAYNAE GAUDIO - New
 $466,990Active4 beds 3 baths2,051 sq. ft.
444 Vista Drive, Hampshire, IL 60140
MLS# 12603274Listed by: DAYNAE GAUDIO - New
 $515,000Active4 beds 4 baths2,688 sq. ft.
305 Hampton Road, Sugar Grove, IL 60554
MLS# 12585681Listed by: BAIRD & WARNER - New
 $430,000Active4 beds 3 baths2,410 sq. ft.
1932 Banks Drive, Elgin, IL 60123
MLS# 12590066Listed by: REDFIN CORPORATION - New
 $800,000Active5 beds 5 baths3,601 sq. ft.
23 Marsh Lane, Batavia, IL 60510
MLS# 12603349Listed by: KELLER WILLIAMS INSPIRE - GENEVA - New
 $593,365Active4 beds 3 baths2,536 sq. ft.
552 Ayre Drive, Elgin, IL 60124
MLS# 12603409Listed by: HOMESMART CONNECT LLC - New
 $599,535Active4 beds 3 baths2,662 sq. ft.
589 Lismore Circle, Elgin, IL 60124
MLS# 12603434Listed by: HOMESMART CONNECT LLC - New
 $865,000Active4 beds 3 baths3,500 sq. ft.
42W534 Empire Road, St. Charles, IL 60175
MLS# 12603503Listed by: EXP REALTY - New
 $285,000Active3 beds 1 baths1,000 sq. ft.
1232 Lebanon Street, Montgomery, IL 60538
MLS# 12598220Listed by: KELLER WILLIAMS INNOVATE - AURORA - New
 $625,000Active4 beds 3 baths3,604 sq. ft.
9 Buckingham Drive, Sugar Grove, IL 60554
MLS# 12603305Listed by: KELLER WILLIAMS INNOVATE - AURORA - New
 $299,990Active2 beds 3 baths1,579 sq. ft.
1437 Oakfield Lane, Pingree Grove, IL 60140
MLS# 12603380Listed by: DAYNAE GAUDIO - New
 $529,990Active4 beds 3 baths2,235 sq. ft.
549 Ayre Drive, Elgin, IL 60124
MLS# 12603395Listed by: HOMESMART CONNECT LLC - New
 $500,000Active5 beds 4 baths2,808 sq. ft.
401 E Side Drive, Geneva, IL 60134
MLS# 12594741Listed by: BAIRD & WARNER FOX VALLEY - GENEVA - New
 $775,000Active4 beds 5 baths3,420 sq. ft.
40W612 Blue Lake Circle N, St. Charles, IL 60175
MLS# 12596410Listed by: COMPASS - New
 $799,900Active6 beds 5 baths3,748 sq. ft.
3596 Prestwick Court, Elgin, IL 60124
MLS# 12599384Listed by: RE/MAX HORIZON - New
 $440,000Active4 beds 2 baths2,672 sq. ft.
1213 Jill Peak Drive, Sleepy Hollow, IL 60118
MLS# 12601542Listed by: PRELLO REALTY - New
 $110,000Active2 beds 2 baths975 sq. ft.
801 N Mclean Boulevard #320, Elgin, IL 60123
MLS# 12603249Listed by: EXP REALTY - CHICAGO NORTH AVE  $425,000Pending4 beds 4 baths1,876 sq. ft.
1859 Sedgegrass Trail, Aurora, IL 60504
MLS# 12590309Listed by: KELLER WILLIAMS INFINITY- New
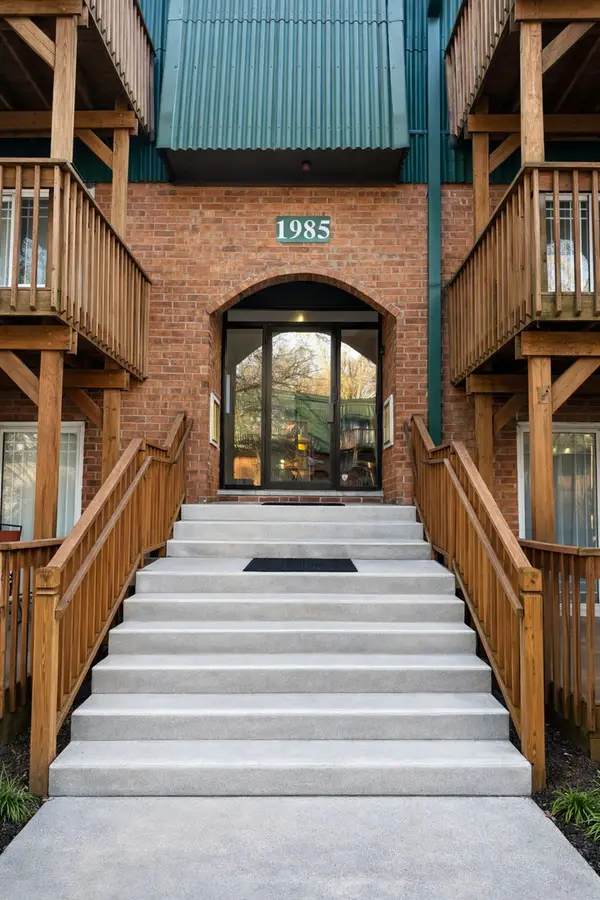 $169,900Active2 beds 2 baths908 sq. ft.
1985 Tall Oaks Drive #1A, Aurora, IL 60505
MLS# 12603201Listed by: HOMESMART CONNECT LLC - New
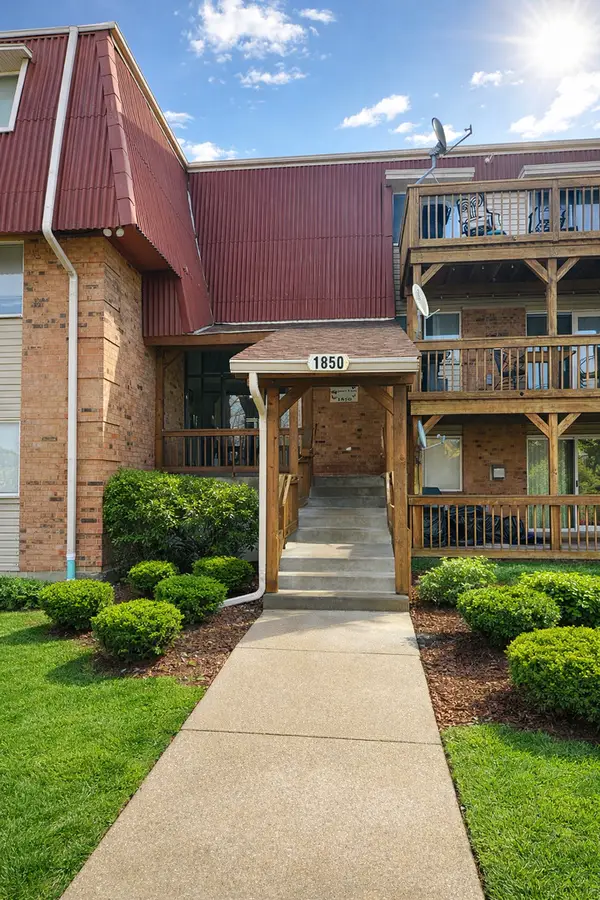 $119,900Active1 beds 1 baths660 sq. ft.
1850 Tall Oaks Drive #2204, Aurora, IL 60505
MLS# 12603224Listed by: HOMESMART CONNECT LLC - New
 $300,000Active2 beds 2 baths
308 Windsor Court #C, South Elgin, IL 60177
MLS# 12580013Listed by: REALTY EXECUTIVES ADVANCE - New
 $285,000Active3 beds 1 baths1,265 sq. ft.
312 Le Grande Boulevard, Aurora, IL 60506
MLS# 12596825Listed by: KELLER WILLIAMS INNOVATE - AURORA - New
 $375,000Active4 beds 2 baths1,452 sq. ft.
20 S Central Avenue, Aurora, IL 60506
MLS# 12599518Listed by: BERKSHIRE HATHAWAY HOMESERVICES STARCK REAL ESTATE - New
 $260,000Active2 beds 2 baths1,149 sq. ft.
208 Maple Street #C, Sugar Grove, IL 60554
MLS# 12601744Listed by: JOHN GREENE, REALTOR - Open Wed, 5 to 7pmNew
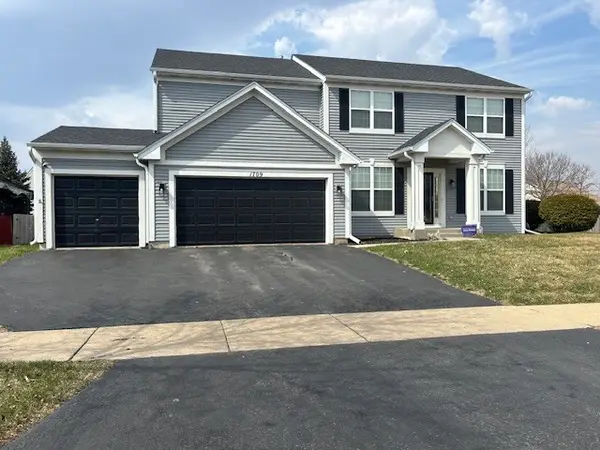 $489,900Active6 beds 4 baths3,108 sq. ft.
1709 Wick Way, Montgomery, IL 60538
MLS# 12601839Listed by: OLIVEROS REALTY COMPANY  $260,000Pending2 beds 3 baths1,300 sq. ft.
1068 Serendipity Drive, Aurora, IL 60504
MLS# 12601897Listed by: KELLER WILLIAMS INNOVATE- New
 $379,999Active3 beds 3 baths1,468 sq. ft.
482 Comstock Rd Road, South Elgin, IL 60177
MLS# 12603161Listed by: YOUMU VENTURES LLC - New
 $384,900Active3 beds 3 baths1,663 sq. ft.
1880 Gleneagle Circle, Elgin, IL 60123
MLS# 12603110Listed by: CORONA REALTY COMPANY - New
 $430,000Active5 beds 4 baths3,116 sq. ft.
730 Boyce Road, Sugar Grove, IL 60554
MLS# 12600310Listed by: @PROPERTIES CHRISTIE'S INTERNATIONAL REAL ESTATE - New
 $689,000Active4 beds 3 baths2,590 sq. ft.
17N620 Ketchum Road, Hampshire, IL 60140
MLS# 12601895Listed by: A&O DREAM KEY REAL ESTATE - New
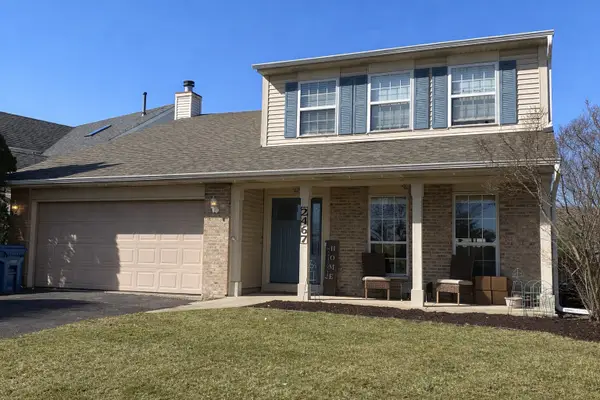 $379,000Active3 beds 3 baths1,640 sq. ft.
2467 Deerfield Drive, Aurora, IL 60506
MLS# 12602627Listed by: CENTURY 21 INTEGRA - New
 $485,500Active4 beds 3 baths2,004 sq. ft.
1214 Jill Peak Drive, Sleepy Hollow, IL 60118
MLS# 12603026Listed by: KELLER WILLIAMS SUCCESS REALTY - New
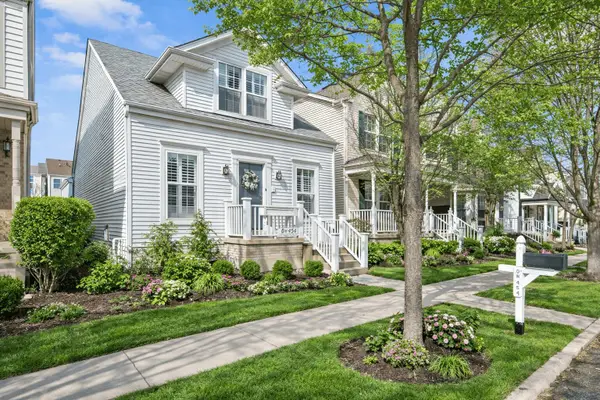 $424,900Active3 beds 4 baths2,489 sq. ft.
0N454 Dooley Drive, Geneva, IL 60134
MLS# 12603087Listed by: ONE SOURCE REALTY - New
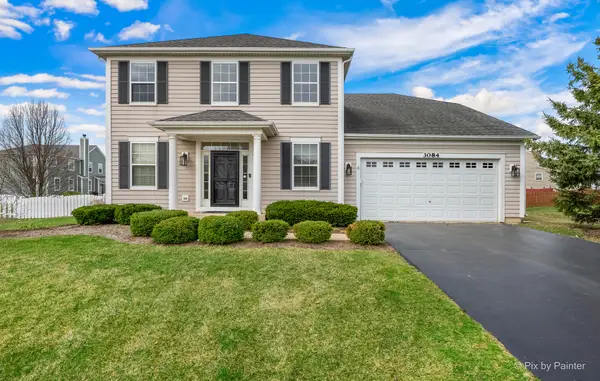 $515,000Active4 beds 3 baths2,549 sq. ft.
3084 Seekonk Avenue, Elgin, IL 60124
MLS# 12579892Listed by: SUBURBAN LIFE REALTY, LTD. 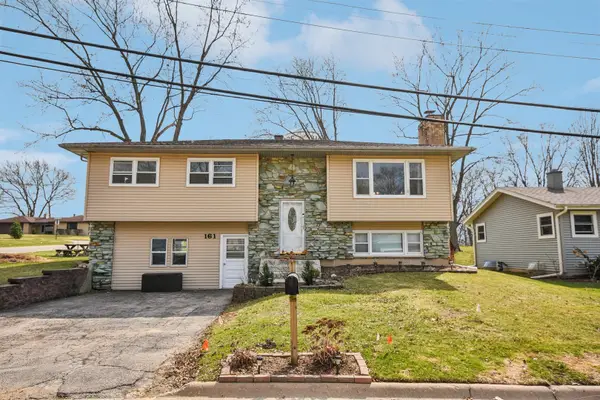 $289,000Pending4 beds 2 baths1,170 sq. ft.
161 High Avenue, Hampshire, IL 60140
MLS# 12583179Listed by: RE/MAX CONNECTIONS II- New
 $700,000Active4 beds 3 baths3,300 sq. ft.
3691 Skyglade Drive, Elgin, IL 60124
MLS# 12594180Listed by: SUBURBAN LIFE REALTY, LTD. - New
 $399,000Active3 beds 3 baths2,352 sq. ft.
487 Town Center Boulevard, Gilberts, IL 60136
MLS# 12596789Listed by: BROKEROCITY INC - New
 $389,900Active4 beds 3 baths2,294 sq. ft.
220 N Rosedale Avenue, Aurora, IL 60506
MLS# 12602981Listed by: NEXTHOME ACOSTA - New
 $620,000Active4 beds 4 baths3,200 sq. ft.
660 Avon Court, Elburn, IL 60119
MLS# 12548938Listed by: EXP REALTY - GENEVA - New
 $459,990Active4 beds 3 baths1,953 sq. ft.
1241 Acadia Circle, Pingree Grove, IL 60140
MLS# 12602937Listed by: DAYNAE GAUDIO 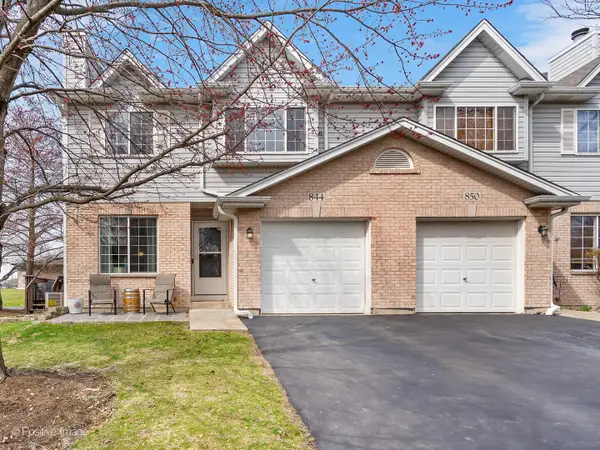 $280,000Pending2 beds 2 baths1,342 sq. ft.
844 N 1st Street, Elburn, IL 60119
MLS# 12602603Listed by: @PROPERTIES CHRISTIES INTERNATIONAL REAL ESTATE- New
 $469,990Active4 beds 3 baths2,600 sq. ft.
Address Withheld By Seller, Hampshire, IL 60140
MLS# 12602724Listed by: DAYNAE GAUDIO - New
 $708,385Active4 beds 3 baths3,275 sq. ft.
1849 Diamond Drive, Elgin, IL 60124
MLS# 12602828Listed by: HOMESMART CONNECT LLC - New
 $658,310Active3 beds 3 baths2,441 sq. ft.
1848 Chandolin Lane, Elgin, IL 60124
MLS# 12602844Listed by: HOMESMART CONNECT LLC - New
 $300,000Active5 beds 3 baths3,032 sq. ft.
674 N Liberty Street, Elgin, IL 60120
MLS# 12602859Listed by: KERI HIR - New
 $369,990Active3 beds 3 baths1,767 sq. ft.
12173 Dodwell Street, Huntley, IL 60142
MLS# 12602870Listed by: HOMESMART CONNECT LLC - New
 $349,900Active4 beds 2 baths1,689 sq. ft.
214 S Fordham Avenue, Aurora, IL 60506
MLS# 12602266Listed by: ONE PERCENT PROPERTIES - New
 $445,000Active4 beds 3 baths1,965 sq. ft.
117 Fieldcrest Avenue, Hampshire, IL 60140
MLS# 12602649Listed by: KOMAR - New
 $469,990Active4 beds 3 baths2,600 sq. ft.
457 Vista Drive, Hampshire, IL 60140
MLS# 12602719Listed by: DAYNAE GAUDIO - New
 $476,990Active4 beds 3 baths2,600 sq. ft.
Address Withheld By Seller, Hampshire, IL 60140
MLS# 12602734Listed by: DAYNAE GAUDIO - New
 $471,990Active4 beds 3 baths2,600 sq. ft.
Address Withheld By Seller, Hampshire, IL 60140
MLS# 12602747Listed by: DAYNAE GAUDIO  $379,990Pending3 beds 3 baths1,840 sq. ft.
12185 Dodwell Street, Huntley, IL 60142
MLS# 12602690Listed by: HOMESMART CONNECT LLC- New
 $600,000Active4 beds 3 baths2,242 sq. ft.
7N002 Glenview Drive, St. Charles, IL 60175
MLS# 12546440Listed by: KELLER WILLIAMS INSPIRE - GENEVA - New
 $245,000Active3 beds 2 baths1,214 sq. ft.
417 Virgil Street, Maple Park, IL 60151
MLS# 12560789Listed by: BAIRD & WARNER - New
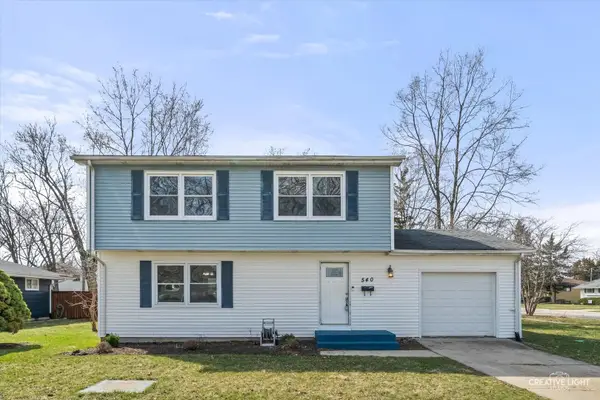 $320,000Active4 beds 2 baths1,500 sq. ft.
540 N Rosedale Avenue, Aurora, IL 60506
MLS# 12581269Listed by: KELLER WILLIAMS PREMIERE PROPERTIES - New
 $339,900Active3 beds 3 baths1,900 sq. ft.
2448 Emily Lane, Elgin, IL 60124
MLS# 12600099Listed by: PAK HOME REALTY - New
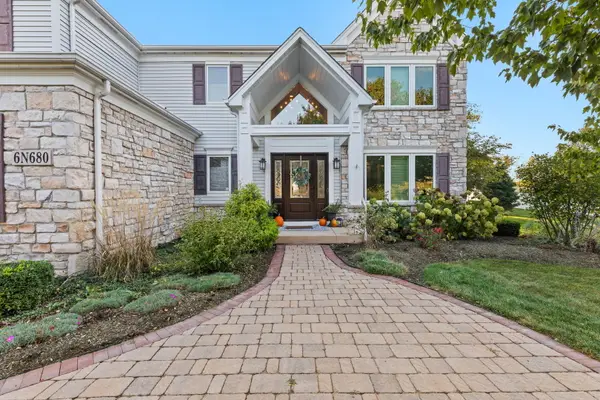 $700,000Active4 beds 3 baths2,647 sq. ft.
6N680 Somerset Drive, St. Charles, IL 60175
MLS# 12600908Listed by: SOUTHWESTERN REAL ESTATE, INC. - New
 $640,000Active4 beds 3 baths4,162 sq. ft.
3591 Ayres Drive, Aurora, IL 60506
MLS# 12602232Listed by: KELLER WILLIAMS INNOVATE - AURORA - New
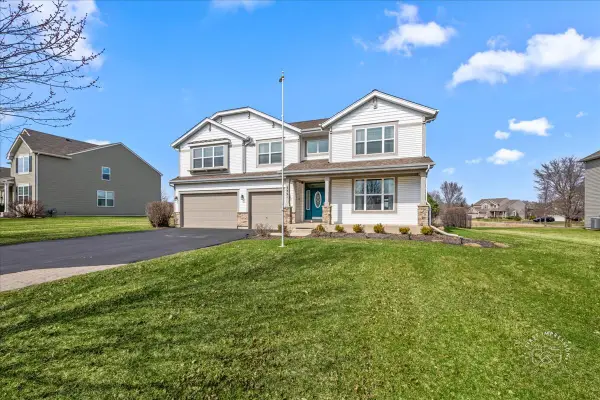
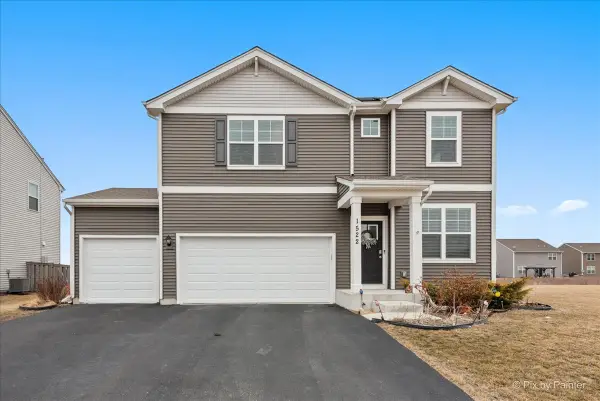 $469,900Active4 beds 3 baths2,356 sq. ft.
1522 Hollow Tree Lane, Pingree Grove, IL 60140
MLS# 12602571Listed by: KELLER WILLIAMS INSPIRE - GENEVA - New
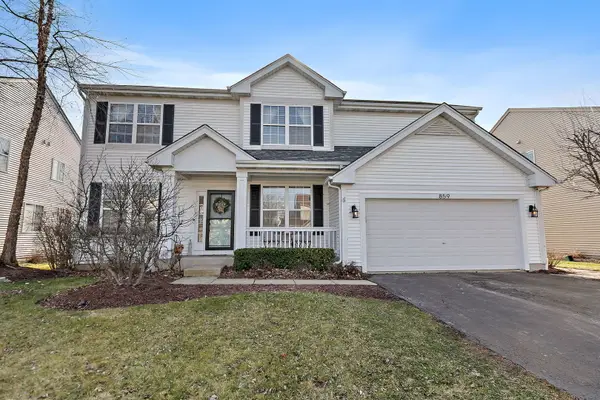 $495,000Active5 beds 4 baths2,490 sq. ft.
859 Dover Street, Pingree Grove, IL 60140
MLS# 12564319Listed by: COMPASS - New
 $300,000Active3 beds 3 baths1,605 sq. ft.
2436 Courtyard Circle #1, Aurora, IL 60506
MLS# 12599599Listed by: KELLER WILLIAMS PREMIERE PROPERTIES - New
 $364,900Active3 beds 3 baths1,756 sq. ft.
217 Goldenrod Drive, Elgin, IL 60124
MLS# 12601055Listed by: EXIT REALTY REDEFINED - New
 $339,900Active5 beds 2 baths1,632 sq. ft.
214 Read Street, Elburn, IL 60119
MLS# 12602065Listed by: REALTY OF AMERICA, LLC  $366,999Pending3 beds 3 baths1,764 sq. ft.
333 Settlers Place, West Dundee, IL 60118
MLS# 12602427Listed by: HOMESMART CONNECT LLC- New
 $403,999Active3 beds 3 baths2,039 sq. ft.
329 Settlers Place, West Dundee, IL 60118
MLS# 12602440Listed by: HOMESMART CONNECT LLC - New
 $419,900Active3 beds 3 baths2,221 sq. ft.
321 Settlers Place, West Dundee, IL 60118
MLS# 12602447Listed by: HOMESMART CONNECT LLC - New
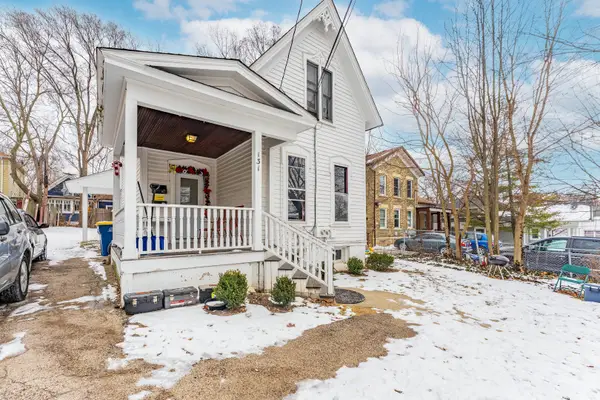 $310,000Active4 beds 2 baths
131 N Gifford Street, Elgin, IL 60120
MLS# 12602469Listed by: REALTY OF AMERICA, LLC - New
 $679,000Active4 beds 3 baths2,359 sq. ft.
747 Cheever Avenue, Geneva, IL 60134
MLS# 12583658Listed by: BAIRD & WARNER FOX VALLEY - GENEVA - New
 $289,900Active2 beds 1 baths873 sq. ft.
1150 Cedar Avenue, Elgin, IL 60120
MLS# 12599147Listed by: EXP REALTY - ST. CHARLES 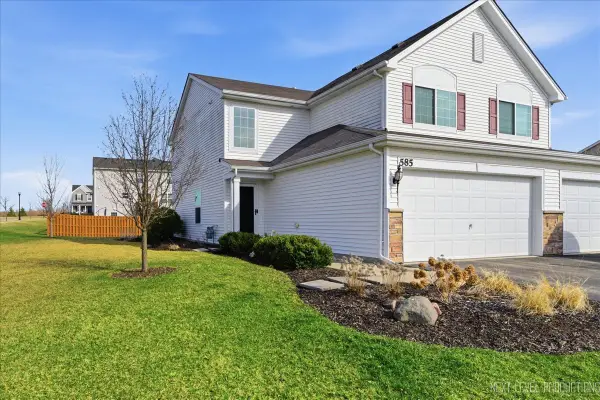 $319,900Pending3 beds 3 baths1,554 sq. ft.
585 Vine Street, Hampshire, IL 60140
MLS# 12600829Listed by: RE/MAX ALL PRO - ST CHARLES- New
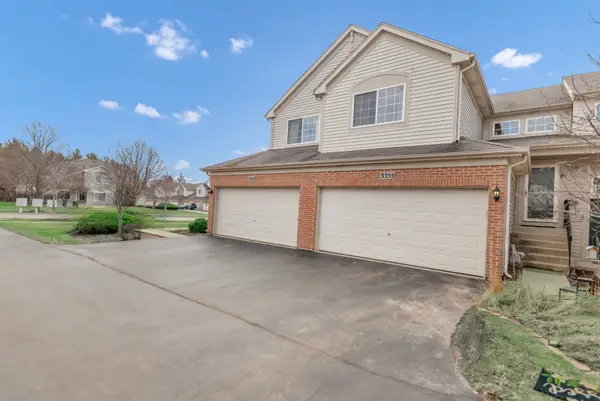 $315,000Active3 beds 2 baths1,501 sq. ft.
3355 Blue Ridge Drive, Carpentersville, IL 60110
MLS# 12601656Listed by: LEGACY PROPERTIES, A SARAH LEONARD COMPANY, LLC - New
 $399,990Active3 beds 3 baths1,840 sq. ft.
809 Lindsay Lane, West Dundee, IL 60118
MLS# 12602347Listed by: HOMESMART CONNECT LLC - New
 $403,990Active3 beds 3 baths1,840 sq. ft.
805 Lindsay Lane, West Dundee, IL 60118
MLS# 12602358Listed by: HOMESMART CONNECT LLC - New
 $399,490Active3 beds 3 baths1,767 sq. ft.
811 Lindsay Lane, West Dundee, IL 60118
MLS# 12602378Listed by: HOMESMART CONNECT LLC - New
 $365,999Active3 beds 3 baths1,764 sq. ft.
337 Settlers Place, West Dundee, IL 60118
MLS# 12602417Listed by: HOMESMART CONNECT LLC - New
 $452,990Active2 beds 2 baths1,863 sq. ft.
787 Plateau Drive, Pingree Grove, IL 60140
MLS# 12566704Listed by: DAYNAE GAUDIO - New
 $700,000Active3 beds 3 baths2,513 sq. ft.
45W169 Hillview Lane, Hampshire, IL 60140
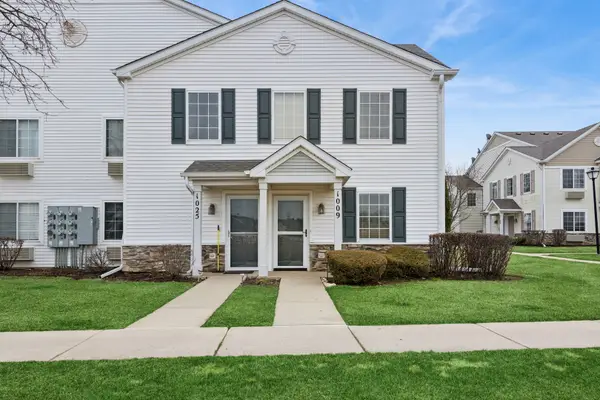
MLS# 12587016Listed by: COMPASS  $365,000Pending5 beds 2 baths2,438 sq. ft.
1009 Meadow Lane, Elgin, IL 60123
MLS# 12592088Listed by: CASTLE VIEW REAL ESTATE- New
 $549,900Active4 beds 3 baths2,450 sq. ft.
1506 Division Street, St. Charles, IL 60174
MLS# 12599636Listed by: LEGACY PROPERTIES, A SARAH LEONARD COMPANY, LLC - New
 $405,900Active4 beds 2 baths1,710 sq. ft.
1000 Jackson Avenue, St. Charles, IL 60174
MLS# 12599898Listed by: BERKSHIRE HATHAWAY HOMESERVICES STARCK REAL ESTATE - New
 $429,900Active4 beds 3 baths1,641 sq. ft.
0N953 Probst Court, Maple Park, IL 60151
MLS# 12601212Listed by: IHOME REAL ESTATE - New
 $452,990Active2 beds 2 baths1,863 sq. ft.
2513 Skye Drive, Pingree Grove, IL 60140
MLS# 12601269Listed by: DAYNAE GAUDIO - New
 $447,990Active2 beds 2 baths1,744 sq. ft.
2523 Skye Drive, Pingree Grove, IL 60140
MLS# 12601355Listed by: DAYNAE GAUDIO - New
 $462,990Active2 beds 2 baths1,863 sq. ft.
2533 Skye Drive, Pingree Grove, IL 60140
MLS# 12602204Listed by: DAYNAE GAUDIO - New
 $479,900Active3 beds 2 baths1,822 sq. ft.
405 S Constitution Drive, Aurora, IL 60506
MLS# 12602241Listed by: HOMESMART CONNECT LLC  $345,000Pending3 beds 2 baths1,532 sq. ft.
338 Lakelawn Boulevard, Aurora, IL 60506
MLS# 12602257Listed by: EXP REALTY- New
 $534,900Active4 beds 4 baths3,365 sq. ft.
3435 Antoine Place, St. Charles, IL 60175
MLS# 12570341Listed by: REALSTAR REALTY, INC - New
 $275,000Active2 beds 2 baths1,152 sq. ft.
746 Fieldcrest Drive #B, South Elgin, IL 60177
MLS# 12593767Listed by: SUBURBAN LIFE REALTY, LTD - New
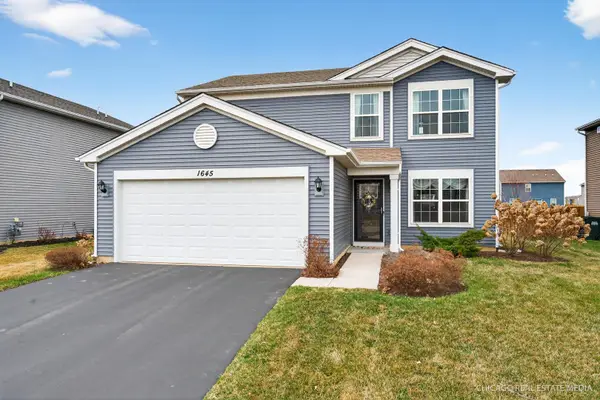 $425,000Active4 beds 3 baths2,008 sq. ft.
1645 Bayberry Lane, Pingree Grove, IL 60140
MLS# 12596576Listed by: KELLER WILLIAMS SUCCESS REALTY - New
 $439,000Active4 beds 3 baths2,809 sq. ft.
2176 Jordan Lane, Elgin, IL 60123
MLS# 12598306Listed by: DNV SOLUTIONS LLC - New
 $476,000Active4 beds 3 baths2,516 sq. ft.
224 Johnson Street, Hampshire, IL 60140
MLS# 12599573Listed by: REALTY OF AMERICA, LLC 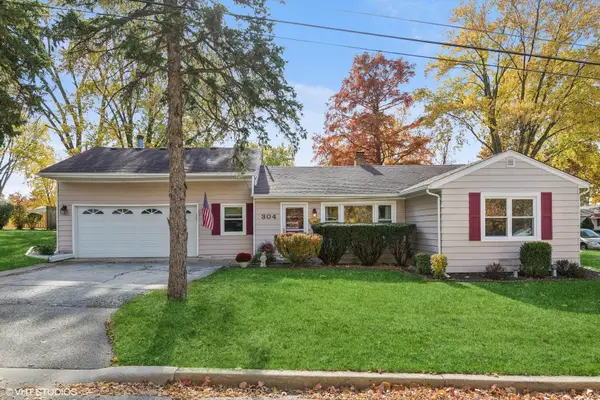 $329,000Pending3 beds 1 baths1,485 sq. ft.
304 Moore Avenue, St. Charles, IL 60174
MLS# 12599998Listed by: @PROPERTIES CHRISTIE'S INTERNATIONAL REAL ESTATE- New
 $325,000Active3 beds 2 baths2,012 sq. ft.
804 Elm Street, Maple Park, IL 60151
MLS# 12601526Listed by: HOMESMART CONNECT LLC  $789,000Pending5 beds 4 baths3,240 sq. ft.
41W815 Bowgren Drive, Elburn, IL 60119
MLS# 12601709Listed by: REDFIN CORPORATION- New
 $349,990Active3 beds 3 baths1,758 sq. ft.
1411 Oakfield Lane, Pingree Grove, IL 60140
MLS# 12602174Listed by: DAYNAE GAUDIO  $615,000Pending3 beds 4 baths2,563 sq. ft.
2220 Brookwood Drive, South Elgin, IL 60177
MLS# 12602191Listed by: KOZAR REAL ESTATE GROUP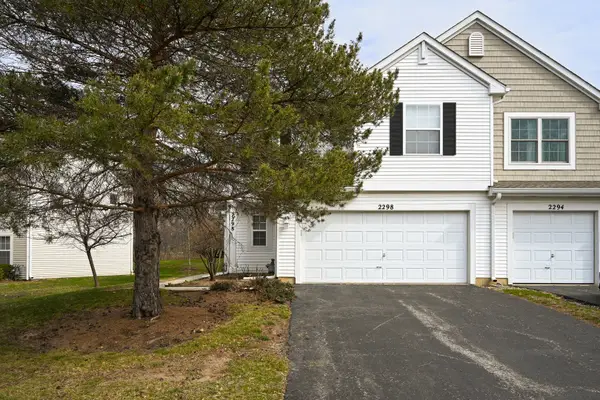 $285,000Pending2 beds 3 baths1,455 sq. ft.
2298 Woodside Drive, Carpentersville, IL 60110
MLS# 12540181Listed by: PLATINUM PARTNERS REALTORS $330,000Pending3 beds 2 baths1,584 sq. ft.
1235 Constellation Drive, Aurora, IL 60505
MLS# 12551468Listed by: KELLER WILLIAMS INNOVATE - AURORA- New
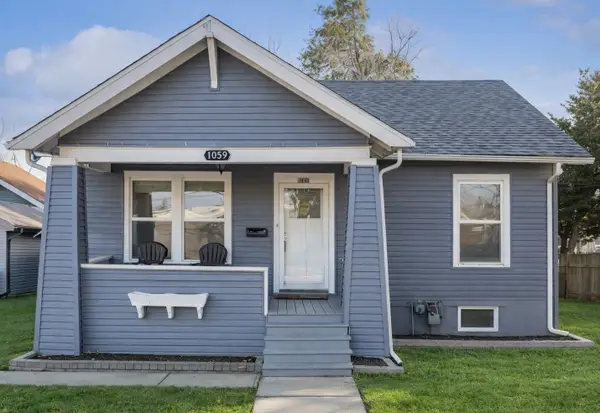 $259,000Active2 beds 2 baths1,000 sq. ft.
1059 Larkin Avenue, Elgin, IL 60123
MLS# 12599536Listed by: REALTY OF AMERICA, LLC - New
 $276,900Active3 beds 3 baths1,812 sq. ft.
111 Hidden Creek Lane, North Aurora, IL 60542
MLS# 12600406Listed by: CHICAGOLAND BROKERS, INC - New
 $374,900Active3 beds 3 baths1,800 sq. ft.
1418 Winaki Trail, Algonquin, IL 60102
MLS# 12600407Listed by: EXIT STRATEGY REALTY - New
 $1,200,000Active4 beds 3 baths3,686 sq. ft.
1301 South Batavia Avenue, Geneva, IL 60134
MLS# 12601214Listed by: VESTUTO REAL ESTATE CORP - New
 $600,000Active4 beds 4 baths2,462 sq. ft.
306 Atkinson Drive, Sugar Grove, IL 60554
MLS# 12578858Listed by: EXP REALTY - YORKVILLE - New
 $379,000Active3 beds 2 baths1,696 sq. ft.
849 Hemlock Drive, Sleepy Hollow, IL 60118
MLS# 12588200Listed by: KELLER WILLIAMS INSPIRE - New
 $330,000Active3 beds 3 baths1,806 sq. ft.
182 Brompton Lane #A, Sugar Grove, IL 60554
MLS# 12602025Listed by: NORTHWEST REAL ESTATE GROUP - New
 $500,000Active2 beds 2 baths2,334 sq. ft.
13776 Fieldstone Drive, Huntley, IL 60142
MLS# 12602028Listed by: CENTURY 21 NEW HERITAGE - New
 $290,000Active3 beds 1 baths1,045 sq. ft.
742 Cedardale Place, Aurora, IL 60506
MLS# 12598574Listed by: HOMETOWN REALTY GROUP - New
 $245,000Active3 beds 2 baths1,380 sq. ft.
791 Serendipity Drive, Aurora, IL 60504
MLS# 12601948Listed by: NET REALTY CORP - New
 $279,900Active3 beds 1 baths1,142 sq. ft.
900 Old Indian Trail, Aurora, IL 60506
MLS# 12593649Listed by: O'NEIL PROPERTY GROUP, LLC - New
 $279,500Active3 beds 1 baths1,392 sq. ft.
208 W State Street, North Aurora, IL 60542
MLS# 12600539Listed by: KELLER WILLIAMS PREMIERE PROPERTIES - New
 $355,000Active2 beds 2 baths1,512 sq. ft.
12256 Barcroft Circle S, Huntley, IL 60142
MLS# 12600748Listed by: OPENDOOR BROKERAGE, LLC - New
 $299,000Active3 beds 3 baths1,380 sq. ft.
42W470 Red Bud Court, St. Charles, IL 60175
MLS# 12587878Listed by: COLDWELL BANKER REALTY - New
 $240,000Active2 beds 2 baths1,049 sq. ft.
1009 Silverstone Drive #1009, Carpentersville, IL 60110
MLS# 12597909Listed by: BAIRD & WARNER - New
 $425,000Active3 beds 4 baths1,811 sq. ft.
811 King Henry Lane, St. Charles, IL 60174
MLS# 12600589Listed by: KELLER WILLIAMS INSPIRE - New
 $299,900Active2 beds 2 baths1,538 sq. ft.
2419 Emily Lane, Elgin, IL 60124
MLS# 12599346Listed by: KELLER WILLIAMS INFINITY - New
 $169,900Active4 beds 2 baths1,224 sq. ft.
523 N Highland Avenue, Aurora, IL 60506
MLS# 12600089Listed by: KETTLEY & CO. INC. - AURORA - New
 $195,000Active3 beds 2 baths1,087 sq. ft.
1358 Monomoy Street #A, Aurora, IL 60506
MLS# 12600610Listed by: RE/MAX MI CASA - New
 $189,900Active0.37 Acres
39W709 Walt Whitman Road, St. Charles, IL 60175
MLS# 12601615Listed by: BEST U.S. REALTY - New
 $580,000Active3 beds 2 baths2,100 sq. ft.
3606 Harmony Circle, Elgin, IL 60124
MLS# 12582339Listed by: COLDWELL BANKER REALTY  $375,000Pending2 beds 2 baths1,400 sq. ft.
418 Houston Street, Batavia, IL 60510
MLS# 12598080Listed by: RE/MAX ALL PRO - ST CHARLES- New
 $350,000Active4 beds 2 baths1,428 sq. ft.
1295 Foxcroft Drive, Aurora, IL 60506
MLS# 12600952Listed by: EXP REALTY - New
 $419,000Active3 beds 2 baths2,020 sq. ft.
2205 Country Knoll Lane, Elgin, IL 60123
MLS# 12601435Listed by: REALTY OF AMERICA - New
 $675,000Active5 beds 5 baths4,170 sq. ft.
N535 Charlotte Drive, Geneva, IL 60134
MLS# 12601478Listed by: KELLER WILLIAMS INSPIRE - GENEVA - New
 $289,900Active2 beds 2 baths1,324 sq. ft.
2666 Loren Court #2666, Algonquin, IL 60102
MLS# 12568964Listed by: BERKSHIRE HATHAWAY HOMESERVICES STARCK REAL ESTATE - Open Sat, 1 to 3pmNew
 $595,000Active4 beds 4 baths2,748 sq. ft.
1167 Kingsley Lane, Aurora, IL 60505
MLS# 12592759Listed by: @PROPERTIES CHRISTIES INTERNATIONAL REAL ESTATE - New
 $329,896Active2 beds 2 baths1,415 sq. ft.
13259 Cedar Crest Lane, Huntley, IL 60142
MLS# 12601414Listed by: GARRY REAL ESTATE  $475,000Pending4 beds 3 baths2,025 sq. ft.
701 Lindsay Lane, West Dundee, IL 60118
MLS# 12594710Listed by: RE/MAX HORIZON- New
 $649,900Active4 beds 3 baths2,767 sq. ft.
2685 Cedar Avenue, Geneva, IL 60134
MLS# 12582152Listed by: PAPER PLANE REALTY 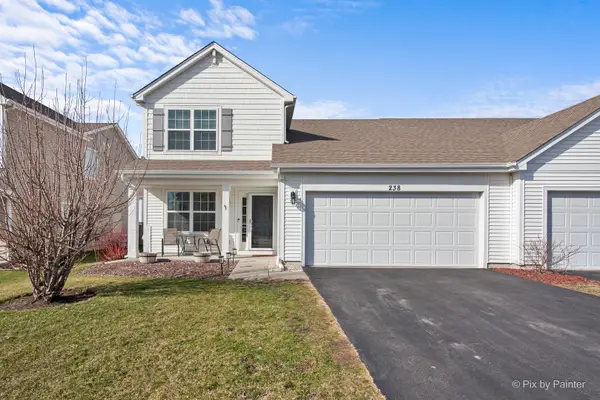 $340,000Pending3 beds 3 baths1,836 sq. ft.
238 Norfolk Lane, Pingree Grove, IL 60140
MLS# 12599144Listed by: RE/MAX ALL PRO $559,900Pending4 beds 4 baths2,886 sq. ft.
313 Monument Road, Elgin, IL 60124
MLS# 12600064Listed by: RE/MAX OF NAPERVILLE- New
 $314,900Active2 beds 3 baths1,830 sq. ft.
136 Durango Drive, Gilberts, IL 60136
MLS# 12597398Listed by: COLDWELL BANKER REALTY - New
 $300,000Active3 beds 2 baths1,454 sq. ft.
10 S Grant Street, North Aurora, IL 60542
MLS# 12595750Listed by: FOX VALLEY REAL ESTATE - New
 $350,000Active4 beds 3 baths1,287 sq. ft.
423 S Main Street S, Montgomery, IL 60538
MLS# 12599807Listed by: W R FOLEY - New
 $560,000Active4 beds 4 baths3,225 sq. ft.
151 Charleston Lane W, Gilberts, IL 60136
MLS# 12601143Listed by: REALTY EXECUTIVES ADVANCE - New
 $659,900Active4 beds 3 baths2,544 sq. ft.
39W844 Carl Sandburg Road, St. Charles, IL 60175
MLS# 12564908Listed by: KELLER WILLIAMS INSPIRE - GENEVA - New
 $2,590,000Active5 beds 7 baths9,126 sq. ft.
39W431 Long Meadow Lane, St. Charles, IL 60175
MLS# 12592608Listed by: CENTURY 21 NEW HERITAGE WEST - New
 $664,900Active4 beds 3 baths2,680 sq. ft.
823 Columbia Circle, North Aurora, IL 60542
MLS# 12601466Listed by: INFINITI PROPERTIES, INC. - New
 $314,990Active2 beds 3 baths1,579 sq. ft.
1395 Oakfield Lane, Pingree Grove, IL 60140
MLS# 12600719Listed by: DAYNAE GAUDIO  $250,000Pending3 beds 2 baths1,380 sq. ft.
1719 Ravine Park Lane, Aurora, IL 60504
MLS# 12598927Listed by: KELLER WILLIAMS INFINITY- New
 $310,000Active3 beds 3 baths1,756 sq. ft.
818 Briar Glen Court, Hampshire, IL 60140
MLS# 12599115Listed by: FLATLAND HOMES, LTD - New
 $320,000Active3 beds 2 baths1,108 sq. ft.
8 S Commonwealth Avenue, Aurora, IL 60506
MLS# 12589024Listed by: COLDWELL BANKER REAL ESTATE GROUP  $600,000Pending4 beds 3 baths2,388 sq. ft.
1905 Allen Drive, Geneva, IL 60134
MLS# 12599133Listed by: COMPASS $266,900Pending5 beds 2 baths1,485 sq. ft.
913 Superior Street, Aurora, IL 60505
MLS# 12599288Listed by: LOMITAS REAL ESTATE $226,800Pending3 beds 2 baths1,162 sq. ft.
339 Hartman Court, South Elgin, IL 60177
MLS# 12515829Listed by: REALHOME SERVICES & SOLUTIONS, INC. $525,000Pending5 beds 3 baths2,900 sq. ft.
39W700 Green Place, Geneva, IL 60134
MLS# 12598399Listed by: HEARTH & HOME REAL ESTATE LLC- New
 $500,000Active3 beds 2 baths1,958 sq. ft.
243 Durham Street, North Aurora, IL 60542
MLS# 12600192Listed by: RE/MAX ALL PRO - ST CHARLES - New
 $300,000Active3 beds 2 baths
315 Thornwood Way #B, South Elgin, IL 60177
MLS# 12598267Listed by: KELLER WILLIAMS ONECHICAGO - New
 $299,900Active4 beds 1 baths
29 N Green Street, Carpentersville, IL 60110
MLS# 12599559Listed by: O'NEIL PROPERTY GROUP, LLC - New
 $799,000Active4 beds 3 baths2,510 sq. ft.
18N988 Angelina Place, Algonquin, IL 60102
MLS# 12599824Listed by: BAIRD & WARNER - New
 $580,000Active4 beds 3 baths3,347 sq. ft.
3004 Crossfire Trail, Elgin, IL 60124
MLS# 12590059Listed by: BAIRD & WARNER FOX VALLEY - GENEVA  $239,000Pending3 beds 1 baths
3 S South Elgin Boulevard, South Elgin, IL 60177
MLS# 12599986Listed by: 103 REALTY- New
 $550,000Active4 beds 3 baths2,184 sq. ft.
3218 Blackhawk Trail, St. Charles, IL 60174
MLS# 12599100Listed by: HOMESMART CONNECT LLC - New
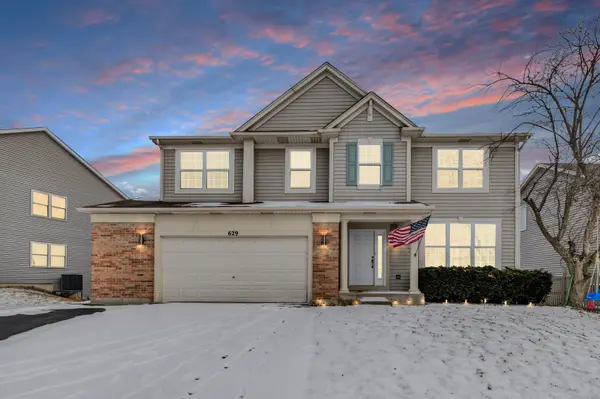 $574,500Active6 beds 5 baths4,240 sq. ft.
629 Waterford Lane, South Elgin, IL 60177
MLS# 12599949Listed by: HOMESMART CONNECT LLC - New
 $509,900Active6 beds 4 baths
408 E Chicago Street, Elgin, IL 60120
MLS# 12598511Listed by: REALTY OF AMERICA, LLC - New
 $276,900Active2 beds 2 baths1,133 sq. ft.
1633 Pebble Beach Circle, Elgin, IL 60123
MLS# 12598065Listed by: GREAT HOMES REAL ESTATE, INC. - New
 $335,000Active2 beds 2 baths1,564 sq. ft.
12178 White Tail Lane, Huntley, IL 60142
MLS# 12573403Listed by: KELLER WILLIAMS SUCCESS REALTY - New
 $525,000Active4 beds 3 baths2,273 sq. ft.
254 Landfield Road, Batavia, IL 60510
MLS# 12595239Listed by: GRANDVIEW REALTY, LLC - New
 $479,900Active2 beds 2 baths1,807 sq. ft.
1151 Barkston Lane, Aurora, IL 60502
MLS# 12588875Listed by: CENTURY 21 INTEGRA - New
 $65,000Active2 beds 1 baths
1336 Douglas Avenue #4, Montgomery, IL 60538
MLS# 12599219Listed by: CENTURY 21 CIRCLE - AURORA  $1,050,000Pending5 beds 5 baths7,245 sq. ft.
5N523 E Lakeview Circle, St. Charles, IL 60175
MLS# 12570606Listed by: REMAX LEGENDS $610,325Pending4 beds 3 baths2,536 sq. ft.
571 Lismore Circle, Elgin, IL 60124
MLS# 12599307Listed by: HOMESMART CONNECT LLC $560,000Pending4 beds 3 baths2,648 sq. ft.
585 Lismore Circle, Elgin, IL 60124
MLS# 12599349Listed by: HOMESMART CONNECT LLC- New
 $385,000Active3 beds 3 baths
273 Bastian Drive, Sugar Grove, IL 60554
MLS# 12599295Listed by: LEGACY PROPERTIES  $576,990Pending4 beds 3 baths2,662 sq. ft.
581 Lismore Circle, Elgin, IL 60124
MLS# 12599373Listed by: HOMESMART CONNECT LLC $443,541Pending3 beds 2 baths1,965 sq. ft.
411 S Constitution Drive, Aurora, IL 60506
MLS# 12599205Listed by: HOMESMART CONNECT LLC- New
 $1,150,000Active5 beds 6 baths8,399 sq. ft.
4206 Royal Fox Drive, St. Charles, IL 60174
MLS# 12525257Listed by: RE/MAX ALL PRO - ST CHARLES - New
 $1,350,000Active4 beds 6 baths5,143 sq. ft.
41W219 Forest Lane, Elburn, IL 60119
MLS# 12598999Listed by: THE HOMECOURT REAL ESTATE - New
 $450,000Active3 beds 3 baths3,339 sq. ft.
740 Manor Hill Place, Sugar Grove, IL 60554
MLS# 12599053Listed by: KELLER WILLIAMS PREMIERE PROPERTIES  $404,999Pending3 beds 3 baths2,221 sq. ft.
325 Settlers Place, West Dundee, IL 60118
MLS# 12598959Listed by: HOMESMART CONNECT LLC $421,490Pending3 beds 3 baths1,840 sq. ft.
810 Lindsay Lane, West Dundee, IL 60118
MLS# 12598984Listed by: HOMESMART CONNECT LLC $738,860Pending4 beds 4 baths3,876 sq. ft.
1857 Diamond Drive, Elgin, IL 60124
MLS# 12599038Listed by: HOMESMART CONNECT LLC- New
 $370,000Active3 beds 3 baths1,756 sq. ft.
3825 Honeysuckle Lane, Elgin, IL 60124
MLS# 12598893Listed by: KELLER WILLIAMS INFINITY - New
 $659,900Active5 beds 3 baths3,084 sq. ft.
Address Withheld By Seller, South Elgin, IL 60177
MLS# 12585516Listed by: ARNI REALTY INCORPORATED - New
 $65,000Active0.26 Acres
19 N Lincoln Avenue, Carpentersville, IL 60110
MLS# 12598869Listed by: CHARLES RUTENBERG REALTY OF IL  $709,900Pending5 beds 4 baths2,975 sq. ft.
39W228 W Hilltop Drive, St. Charles, IL 60175
MLS# 12598516Listed by: ONE SOURCE REALTY $349,000Pending2 beds 2 baths1,700 sq. ft.
1630 Raymond Street, South Elgin, IL 60177
MLS# 12598387Listed by: GRAFF REALTY- New
 $299,000Active4 beds 3 baths
133 Oak Street, Elgin, IL 60123
MLS# 12598373Listed by: EXCLUSIVE LIVING, INC - New
 $799,000Active4 beds 4 baths3,467 sq. ft.
980 Persimmon Court, St. Charles, IL 60174
MLS# 12505710Listed by: RE/MAX ALL PRO - ST CHARLES 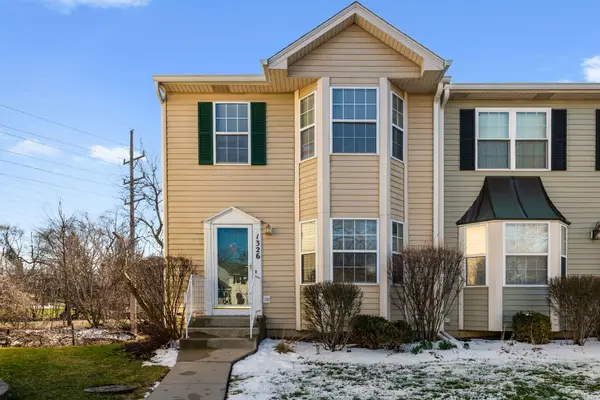 $320,000Pending2 beds 4 baths1,447 sq. ft.
1326 Windsor Court, Geneva, IL 60134
MLS# 12593516Listed by: BERKSHIRE HATHAWAY HOMESERVICES STARCK REAL ESTATE $279,000Pending2 beds 2 baths1,127 sq. ft.
408 Bowen Court, Elgin, IL 60120
MLS# 12567652Listed by: SUBURBAN LIFE REALTY, LTD- New
 $489,000Active4 beds 3 baths2,799 sq. ft.
707 Brighton Drive, Pingree Grove, IL 60140
MLS# 12598529Listed by: ILLINOIS STAR, LTD. REALTORS  $1,800,000Pending4 beds 4 baths7,000 sq. ft.
39W354 Long Meadow Lane, St. Charles, IL 60175
MLS# 12598526Listed by: REALTY EXECUTIVES ADVANCE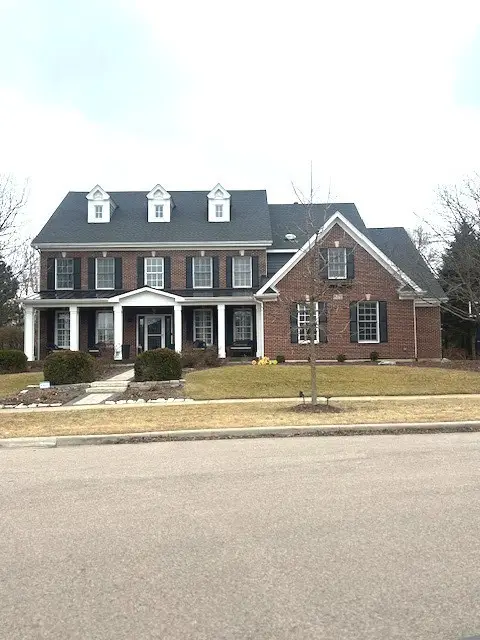 $949,000Pending5 beds 5 baths5,955 sq. ft.
Address Withheld By Seller, Batavia, IL 60510
MLS# 12574469Listed by: REALSTAR REALTY, INC $699,000Pending4 beds 3 baths3,006 sq. ft.
564 Thorne Street, Batavia, IL 60510
MLS# 12598495Listed by: KELLER WILLIAMS INFINITY $775,000Pending4 beds 3 baths2,548 sq. ft.
909 King Edward Avenue, St. Charles, IL 60174
MLS# 12591413Listed by: BAIRD & WARNER- New
 $610,000Active3 beds 2 baths2,467 sq. ft.
12830 Crestview Drive, Huntley, IL 60142
MLS# 12579631Listed by: CENTURY 21 CIRCLE  $339,900Pending3 beds 2 baths1,827 sq. ft.
2134 Aberdeen Drive, Carpentersville, IL 60110
MLS# 12598344Listed by: REALTY OF AMERICA, LLC $499,900Pending3 beds 3 baths2,370 sq. ft.
1011 Napa Lane, Aurora, IL 60502
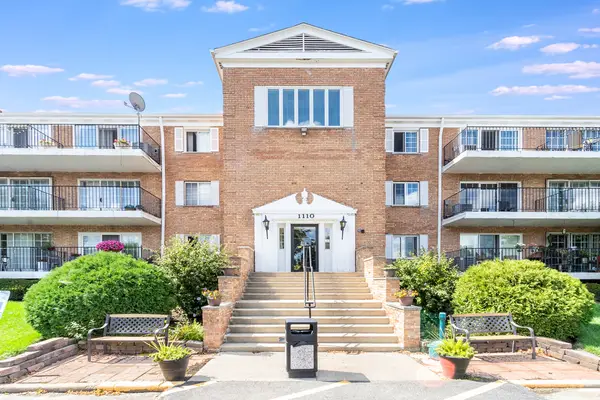
MLS# 12597207Listed by: HOMESMART REALTY GROUP $202,500Pending3 beds 2 baths1,344 sq. ft.
1110 N Farnsworth Avenue #213, Aurora, IL 60505
MLS# 12591769Listed by: HAPPY LIVING REALTY- New
 $545,000Active4 beds 3 baths2,990 sq. ft.
8 Heaton Court, Sugar Grove, IL 60554
MLS# 12598226Listed by: COMPASS - New
 $890,000Active5 beds 5 baths4,480 sq. ft.
10N749 Highland Trail, Hampshire, IL 60140
MLS# 12588856Listed by: Y REALTY  $385,000Pending3 beds 2 baths1,540 sq. ft.
622 Spring Street, Batavia, IL 60510
MLS# 12589620Listed by: CENTURY 21 CIRCLE - AURORA- New
 $479,900Active4 beds 4 baths2,101 sq. ft.
19N963 Manito Trail, Algonquin, IL 60102
MLS# 12565420Listed by: UNIVERSAL REAL ESTATE LLC - New
 $454,900Active3 beds 4 baths2,717 sq. ft.
1159 Falcon Ridge Drive, Elgin, IL 60124
MLS# 12595342Listed by: COLDWELL BANKER REALTY  $490,000Pending4 beds 3 baths2,800 sq. ft.
510 Golden Valley Lane, Algonquin, IL 60102
MLS# 12598150Listed by: CHICAGOLAND BROKERS INC.- New
 $585,000Active5 beds 3 baths3,874 sq. ft.
601 Meade Boulevard, North Aurora, IL 60542
MLS# 12568241Listed by: KELLER WILLIAMS INSPIRE - GENEVA  $359,999Pending3 beds 3 baths1,764 sq. ft.
327 Settlers Place, West Dundee, IL 60118
MLS# 12597711Listed by: HOMESMART CONNECT LLC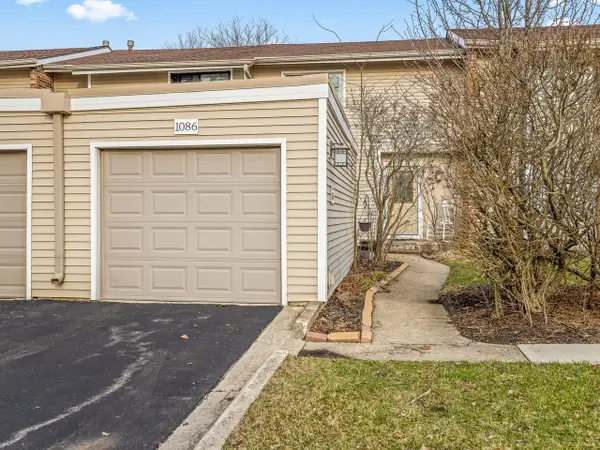 $279,500Pending3 beds 3 baths1,206 sq. ft.
1086 Cascade Drive, Aurora, IL 60506
MLS# 12597662Listed by: BEST REALTY $600,000Pending5 beds 4 baths2,252 sq. ft.
Address Withheld By Seller, Batavia, IL 60510
MLS# 12588075Listed by: COLDWELL BANKER REAL ESTATE GROUP- New
 $415,000Active3 beds 3 baths1,725 sq. ft.
1475 Misthaven Lane, Elgin, IL 60123
MLS# 12598017Listed by: A SQUARED REALTY LLC  $450,000Pending4 beds 3 baths1,800 sq. ft.
1031 N Spring Street, Elgin, IL 60120
MLS# 12593909Listed by: @PROPERTIES CHRISTIE'S INTERNATIONAL REAL ESTATE $349,975Pending3 beds 2 baths1,773 sq. ft.
505 Mosedale Street, St. Charles, IL 60174
MLS# 12596359Listed by: HOMETOWN REALTY GROUP $268,000Pending3 beds 2 baths1,344 sq. ft.
Address Withheld By Seller, Elgin, IL 60120
MLS# 12552551Listed by: REAL PEOPLE REALTY $394,000Pending3 beds 2 baths1,343 sq. ft.
3001 Solitude Lane, Aurora, IL 60502
MLS# 12592090Listed by: THE HOMECOURT REAL ESTATE- New
 $279,900Active3 beds 2 baths
1428 Meadowsedge Lane, Carpentersville, IL 60110
MLS# 12597824Listed by: O'NEIL PROPERTY GROUP, LLC - New
 $450,000Active3 beds 3 baths1,762 sq. ft.
321 Jake Lane, Hampshire, IL 60140
MLS# 12587836Listed by: BAIRD & WARNER  $299,000Pending3 beds 3 baths1,542 sq. ft.
2375 Cove Court, Elgin, IL 60123
MLS# 12591952Listed by: HOMEONE REAL ESTATE, INC.- New
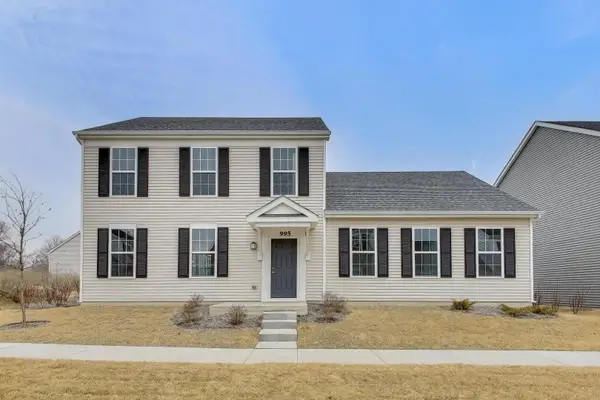 $409,680Active4 beds 4 baths2,040 sq. ft.
995 Celebration Drive, Aurora, IL 60504
MLS# 12597720Listed by: PREMIER AGENT NETWORK ILLINOIS, LLC - New
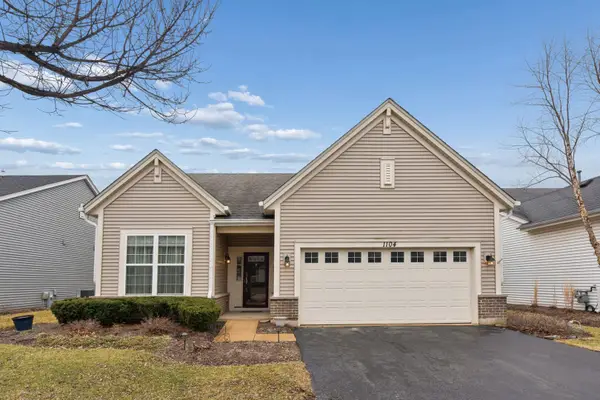 $475,000Active2 beds 2 baths1,866 sq. ft.
1104 Heathrow Lane, Aurora, IL 60502
MLS# 12576903Listed by: COLDWELL BANKER REALTY - New
 $550,000Active4 beds 3 baths3,700 sq. ft.
82 Brentwood Drive, Gilberts, IL 60136
MLS# 12581011Listed by: BAIRD & WARNER REAL ESTATE - A - New
 $500,000Active4 beds 3 baths4,361 sq. ft.
1107 Pember Circle, West Dundee, IL 60118
MLS# 12597532Listed by: RE/MAX ALL PRO - ST CHARLES - New
 $248,000Active3 beds 1 baths1,540 sq. ft.
711 Bluff City Boulevard, Elgin, IL 60120
MLS# 12591553Listed by: BERKSHIRE HATHAWAY HOMESERVICES STARCK REAL ESTATE - New
 $619,900Active4 beds 4 baths2,436 sq. ft.
4N752 Brookside West Drive, St. Charles, IL 60175
MLS# 12593841Listed by: REALTY EXECUTIVES PREMIER ILLINOIS - New
 $639,900Active4 beds 3 baths3,229 sq. ft.
1403 Karen Drive, West Dundee, IL 60118
MLS# 12597142Listed by: FIVE STAR REALTY, INC - New
 $299,999Active2 beds 3 baths1,292 sq. ft.
740 Florence Street, Hampshire, IL 60140
MLS# 12597174Listed by: KELLER WILLIAMS PREMIERE PROPERTIES - New
 $479,900Active3 beds 3 baths2,750 sq. ft.
3694 Reddington Circle, Elgin, IL 60124
MLS# 12597454Listed by: UNITED REAL ESTATE - CHICAGO  $419,888Pending3 beds 3 baths1,805 sq. ft.
907 Thornwood Court #2, St. Charles, IL 60174
MLS# 12582023Listed by: COLDWELL BANKER REALTY- New
 $599,900Active4 beds 3 baths3,707 sq. ft.
217 Sunbury Drive, St. Charles, IL 60175
MLS# 12593961Listed by: PAK HOME REALTY - New
 $119,000Active2 beds 2 baths975 sq. ft.
801 N Mclean Boulevard #124, Elgin, IL 60123
MLS# 12596918Listed by: REAL BROKER, LLC - New
 $375,000Active3 beds 3 baths1,764 sq. ft.
1004 Atterberg Road, South Elgin, IL 60177
MLS# 12597307Listed by: REDFIN CORPORATION - New
 $309,990Active2 beds 3 baths1,579 sq. ft.
1403 Oakfield Lane, Pingree Grove, IL 60140
MLS# 12597260Listed by: DAYNAE GAUDIO - New
 $650,000Active3 beds 2 baths1,840 sq. ft.
2300 Kaneville Road, Geneva, IL 60134
MLS# 12585349Listed by: BAIRD & WARNER FOX VALLEY - GENEVA - New
 $330,000Active2 beds 2 baths1,360 sq. ft.
1175 Sonoma Court, Pingree Grove, IL 60140
MLS# 12597244Listed by: RE/MAX OF NAPERVILLE - New
 $619,990Active4 beds 3 baths2,833 sq. ft.
3803 Ivy Lane, Elgin, IL 60124
MLS# 12581832Listed by: KELLER WILLIAMS INFINITY  $649,900Pending4 beds 3 baths2,940 sq. ft.
526 Windett Lane, Geneva, IL 60134
MLS# 12588509Listed by: PATRICK R. E. GROUP OF IL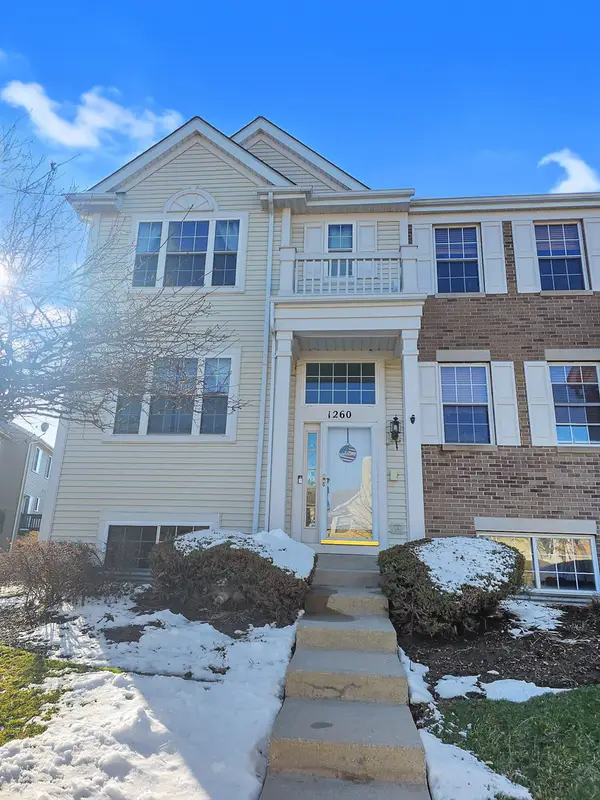 $305,000Pending3 beds 3 baths1,757 sq. ft.
1260 Derry Lane, Pingree Grove, IL 60140
MLS# 12596034Listed by: KELLER WILLIAMS INSPIRE $299,900Pending3 beds 1 baths1,176 sq. ft.
521 Spring Avenue, South Elgin, IL 60177
MLS# 12596618Listed by: CIRCLE ONE REALTY- New
 $139,000Active1 beds 1 baths750 sq. ft.
1110 N Farnsworth Avenue #211, Aurora, IL 60505
MLS# 12596211Listed by: RE/MAX PROFESSIONALS SELECT - New
 $539,999Active4 beds 3 baths2,405 sq. ft.
408 Fountain Avenue, Elgin, IL 60124
MLS# 12597108Listed by: REALTY OF AMERICA, LLC  $324,900Pending3 beds 2 baths1,758 sq. ft.
1421 Heather Drive, Aurora, IL 60506
MLS# 12597137Listed by: MONARCH REALTY $425,000Pending3 beds 3 baths1,744 sq. ft.
3770 Westbury Court, Elgin, IL 60124
MLS# 12573498Listed by: KELLER WILLIAMS INSPIRE - GENEVA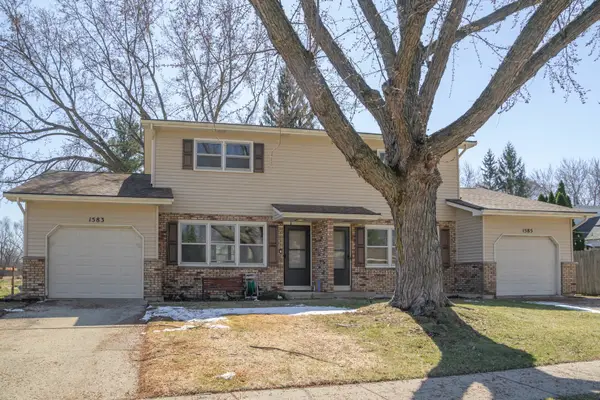 $489,900Pending6 beds 4 baths
1583-1585 Sheffield Drive, Elgin, IL 60123
MLS# 12595218Listed by: COMPASS $435,900Pending4 beds 3 baths1,865 sq. ft.
1121 Independence Avenue, St. Charles, IL 60174
MLS# 12418732Listed by: EXP REALTY $365,000Pending4 beds 2 baths2,118 sq. ft.
1455 Erie Street, Elgin, IL 60123
MLS# 12595767Listed by: KELLER WILLIAMS THRIVE $515,000Pending4 beds 3 baths2,672 sq. ft.
1850 White Oak Drive, Algonquin, IL 60102
MLS# 12591571Listed by: BAIRD & WARNER $334,900Pending3 beds 3 baths1,628 sq. ft.
71 Melrose Court, South Elgin, IL 60177
MLS# 12591638Listed by: JOHN GREENE, REALTOR $429,900Pending3 beds 3 baths1,722 sq. ft.
1865 Kevin Avenue, Elgin, IL 60123
MLS# 12593592Listed by: PREMIER LIVING PROPERTIES $425,000Pending4 beds 4 baths1,710 sq. ft.
1480 Colorado Avenue, Aurora, IL 60506
MLS# 12593711Listed by: JOHN GREENE, REALTOR- New
 $325,000Active2 beds 3 baths2,000 sq. ft.
2490 Anna Way, Elgin, IL 60124
MLS# 12595355Listed by: WISTERIA REAL ESTATE LLC  $299,900Pending2 beds 3 baths1,600 sq. ft.
6508 Marble Lane, Carpentersville, IL 60110
MLS# 12596482Listed by: HOMESMART CONNECT LLC $390,000Pending3 beds 2 baths
1160-62 N Ohio Street N, Aurora, IL 60505
MLS# 12596755Listed by: KELLER WILLIAMS INFINITY- New
 $429,900Active2 beds 2 baths1,541 sq. ft.
1237 Marigold Lane, Hampshire, IL 60140
MLS# 12596851Listed by: RE/MAX HORIZON - New
 $499,900Active6 beds 3 baths3,118 sq. ft.
1022 Rosewood Drive, Carpentersville, IL 60110
MLS# 12596957Listed by: EPIQUE REALTY INC - New
 $399,000Active3 beds 4 baths1,764 sq. ft.
532 Shenandoah Trail, Elgin, IL 60123
MLS# 12596982Listed by: @PROPERTIES CHRISTIE'S INTERNATIONAL REAL ESTATE  $1,450,000Pending5 beds 5 baths7,971 sq. ft.
6N499 Brookhaven Lane, St. Charles, IL 60175
MLS# 12580711Listed by: @PROPERTIES CHRISTIE'S INTERNATIONAL REAL ESTATE- New
 $514,900Active3 beds 2 baths2,090 sq. ft.
1515 Prairie Street, Aurora, IL 60506
MLS# 12581912Listed by: JOHN GREENE, REALTOR  $599,000Pending4 beds 3 baths2,020 sq. ft.
11N215 Capulet Circle, Elgin, IL 60124
MLS# 12583028Listed by: UNITED REAL ESTATE - CHICAGO $475,000Pending3 beds 3 baths3,600 sq. ft.
1335 Deerpath Road, Aurora, IL 60506
MLS# 12594731Listed by: LEGACY PROPERTIES, A SARAH LEONARD COMPANY, LLC- New
 $294,900Active2 beds 2 baths1,289 sq. ft.
910 Thornwood Drive #910, St. Charles, IL 60174
MLS# 12575346Listed by: BERKSHIRE HATHAWAY HOMESERVICES STARCK REAL ESTATE - New
 $209,900Active2 beds 1 baths1,164 sq. ft.
565 Dean Drive #F, South Elgin, IL 60177
MLS# 12601947Listed by: RE/MAX ALL PRO - ST CHARLES - New
 $629,900Active4 beds 3 baths
9N930 Koshare Circle, Elgin, IL 60124
MLS# 12450582Listed by: BAIRD & WARNER  $590,000Pending4 beds 3 baths2,633 sq. ft.
39W553 N Hyde Park, Geneva, IL 60134
MLS# 12579947Listed by: HOMESMART CONNECT LLC $435,000Pending3 beds 2 baths1,808 sq. ft.
915 Willow Lane, Sleepy Hollow, IL 60118
MLS# 12587564Listed by: COMPASS- New
 $285,000Active2 beds 10 baths909 sq. ft.
306 Johnson Street, East Dundee, IL 60118
MLS# 12588547Listed by: COMPASS  $675,000Pending5 beds 5 baths3,735 sq. ft.
843 Verona Ridge Drive, Aurora, IL 60506
MLS# 12588733Listed by: STOLL REAL ESTATE $285,000Pending4 beds 3 baths1,223 sq. ft.
367 Stonington Place #367, South Elgin, IL 60177
MLS# 12594742Listed by: COLDWELL BANKER REALTY $374,900Pending3 beds 2 baths1,383 sq. ft.
620 S 9th Avenue, St. Charles, IL 60174
MLS# 12586593Listed by: RE/MAX ALL PRO - ST CHARLES $359,900Pending3 beds 3 baths1,790 sq. ft.
2487 Fox Drive, Aurora, IL 60506
MLS# 12590825Listed by: RE/MAX ALL PRO - ST CHARLES $339,000Pending3 beds 3 baths1,368 sq. ft.
645 E State Street, South Elgin, IL 60177
MLS# 12594188Listed by: @PROPERTIES CHRISTIE'S INTERNATIONAL REAL ESTATE $350,000Pending2 beds 2 baths1,578 sq. ft.
1355 Georgetown Drive #3, Batavia, IL 60510
MLS# 12425246Listed by: KELLER WILLIAMS INSPIRE - GENEVA- New
 $519,000Active5 beds 4 baths2,922 sq. ft.
800 Boyce Road, Sugar Grove, IL 60554
MLS# 12588569Listed by: KELLER WILLIAMS INFINITY  $418,900Pending3 beds 3 baths1,840 sq. ft.
1011 Shagbark Lane, West Dundee, IL 60118
MLS# 12596408Listed by: HOMESMART CONNECT LLC $310,000Pending3 beds 3 baths1,800 sq. ft.
43 Creekside Circle, Elgin, IL 60123
MLS# 12584369Listed by: REDFIN CORPORATION
Local realty services provided by:CENTURY 21 New Heritage
Copyright 2026 Midwest Real Estate Data LLC. All rights reserved. The data relating to real estate for sale on this web site comes in part from the Broker Reciprocity Program of the Midwest Real Estate Data LLC. Listing information is deemed reliable but not guaranteed.
Popular searches near Kane County, IL
Popular neighborhoods near Kane County, IL
- Big Woods Marmion, Aurora homes for sale
- Blackberry Countryside, Aurora homes for sale
- Blackhawk, Aurora homes for sale
- Cambridge Lakes, Pingree Grove homes for sale
- Century Oaks West, Elgin homes for sale
- Cobblers Crossing, Elgin homes for sale
- Edgelawn Randall, Aurora homes for sale
- Eola Yards, Aurora homes for sale
- Indian Creek, Aurora homes for sale
- Light of the Community, Aurora homes for sale
- McCarty Burlington, Aurora homes for sale
- Near West Galena, Aurora homes for sale
- North River, Aurora homes for sale
- Pigeon Hill, Aurora homes for sale
- Providence, Elgin homes for sale
- South End, Aurora homes for sale
- Stonebridge, Aurora homes for sale
- The Villas of Gleneagle Farm, Carpentersville homes for sale
- University Neighbors, Aurora homes for sale
- Woodgate of Sycamore, Sycamore homes for sale
Zip codes near Kane County, IL
- 60103 homes for sale
- 60112 homes for sale
- 60118 homes for sale
- 60119 homes for sale
- 60120 homes for sale
- 60123 homes for sale
- 60124 homes for sale
- 60134 homes for sale
- 60136 homes for sale
- 60140 homes for sale
- 60151 homes for sale
- 60174 homes for sale
- 60175 homes for sale
- 60177 homes for sale
- 60184 homes for sale
- 60185 homes for sale
- 60506 homes for sale
- 60510 homes for sale
- 60542 homes for sale
- 60554 homes for sale
Protect your home and budget from life's surprises with an Assurant Home Warranty, backed by a partner that supports you through every step of homeownership. Explore Plans.
©2026 Century 21 Real Estate LLC. All rights reserved. CENTURY 21®, the CENTURY 21 Logo and C21® are service marks owned by Century 21 Real Estate LLC. Century 21 Real Estate LLC fully supports the principles of the Fair Housing Act and the Equal Opportunity Act. Each office is independently owned and operated. Listing information is deemed reliable but not guaranteed accurate.