- Aurora, Barlow homes for sale
- Bull Mountain, Bull Mountain homes for sale
- Byrom, Tualatin homes for sale
- Charbonneau, Wilsonville homes for sale
- Cooper Mountain - Aloha South, Beaverton homes for sale
- Cornelius, Hillsboro homes for sale
- Fern Hill, Cornelius homes for sale
- Ibach, Tualatin homes for sale
- Keizer, Salem homes for sale
- Ladd Hill, Wilsonville homes for sale
- Laurel, Hillsboro homes for sale
- McNary Estates, Salem homes for sale
- Midwest, Tualatin homes for sale
- Neighbors Southwest, Beaverton homes for sale
- Northgate, Salem homes for sale
- River Terrace, Tigard homes for sale
- Sherwood-Tualatin, Sherwood homes for sale
- West Tigard, Bull Mountain homes for sale
- Wilsonville, Wilsonville homes for sale
- Woodburn Senior Estates, Woodburn homes for sale
Lafayette, OR - homes for sale
43 of 43 results displayed
- New
 $474,900Active2 beds 2 baths1,306 sq. ft.
1534 N Young St, Lafayette, OR 97127
MLS# 564620867Listed by: LENNAR SALES CORP
 $515,000Pending3 beds 2 baths1,904 sq. ft.
1115 7th Street Ext, Lafayette, OR 97127
MLS# 207028520Listed by: FRESH REAL ESTATE CO LLC- New
 $399,000Active3 beds 2 baths1,280 sq. ft.
253 E 7th St, Lafayette, OR 97127
MLS# 166740825Listed by: CONGRESS REALTY  $510,000Active3 beds 3 baths2,700 sq. ft.
532 E Water St, Lafayette, OR 97127
MLS# 136010961Listed by: BELLA CASA REAL ESTATE GROUP $435,000Active3 beds 2 baths1,311 sq. ft.
1235 Crystal Ln, Lafayette, OR 97127
MLS# 548012647Listed by: HEART AND HOMES NW, LLC $487,400Active3 beds 3 baths1,766 sq. ft.
1624 N Young St, Lafayette, OR 97127
MLS# 672770889Listed by: LENNAR SALES CORP $475,900Pending2 beds 2 baths1,306 sq. ft.
1514 N Young St, Lafayette, OR 97127
MLS# 126796656Listed by: LENNAR SALES CORP $504,900Active3 beds 2 baths1,495 sq. ft.
1544 N Young St, Lafayette, OR 97127
MLS# 538099371Listed by: LENNAR SALES CORP $416,000Pending3 beds 2 baths1,263 sq. ft.
1008 Grant St, Lafayette, OR 97127
MLS# 477640351Listed by: BELLA CASA REAL ESTATE GROUP $415,000Active2 beds 2 baths1,368 sq. ft.
287 Canyon View Dr, Lafayette, OR 97127
MLS# 551484285Listed by: KELLER WILLIAMS REALTY PORTLAND PREMIERE $439,000Active4 beds 2 baths1,598 sq. ft.
1115 E 11th St, Lafayette, OR 97127
MLS# 485509841Listed by: ALL PROFESSIONALS REAL ESTATE $399,900Pending3 beds 2 baths1,226 sq. ft.
147 E 8th St, Lafayette, OR 97127
MLS# 250118947Listed by: CASCADE HASSON SOTHEBY'S INTERNATIONAL REALTY $399,900Active3 beds 2 baths1,348 sq. ft.
280 E 6th St, Lafayette, OR 97127
MLS# 298555113Listed by: REDFIN $175,000Active0.23 Acres
755 7th Street Ext, Lafayette, OR 97127
MLS# 562434826Listed by: WILLCUTS COMPANY REAL ESTATE $474,900Active3 beds 2 baths1,530 sq. ft.
841 12th St, Lafayette, OR 97127
MLS# 339457180Listed by: EXP REALTY, LLC $649,000Active4 beds 3 baths3,058 sq. ft.
559 E 16th St, Lafayette, OR 97127
MLS# 722888128Listed by: PREMIERE PROPERTY GROUP, LLC $635,000Active4 beds 3 baths2,321 sq. ft.
291 W 17th St, Lafayette, OR 97127
MLS# 236663807Listed by: KELLER WILLIAMS REALTY PORTLAND PREMIERE $699,000Active3 beds 3 baths2,619 sq. ft.
210 W 8th St, Lafayette, OR 97127
MLS# 171127747Listed by: WILLCUTS COMPANY REAL ESTATE $548,500Active4 beds 3 baths2,349 sq. ft.
918 E 16th St, Lafayette, OR 97127
MLS# 513191695Listed by: RE/MAX EQUITY GROUP $410,000Active3 beds 2 baths1,262 sq. ft.
834 Grant St, Lafayette, OR 97127
MLS# 659250706Listed by: JOHN L. SCOTT MARKET CENTER $480,000Active3 beds 2 baths1,437 sq. ft.
928 E 16th St, Lafayette, OR 97127
MLS# 165250277Listed by: REALTYNET, LLC $455,000Active3 beds 3 baths1,800 sq. ft.
310 W 13th St, Lafayette, OR 97127
MLS# 353036573Listed by: MORE REALTY $444,900Active3 beds 2 baths1,315 sq. ft.
234 W 18th St, Lafayette, OR 97127
MLS# 405109682Listed by: REALTY FIRST $609,000Active4 beds 3 baths2,260 sq. ft.
1746 N Millican Creek St, Lafayette, OR 97127
MLS# 723911199Listed by: KNIPE REALTY ERA POWERED $589,500Active5 beds 3 baths2,366 sq. ft.
1722 N Kalapuya Pl, Lafayette, OR 97127
MLS# 201263922Listed by: PREMIERE PROPERTY GROUP, LLC $634,900Active3 beds 2 baths2,374 sq. ft.
221 E 16th St, Lafayette, OR 97127
MLS# 402458021Listed by: REALTY ONE GROUP WILLAMETTE VALLEY $485,000Active3 beds 3 baths1,662 sq. ft.
262 W 17th St, Lafayette, OR 97127
MLS# 532158538Listed by: BERKSHIRE HATHAWAY HOMESERVICES NW REAL ESTATE $529,900Pending3 beds 3 baths2,191 sq. ft.
1713 N Kalapuya Pl, Lafayette, OR 97127
MLS# 491536919Listed by: WILLCUTS COMPANY REAL ESTATE $299,999Active3 beds 2 baths2,280 sq. ft.
1282 E 3rd St #59, Lafayette, OR 97127
MLS# 605137918Listed by: BERKSHIRE HATHAWAY HOMESERVICES NW REAL ESTATE $480,000Active3 beds 3 baths1,868 sq. ft.
1254 Crystal Ln, Lafayette, OR 97127
MLS# 769010414Listed by: PREMIERE PROPERTY GROUP LLC $455,000Active4 beds 2 baths1,676 sq. ft.
847 N Duniway Rd, Lafayette, OR 97127
MLS# 401337723Listed by: JOHN L. SCOTT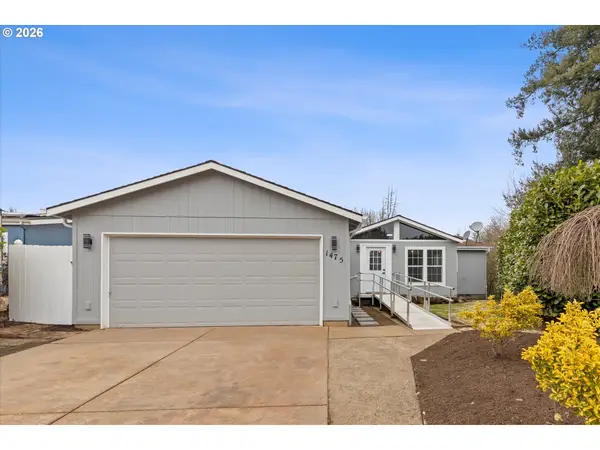 $350,000Active3 beds 2 baths1,296 sq. ft.
1475 Abbey Ln, Lafayette, OR 97127
MLS# 376214058Listed by: COLDWELL BANKER PROFESSIONAL $190,000Active3 beds 2 baths1,782 sq. ft.
1282 E 3rd St #83, Lafayette, OR 97127
MLS# 337023242Listed by: EXP REALTY, LLC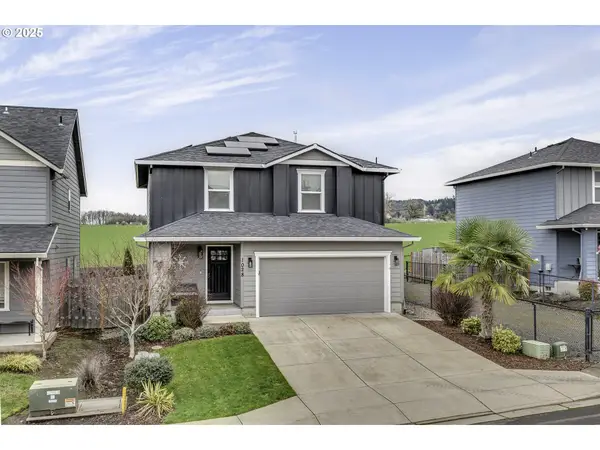 $459,900Pending4 beds 3 baths1,510 sq. ft.
1028 E 16th St, Lafayette, OR 97127
MLS# 155749139Listed by: JOHN L. SCOTT MARKET CENTER $170,000Active0.18 Acres
160 E 7th St, Lafayette, OR 97127
MLS# 635925786Listed by: PREMIERE PROPERTY GROUP, LLC $455,000Active4 beds 3 baths1,729 sq. ft.
967 E 16th St, Lafayette, OR 97127
MLS# 632345386Listed by: KNIPE REALTY ERA POWERED $199,000Active4 beds 2 baths1,782 sq. ft.
1282 E 3rd St #37, Lafayette, OR 97127
MLS# 530898781Listed by: SOLDERA PROPERTIES, INC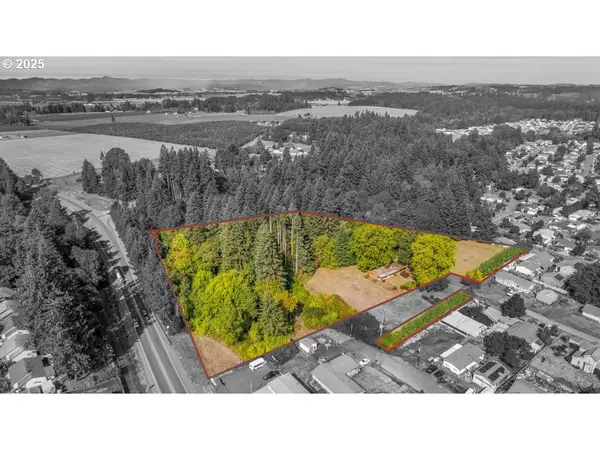 $799,000Active6.47 Acres
215 W 5th St, Lafayette, OR 97127
MLS# 552806676Listed by: NORRIS & STEVENS INVESTMENT REAL ESTATE SERVICES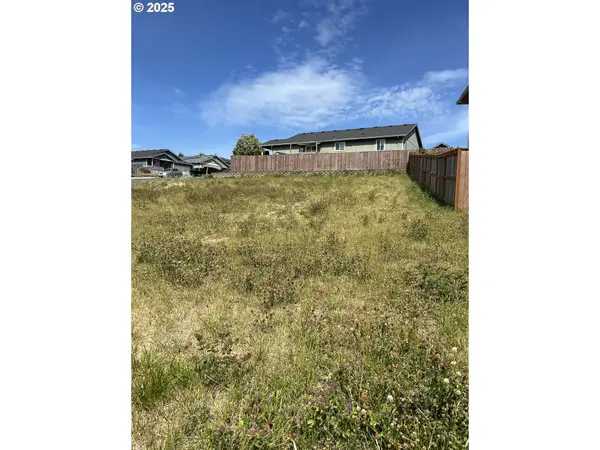 $180,000Active0.18 Acres
1001 E 9th St, Lafayette, OR 97127
MLS# 300638569Listed by: BELLA CASA REAL ESTATE GROUP $515,000Active4 beds 3 baths2,294 sq. ft.
731 N Lincoln St, Lafayette, OR 97127
MLS# 24375472Listed by: EXP REALTY, LLC $449,000Active3 beds 3 baths1,662 sq. ft.
1732 N Kalapuya Pl, Lafayette, OR 97127
MLS# 23404251Listed by: KELLER WILLIAMS REALTY PROFESSIONALS $545,000Active3 beds 3 baths2,466 sq. ft.
634 E 13th Pl, Lafayette, OR 97127
MLS# 23155259Listed by: EXP REALTY, LLC $672,400Active4 beds 3 baths3,091 sq. ft.
1402 N Madison St, Lafayette, OR 97127
MLS# 23336036Listed by: KELLER WILLIAMS SUNSET CORRIDOR
Local realty services provided by:CENTURY 21 Northstar
All information provided is deemed reliable but is not guaranteed and should be independently verified. The content relating to real estate for sale on this web site comes in part from the IDX program of the RMLS of Portland Oregon. Real estate listings held by brokerage firms other than CENTURY 21 Northstar are marked with the RMLS logo and detailed information about these properties includes the names of the listing brokers. Copyright 2026 RMLS, Portland, Oregon. Last updated: February 10, 2024
Neighborhoods near Lafayette, OR
Zip codes near Lafayette, OR
- 97002 homes for sale
- 97007 homes for sale
- 97020 homes for sale
- 97026 homes for sale
- 97032 homes for sale
- 97071 homes for sale
- 97101 homes for sale
- 97111 homes for sale
- 97114 homes for sale
- 97115 homes for sale
- 97123 homes for sale
- 97127 homes for sale
- 97128 homes for sale
- 97132 homes for sale
- 97140 homes for sale
- 97148 homes for sale
- 97303 homes for sale
- 97304 homes for sale
- 97305 homes for sale
- 97378 homes for sale
Popular searches near Lafayette, OR
- Amity homes for sale
- Brooks homes for sale
- Carlton homes for sale
- Chehalem Mountains homes for sale
- Cherry Grove homes for sale
- Dayton homes for sale
- Dayton-Amity homes for sale
- Donald homes for sale
- Dundee homes for sale
- Gaston homes for sale
- Gervais homes for sale
- Hubbard homes for sale
- Keizer homes for sale
- McMinnville homes for sale
- Newberg homes for sale
- Sheridan homes for sale
- Sherwood homes for sale
- Wilsonville homes for sale
- Woodburn homes for sale
- Yamhill homes for sale
Protect your home and budget from life's surprises with an Assurant Home Warranty, backed by a partner that supports you through every step of homeownership. Explore Plans.
©2026 Century 21 Real Estate LLC. All rights reserved. CENTURY 21®, the CENTURY 21 Logo and C21® are service marks owned by Century 21 Real Estate LLC. Century 21 Real Estate LLC fully supports the principles of the Fair Housing Act and the Equal Opportunity Act. Each office is independently owned and operated. Listing information is deemed reliable but not guaranteed accurate.