- Alta Loma homes for sale
- Bloomington homes for sale
- Cedarpines Park homes for sale
- Claremont homes for sale
- Crestline homes for sale
- Fontana homes for sale
- Hesperia homes for sale
- Lytle Creek homes for sale
- Mt Baldy homes for sale
- Mount Baldy-Wrightwood homes for sale
- Muscoy homes for sale
- Oak Hills homes for sale
- Phelan homes for sale
- Pinon Hills homes for sale
- Rancho Cucamonga homes for sale
- Rialto homes for sale
- San Antonio Heights homes for sale
- San Bernardino homes for sale
- Upland homes for sale
- Wrightwood homes for sale
92358, CA - homes for sale
9 of 9 results displayed
- Open Sat, 11am to 6pmNew
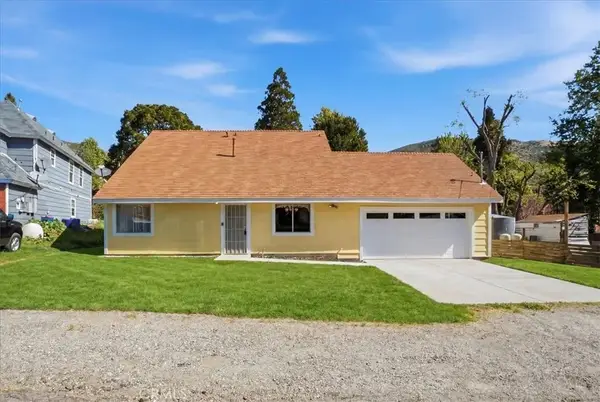 $499,000Active3 beds 2 baths1,326 sq. ft.
13894 Meadow, Lytle Creek, CA 92358
MLS# IG26063351Listed by: GOLD REAL ESTATE - New
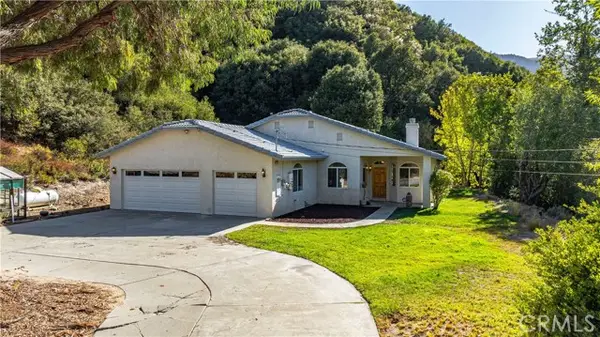 $650,000Active3 beds 2 baths2,406 sq. ft.
361 Valley Vista Drive, Lytle Creek, CA 92358
MLS# CRSW26062578Listed by: LINK BROKERAGES - New
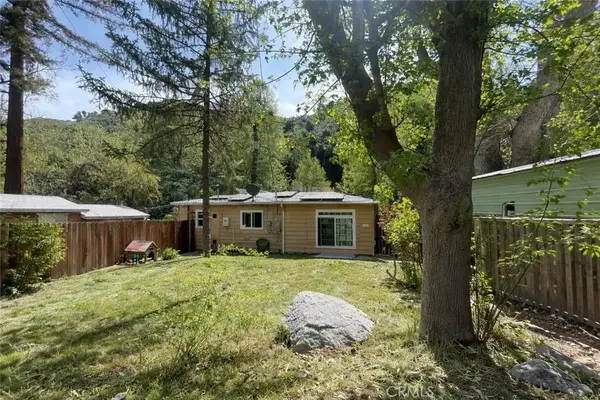 $455,000Active3 beds 2 baths1,032 sq. ft.
14025 Meadow, Lytle Creek, CA 92358
MLS# CV26062335Listed by: PAK HOME REALTY  $79,900Active2 beds 1 baths728 sq. ft.
14153 Pollard Drive #64, Lytle Creek, CA 92358
MLS# CRHD26058485Listed by: KEN PARKER, BROKER $250,000Pending3 beds 2 baths1,646 sq. ft.
528 Stream, Lytle Creek, CA 92358
MLS# CRCV26028335Listed by: EXP REALTY OF GREATER LOS ANGELES $575,000Pending2 beds 2 baths1,050 sq. ft.
323 Alder, Lytle Creek, CA 92358
MLS# CRSW25260339Listed by: BERKSHIRE HATHAWAY HOMESERVICES CALIFORNIA PROPERTIES $374,999Active2 beds 1 baths876 sq. ft.
14109 Meadow, Lytle Creek, CA 92358
MLS# CRCV25246873Listed by: VYLLA HOME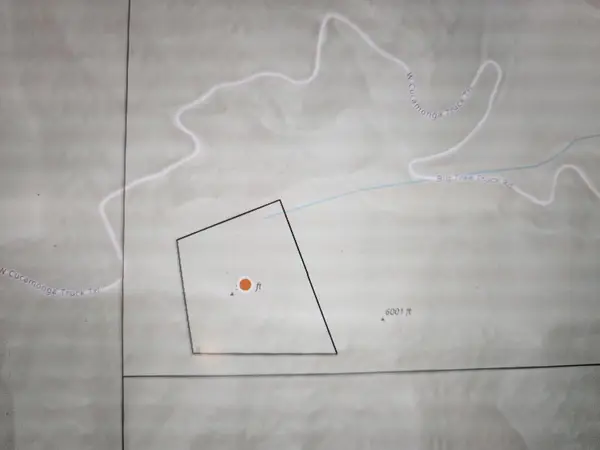 $50,500Active5.05 Acres
0 Lytle Creek Road, Lytle Creek, CA 92358
MLS# 219134199DAListed by: WINDERMERE REAL ESTATE $365,000Active1 beds 1 baths1,078 sq. ft.
13931 Irving Lane, Lytle Creek, CA 92358
MLS# 25005954Listed by: COBBLESTONE REALTY INC.
Local realty services provided by:CENTURY 21 Affiliated, CENTURY 21 Wildwood Properties, Inc., CENTURY 21 Masters, CENTURY 21 Virginia Wilder Real Estate
This information is deemed reliable but not guaranteed. You should rely on this information only to decide whether or not to further investigate a particular property. BEFORE MAKING ANY OTHER DECISION, YOU SHOULD PERSONALLY INVESTIGATE THE FACTS (e.g. square footage and lot size) with the assistance of an appropriate professional. You may use this information only to identify properties you may be interested in investigating further. All uses except for personal, non-commercial use in accordance with the foregoing purpose are prohibited. Redistribution or copying of this information, any photographs or video tours is strictly prohibited. This information is derived from the Internet Data Exchange (IDX) service provided by San Diego MLS®. Displayed property listings may be held by a brokerage firm other than the broker and/or agent responsible for this display. The information and any photographs and video tours and the compilation from which they are derived is protected by copyright. Compilation © 2020 San Diego MLS®, Inc.
The information being provided by California Regional MLS (Southern California) is for the consumer's personal, non-commercial use and may not be used for any purpose other than to identify prospective properties consumer may be interested in purchasing. Any information relating to real estate for sale referenced on this web site comes from the Internet Data Exchange (IDX) program of the California Regional MLS (Southern California). CENTURY 21 Masters is not a Multiple Listing Service (MLS), nor does it offer MLS access. This website is a service of CENTURY 21 Masters, a broker participant of California Regional MLS (Southern California). This web site may reference real estate listing(s) held by a brokerage firm other than the broker and/or agent who owns this web site.
The accuracy of all information, regardless of source, including but not limited to open house information, square footages and lot sizes, is deemed reliable but not guaranteed and should be personally verified through personal inspection by and/or with the appropriate professionals. The data contained herein is copyrighted by California Regional MLS (Southern California) and is protected by all applicable copyright laws. Any unauthorized dissemination of this information is in violation of copyright laws and is strictly prohibited.
Copyright 2021 California Regional MLS (Southern California). All rights reserved.
Popular searches near 92358
Popular neighborhoods near 92358
- California Landings, Fontana homes for sale
- Caryn, Rancho Cucamonga homes for sale
- Citrus Heights North, Fontana homes for sale
- Citrus Heights South, Fontana homes for sale
- Coyote Canyon, Fontana homes for sale
- Devore Heights, San Bernardino homes for sale
- Etiwanda, Rancho Cucamonga homes for sale
- Hunter's Ridge, Fontana homes for sale
- Morningside, Fontana homes for sale
- North Etiwanda, Rancho Cucamonga homes for sale
- Northwest Rialto, Rialto homes for sale
- Rosena Ranch, San Bernardino homes for sale
- San Antonio Heights, Upland homes for sale
- Shady Trails, Fontana homes for sale
- Sierra Lakes, Fontana homes for sale
- Summit Heights, Fontana homes for sale
- The Arboretum, Fontana homes for sale
- Victoria, Rancho Cucamonga homes for sale
- Westgate, Fontana homes for sale
- Wrightwood, Wrightwood homes for sale
Protect your home and budget from life's surprises with an Assurant Home Warranty, backed by a partner that supports you through every step of homeownership. Explore Plans.
©2026 Century 21 Real Estate LLC. All rights reserved. CENTURY 21®, the CENTURY 21 Logo and C21® are service marks owned by Century 21 Real Estate LLC. Century 21 Real Estate LLC fully supports the principles of the Fair Housing Act and the Equal Opportunity Act. Each office is independently owned and operated. Listing information is deemed reliable but not guaranteed accurate.