- Cadiz homes for sale
- Cave-In-Rock Precinct homes for sale
- Cave-In-Rock homes for sale
- Central City homes for sale
- Crofton homes for sale
- Dawson Springs homes for sale
- Eddyville homes for sale
- Elkton homes for sale
- Hatfield homes for sale
- Henderson homes for sale
- Hopkinsville homes for sale
- Lewisburg homes for sale
- Madisonville homes for sale
- Oak Grove-Pembroke homes for sale
- Owensboro homes for sale
- Pembroke homes for sale
- Penrod homes for sale
- Princeton homes for sale
- Southeast Lyon homes for sale
- Whitesville homes for sale
42431, KY - homes for sale
5 of 5 results displayed
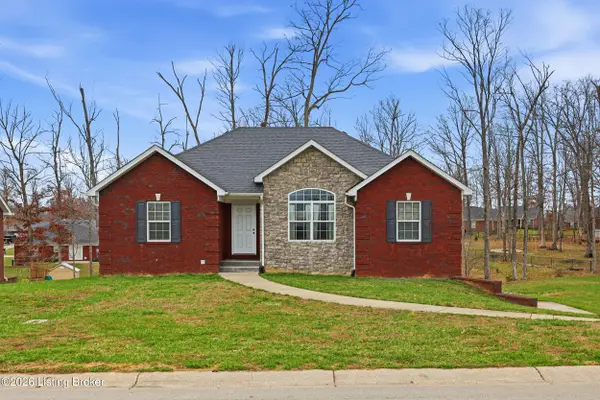 $319,900Active3 beds 2 baths1,400 sq. ft.
104 Pennyrile Dr, Coxs Creek, KY 40013
MLS# 1711092Listed by: NEST REALTY $254,950Active4 beds 3 baths2,568 sq. ft.
2032 Lakeshore Drive, Madisonville, KY 42431
MLS# 26004645Listed by: EXIT TOWN & COUNTRY REALTORS $150,000Active3 beds 2 baths1,280 sq. ft.
100 Hickory Hollow Dr, Madisonville, KY 42431
MLS# 3130386Listed by: SWEET HOME REALTY AND PROPERTY MANAGEMENT $529,900Active3 beds 3 baths3,025 sq. ft.
395 Carroll Gentry Rd, Madisonville, KY 42431
MLS# 3038277Listed by: EXIT PRIME REALTY $209,750Active3 beds 2 baths1,644 sq. ft.
1417 Crestview Dr, Madisonville, KY 42431
MLS# 3013937Listed by: KELLER WILLIAMS REALTY CLARKSVILLE
Local realty services provided by:CENTURY 21 Simpson & Associates, CENTURY 21 Pinnacle, CENTURY 21 Premier
Popular searches near 42431
Popular neighborhoods near 42431
- Anderson Place, Clarksville homes for sale
- Aspen Grove, Clarksville homes for sale
- Avalon, Clarksville homes for sale
- Bluegrass Downs, Clarksville homes for sale
- Centerstone Village, Clarksville homes for sale
- Creekview Village, Clarksville homes for sale
- Crosswinds, Clarksville homes for sale
- Fort Campbell, Woodlawn homes for sale
- Franklin Meadows, Clarksville homes for sale
- Glen Ellen Landing, Clarksville homes for sale
- Governors Crossing, Clarksville homes for sale
- Iroquois Gardens, Evansville homes for sale
- Meriwether Farms, Clarksville homes for sale
- Miller Estates, Clarksville homes for sale
- North Park, Clarksville homes for sale
- Peachtree, Clarksville homes for sale
- Plantation Estates, Clarksville homes for sale
- Sugar Tree, Clarksville homes for sale
- Tylertown, Clarksville homes for sale
- Wildwood West, Clarksville homes for sale
Counties near Madisonville, 42431
- Butler County homes for sale
- Caldwell County homes for sale
- Christian County homes for sale
- Crittenden County homes for sale
- Daviess County homes for sale
- Gallatin County homes for sale
- Hardin County homes for sale
- Henderson County homes for sale
- Hopkins County homes for sale
- Livingston County homes for sale
- Logan County homes for sale
- Lyon County homes for sale
- Muhlenberg County homes for sale
- Ohio County homes for sale
- Posey County homes for sale
- Spencer County homes for sale
- Todd County homes for sale
- Trigg County homes for sale
- Vanderburgh County homes for sale
- Warrick County homes for sale
Protect your home and budget from life's surprises with an Assurant Home Warranty, backed by a partner that supports you through every step of homeownership. Explore Plans.
©2026 Century 21 Real Estate LLC. All rights reserved. CENTURY 21®, the CENTURY 21 Logo and C21® are service marks owned by Century 21 Real Estate LLC. Century 21 Real Estate LLC fully supports the principles of the Fair Housing Act and the Equal Opportunity Act. Each office is independently owned and operated. Listing information is deemed reliable but not guaranteed accurate.