- Biltmore Hills, Raleigh homes for sale
- Cavalier Terrace, Wilson homes for sale
- Central Raleigh, Raleigh homes for sale
- Chastain, Raleigh homes for sale
- Cobblestone, Greenville homes for sale
- Crosstowne, Raleigh homes for sale
- Five Points, Wilson homes for sale
- Forest Hills, Wilson homes for sale
- Hedingham, Raleigh homes for sale
- Jenning Acres, Wilson homes for sale
- Jetstream Park, Wilson homes for sale
- Kingwood Forest, Raleigh homes for sale
- Landover, Greenville homes for sale
- Riverwood Athletic Club, Clayton homes for sale
- South Central Raleigh, Raleigh homes for sale
- South Raleigh, Garner homes for sale
- Southeast Raleigh, Raleigh homes for sale
- The Village - Country Club West, Wilson homes for sale
- Washington Carver Heights, Wilson homes for sale
- Wilson Country Club, Wilson homes for sale
Mar-Mac, NC - homes for sale
28 of 28 results displayed
- New
 $275,000Active3 beds 2 baths1,999 sq. ft.
704 Kentucky Drive, Goldsboro, NC 27530
MLS# 100562749Listed by: COLDWELL BANKER HOWARD PERRY & WALSTON - New
 $219,000Active3 beds 2 baths1,325 sq. ft.
102 Foxwood Place, Goldsboro, NC 27530
MLS# 100562055Listed by: COX REAL ESTATE  $224,900Active3 beds 2 baths1,740 sq. ft.
1440 Old Grantham Road, Goldsboro, NC 27530
MLS# 100561554Listed by: GROW LOCAL REALTY LLC $275,000Pending3 beds 3 baths1,757 sq. ft.
108 Brockwood Avenue, Goldsboro, NC 27530
MLS# 100558795Listed by: LEGACY BUILDER, LLC $289,900Active4 beds 3 baths2,053 sq. ft.
127 Pintail Drive, Goldsboro, NC 27530
MLS# 10148954Listed by: SDH RALEIGH LLC $281,900Active3 beds 3 baths1,813 sq. ft.
124 Pintail Drive, Goldsboro, NC 27530
MLS# 10148613Listed by: SDH RALEIGH LLC $269,845Pending3 beds 2 baths1,501 sq. ft.
122 Pintail Drive, Goldsboro, NC 27530
MLS# 10148638Listed by: SDH RALEIGH LLC $273,900Active3 beds 2 baths1,501 sq. ft.
131 Pintail Drive, Goldsboro, NC 27530
MLS# 10148411Listed by: SDH RALEIGH LLC $175,000Pending3 beds 2 baths1,386 sq. ft.
305 Crestwood Drive, Goldsboro, NC 27530
MLS# 100556024Listed by: DAWSON & CO. REALTY, LLC $239,900Active3 beds 2 baths1,206 sq. ft.
106 Drake Village Drive, Goldsboro, NC 27530
MLS# 10145526Listed by: NORTHGROUP REAL ESTATE, INC.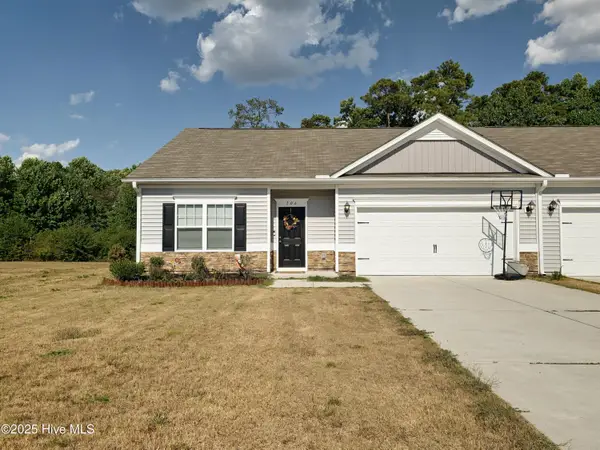 $239,900Active3 beds 2 baths1,206 sq. ft.
106 Drake Village Drive, Goldsboro, NC 27530
MLS# 100553621Listed by: NORTHGROUP REAL ESTATE LLC $409,900Active35 Acres
0 S Us 117 Hwy, Dudley, NC 27833
MLS# 100553062Listed by: COX REAL ESTATE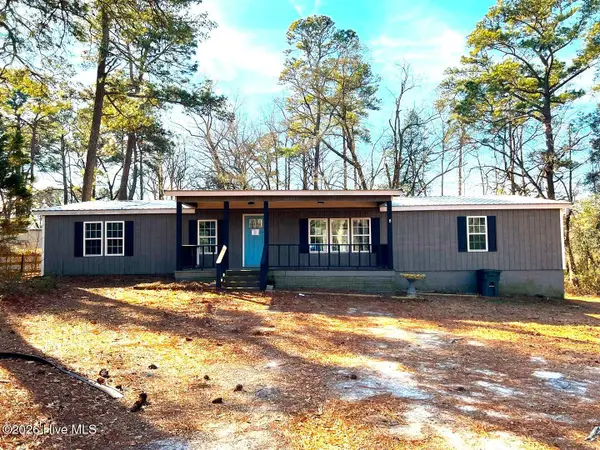 $149,900Active3 beds 2 baths1,828 sq. ft.
505 Ridge Drive, Goldsboro, NC 27530
MLS# 100552154Listed by: USA HOME AGENT- New
 $1,195,000Active3 beds 3 baths2,521 sq. ft.
7950 Winter Horses Dr, Middleton, ID 83644
MLS# 98972330Listed by: SILVERCREEK REALTY GROUP  $289,900Pending3 beds 3 baths2,100 sq. ft.
209 Crestwood Drive, Goldsboro, NC 27530
MLS# 100549753Listed by: HOMETOWNE REALTY $132,000Pending2 beds 1 baths850 sq. ft.
109 Tulane Street, Dudley, NC 28333
MLS# 100549185Listed by: RE/MAX COMPLETE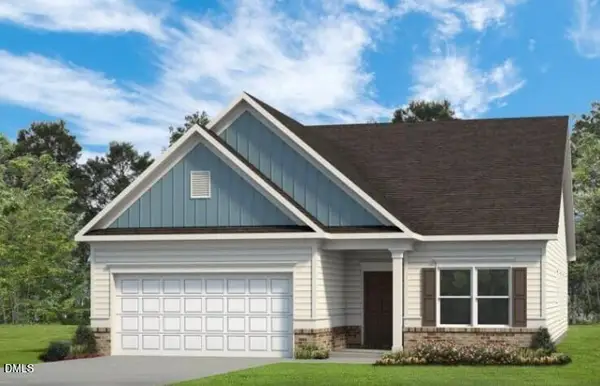 $285,725Pending3 beds 2 baths1,803 sq. ft.
126 Pintail Drive, Goldsboro, NC 27530
MLS# 10139190Listed by: SDH RALEIGH LLC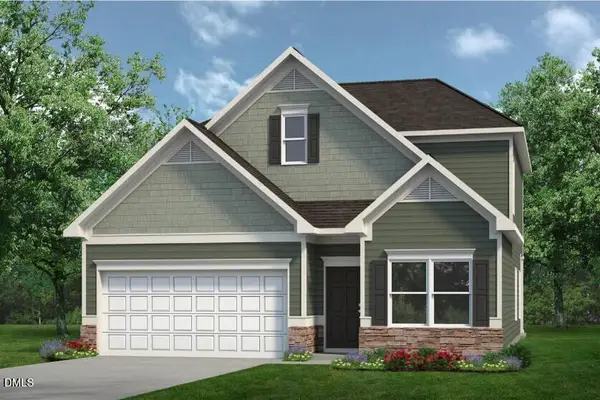 $310,725Pending3 beds 3 baths2,231 sq. ft.
128 Pintail Drive, Goldsboro, NC 27530
MLS# 10139078Listed by: SDH RALEIGH LLC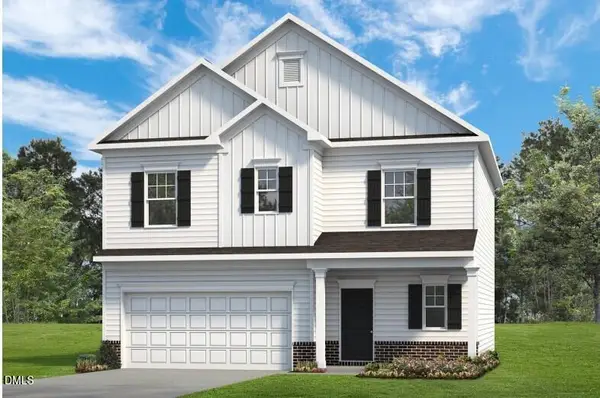 $274,900Active3 beds 3 baths1,813 sq. ft.
203 Pintail Drive, Goldsboro, NC 27530
MLS# 10139026Listed by: SDH RALEIGH LLC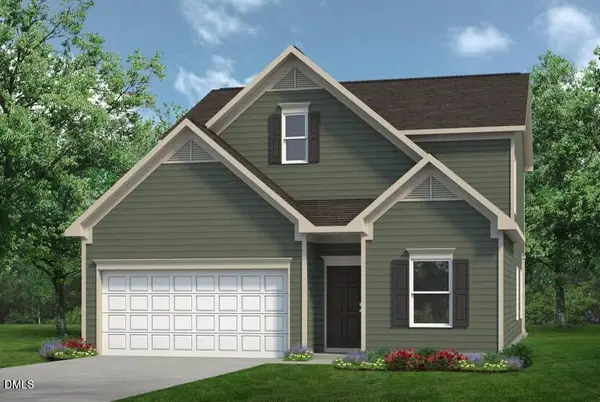 $304,900Active3 beds 3 baths2,231 sq. ft.
130 Pintail Drive, Goldsboro, NC 27530
MLS# 10139051Listed by: SDH RALEIGH LLC $250,000Active3 beds 1 baths1,078 sq. ft.
206 Waldrop Road, Dudley, NC 28333
MLS# 100546978Listed by: COLDWELL BANKER HOWARD PERRY & WALSTON $289,900Pending4 beds 3 baths2,053 sq. ft.
211 North Bali Court, Goldsboro, NC 27530
MLS# 10138305Listed by: SDH RALEIGH LLC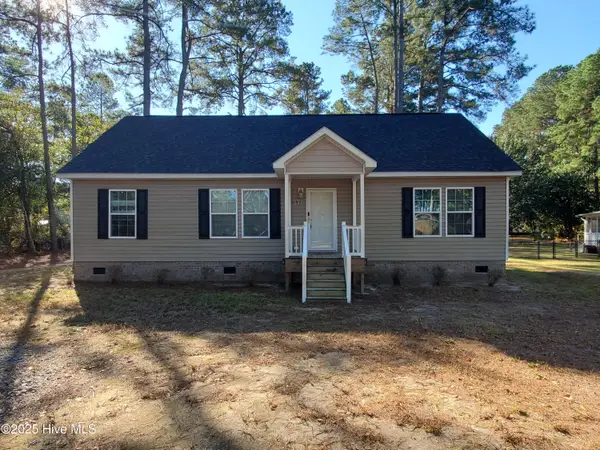 $252,000Active3 beds 2 baths1,937 sq. ft.
692 Sandhill Drive, Dudley, NC 28333
MLS# 100539443Listed by: EXP REALTY LLC - C $65,000Active0.59 Acres
205 Nancy Drive, Dudley, NC 28333
MLS# 100538706Listed by: COLDWELL BANKER HOWARD PERRY & WALSTON $93,800Active3 beds 2 baths
102 Sami Street, Goldsboro, NC 27530
MLS# 1198577Listed by: EXP REO BROKERS, INC
 $190,000Pending3 beds 2 baths1,981 sq. ft.
103 Rythm Place, Goldsboro, NC 27530
MLS# 10119035Listed by: HOMETOWNE REALTY $245,000Pending3 beds 2 baths1,477 sq. ft.
141 Clydes Lane, Goldsboro, NC 27530
MLS# 10118393Listed by: EXP REALTY, LLC - C $47,500Active0.5 Acres
300 Crestwood Drive, Goldsboro, NC 27530
MLS# 100508071Listed by: ATLANTIC COASTAL REAL ESTATE, LLC
Local realty services provided by:CENTURY 21 New Beginnings, CENTURY 21 Total Real Estate Solutions, CENTURY 21 Northstar
Listings marked with a Doorify MLS icon are provided courtesy of the Doorify MLS, of North Carolina, Internet Data Exchange Database. Brokers make an effort to deliver accurate information, but buyers should independently verify any information on which they will rely in a transaction. The listing broker shall not be responsible for any typographical errors, misinformation, or misprints, and they shall be held totally harmless from any damages arising from reliance upon this data. This data is provided exclusively for consumers’ personal, non-commercial use. Copyright 2026 Doorify MLS of North Carolina. All rights reserved.
Property information provided by the RAFGC MLS – a service of the REALTOR® Association of Franklin & Gulf Counties.
2026 Triad MLS, Inc. All rights reserved. IDX information is provided exclusively for personal, non-commercial use, and may not be used for any purpose other than to identify prospective properties consumers may be interested in purchasing. Information is deemed reliable but not guaranteed. This site will be monitored for ‘scraping’ and any use of search facilities of data on the site other than by potential buyers/sellers is prohibited. All Sale data is for informational purposes only and is not an indication of a market analysis or appraisal. Properties marked with the Triad MLS, Inc. icon are provided courtesy of the Triad MLS, Inc.’s, Internet Data Exchange Database.
Neighborhoods near Mar-Mac, NC
Zip codes near Mar-Mac, NC
- 27524 homes for sale
- 27530 homes for sale
- 27534 homes for sale
- 27542 homes for sale
- 27568 homes for sale
- 27569 homes for sale
- 27576 homes for sale
- 27577 homes for sale
- 27813 homes for sale
- 27830 homes for sale
- 27851 homes for sale
- 27863 homes for sale
- 27883 homes for sale
- 28333 homes for sale
- 28341 homes for sale
- 28365 homes for sale
- 28366 homes for sale
- 28551 homes for sale
- 28578 homes for sale
- 28580 homes for sale
Popular searches near Mar-Mac, NC
- Boon Hill homes for sale
- Brogden Township homes for sale
- Brogden homes for sale
- Buck Swamp homes for sale
- Dudley homes for sale
- Elroy homes for sale
- Fork homes for sale
- Goldsboro homes for sale
- Goldsboro Township homes for sale
- Grantham homes for sale
- Indian Springs homes for sale
- Mt Olive homes for sale
- Mt Olive homes for sale
- New Hope homes for sale
- New Hope Township homes for sale
- Pikeville homes for sale
- Princeton homes for sale
- Saulston homes for sale
- Stoney Creek homes for sale
- Walnut Creek homes for sale
Protect your home and budget from life's surprises with an Assurant Home Warranty, backed by a partner that supports you through every step of homeownership. Explore Plans.
©2026 Century 21 Real Estate LLC. All rights reserved. CENTURY 21®, the CENTURY 21 Logo and C21® are service marks owned by Century 21 Real Estate LLC. Century 21 Real Estate LLC fully supports the principles of the Fair Housing Act and the Equal Opportunity Act. Each office is independently owned and operated. Listing information is deemed reliable but not guaranteed accurate.