- Beverly Shores homes for sale
- Center homes for sale
- Chesterton homes for sale
- Coolspring homes for sale
- Grand Beach homes for sale
- Jackson homes for sale
- Long Beach homes for sale
- Michiana homes for sale
- Michiana Shores homes for sale
- Michigan homes for sale
- Michigan City homes for sale
- New Buffalo homes for sale
- New Durham homes for sale
- Pine homes for sale
- Porter homes for sale
- Springfield homes for sale
- Town Of Pines homes for sale
- Trail Creek homes for sale
- Westchester homes for sale
- Westville homes for sale
46360, IN - homes for sale
300 of 348 results displayed
- New
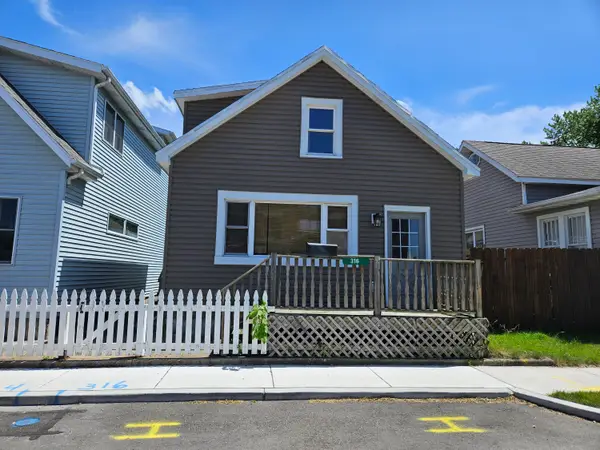 $164,900Active2 beds 2 baths1,340 sq. ft.
316 W 11th Street, Michigan City, IN 46360
MLS# 841151Listed by: BS REALTY SERVICES INDIANA LLC - New
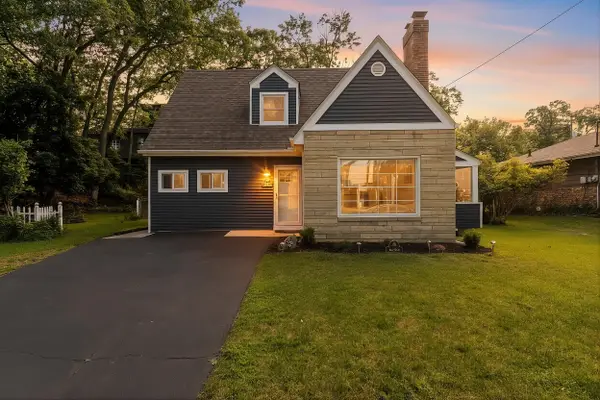 $659,000Active4 beds 2 baths2,640 sq. ft.
2406 St Lawrence Avenue, Long Beach, IN 46360
MLS# 841101Listed by: @PROPERTIES/CHRISTIE'S INTL RE - New
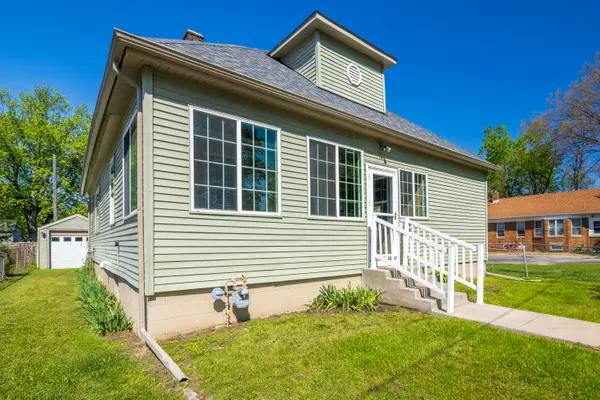
 $259,900Active3 beds 2 baths2,028 sq. ft.
7032 W Red Apple Drive, Michigan City, IN 46360
MLS# 841099Listed by: BHHS EXECUTIVE REALTY - New
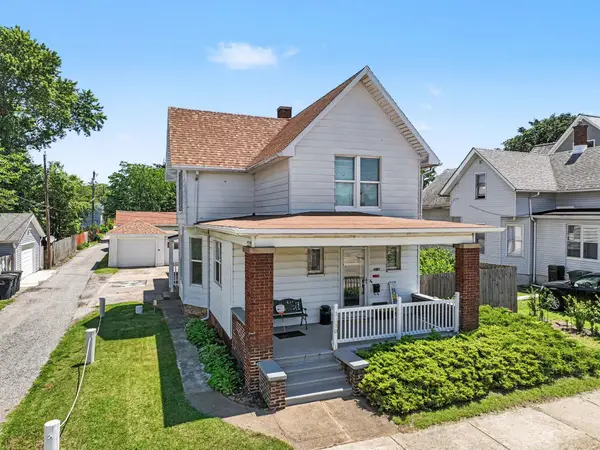
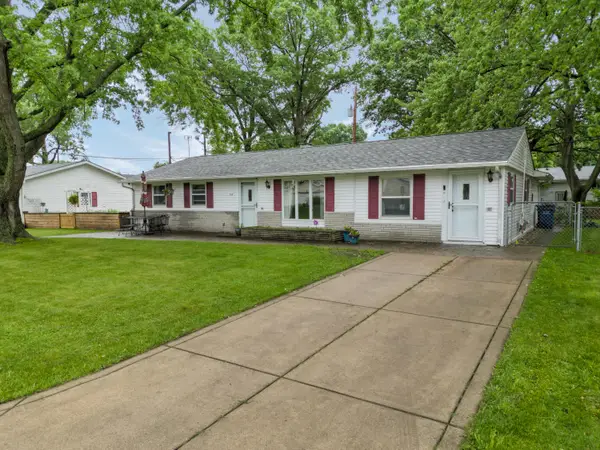
 $189,900Active3 beds 1 baths1,100 sq. ft.
204 Edward Street, Michigan City, IN 46360
MLS# 841079Listed by: @PROPERTIES/CHRISTIE'S INTL RE - New
 $239,000Active5 beds 3 baths2,236 sq. ft.
1110 Pine Street, Michigan City, IN 46360
MLS# 841075Listed by: REMAX COUNTY WIDE 1ST - New
 $512,000Active3 beds 2 baths1,130 sq. ft.
2310 Hazeltine Drive, Long Beach, IN 46360
MLS# 841046Listed by: @PROPERTIES/CHRISTIE'S INTL RE - New
 $85,000Active4 beds 2 baths
124 N Woodland Avenue, Michigan City, IN 46360
MLS# 841035Listed by: @PROPERTIES/CHRISTIE'S INTL RE - New
 $199,000Active3 beds 2 baths
542 Holliday Street, Michigan City, IN 46360
MLS# 841020Listed by: BEACH TOWN BROKERAGE - New
 $459,000Active3 beds 3 baths2,672 sq. ft.
1811 N Country Lane, Michigan City, IN 46360
MLS# 841024Listed by: BLACKROCK REAL ESTATE SERVICES - New
 $25,000Active0.23 Acres
0 Ruth Street, Michigan City, IN 46360
MLS# 841026Listed by: COLDWELL BANKER REALTY - New

 $549,000Active1 beds 1 baths1,069 sq. ft.
3820 Hiawatha Drive, Michigan City, IN 46360
MLS# 841016Listed by: CENTURY 21 CIRCLE - New
 $250,000Active3 beds 2 baths1,152 sq. ft.
702 N Karwick Road, Michigan City, IN 46360
MLS# 840988Listed by: COLDWELL BANKER REALTY - New
 $19,900Active0.46 Acres
0 Maryland, Michigan City, IN 46360
MLS# 840979Listed by: BEYCOME BROKERAGE REALTY LLC - New
 $299,000Active4 beds 4 baths2,352 sq. ft.
4909 N Brookside Drive, Michigan City, IN 46360
MLS# 840958Listed by: WEICHERT REALTORS, MERRION GRO - New
 $464,000Active2 beds 2 baths1,114 sq. ft.
44 Tryon Farm Lane, Michigan City, IN 46360
MLS# 840874Listed by: @PROPERTIES/CHRISTIE'S INTL RE - New
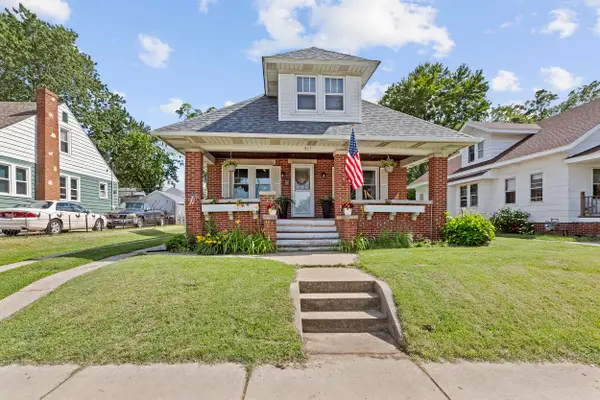
 $265,000Active4 beds 2 baths1,895 sq. ft.
238 Walnut Street, Michigan City, IN 46360
MLS# 840877Listed by: KEY REALTY INDIANA, LLC - New
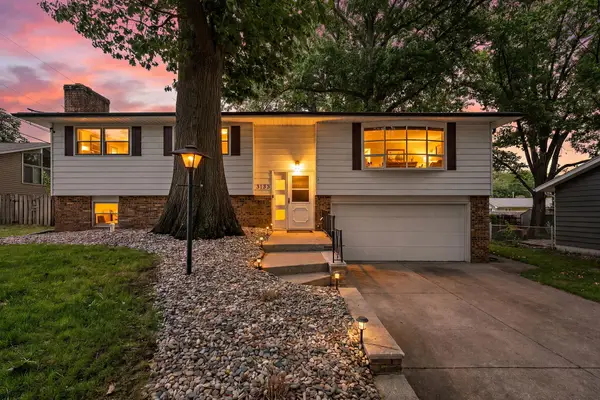 $330,000Active4 beds 3 baths2,283 sq. ft.
3133 Cleveland Avenue, Michigan City, IN 46360
MLS# 840879Listed by: REALTY EXECUTIVES PREMIER - New
 $370,000Active3 beds 2 baths2,636 sq. ft.
489 E Furness Road, Michigan City, IN 46360
MLS# 840604Listed by: BROKERWORKS GROUP - New
 $225,000Active4 beds 2 baths2,154 sq. ft.
511 Greenwood Avenue, Michigan City, IN 46360
MLS# 840798Listed by: KEY REALTY INDIANA, LLC - New
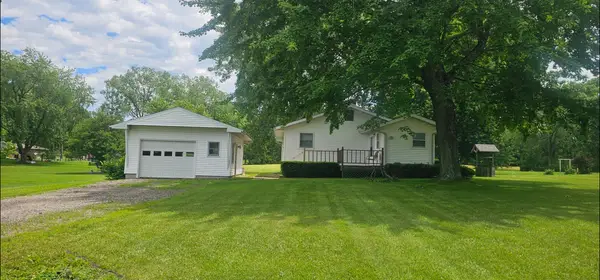 $210,000Active3 beds 2 baths1,364 sq. ft.
9921 N 375 W, Michigan City, IN 46360
MLS# 840800Listed by: MTM REALTY GROUP - New
 $138,900Active3 beds 1 baths825 sq. ft.
1305 Springland Avenue, Michigan City, IN 46360
MLS# 840794Listed by: REALTY EXECUTIVES PREMIER - Open Sat, 11am to 1pmNew
 $998,000Active4 beds 3 baths4,121 sq. ft.
30 Bristol Drive, Michigan City, IN 46360
MLS# 840761Listed by: COLDWELL BANKER REALTY - New
 $320,000Active0.2 Acres
830 Washington Park Blvd, Michigan City, IN 46360
MLS# 840743Listed by: PARADIGM REALTY SOLUTIONS, LLC - New
 $139,900Active4 beds 2 baths1,760 sq. ft.
116 W Barker Avenue, Michigan City, IN 46360
MLS# 840739Listed by: COLDWELL BANKER REALTY  $65,000Pending4 beds 2 baths
127 E William Street, Michigan City, IN 46360
MLS# 840731Listed by: WEICHERT REALTORS, MERRION GRO- New
 $335,000Active0.21 Acres
832 Washington Park Blvd, Michigan City, IN 46360
MLS# 840714Listed by: PARADIGM REALTY SOLUTIONS, LLC - New
 $515,000Active3 beds 2 baths1,776 sq. ft.
302 Lady Lane, Michigan City, IN 46360
MLS# 840720Listed by: @PROPERTIES/CHRISTIE'S INTL RE - New
 $557,900Active3 beds 2 baths1,692 sq. ft.
10290 Old Grand Beach Road, Michigan City, IN 46360
MLS# 202623706Listed by: MTM REALTY GROUP - New
 $159,000Active4 beds 1 baths1,848 sq. ft.
2114 Ohio Street, Michigan City, IN 46360
MLS# 840688Listed by: COLDWELL BANKER REALTY - New
 $234,500Active1 beds 1 baths546 sq. ft.
12 Tryon Farm Lane, Michigan City, IN 46360
MLS# 840699Listed by: MTM REALTY GROUP  $329,900Pending3 beds 1 baths1,537 sq. ft.
106 Garden Trail, Michigan City, IN 46360
MLS# 840503Listed by: WHITE HAT REALTY GROUP, LLC- New
 $659,999Active4 beds 3 baths2,480 sq. ft.
506 Washington Park Boulevard, Michigan City, IN 46360
MLS# 840661Listed by: BLACKROCK REAL ESTATE SERVICES  $250,000Pending5 beds 2 baths2,605 sq. ft.
517 Jackson Street, Michigan City, IN 46360
MLS# 840038Listed by: BROKERWORKS GROUP $350,000Pending3 beds 2 baths2,578 sq. ft.
11202 W 400 N, Michigan City, IN 46360
MLS# 840628Listed by: DREAM TEAM AGENTS, LLC $129,900Active3 beds 2 baths1,456 sq. ft.
8176 W Pahs Road, Michigan City, IN 46360
MLS# 840615Listed by: MCCOLLY REAL ESTATE $299,000Active3 beds 2 baths
1407 Franklin Street, Michigan City, IN 46360
MLS# 840571Listed by: @PROPERTIES/CHRISTIE'S INTL RE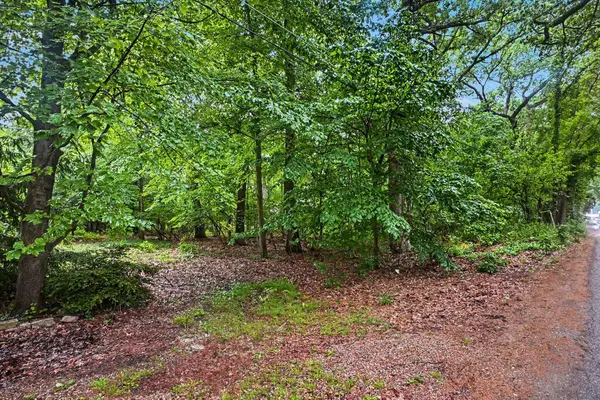 $124,000Active0.35 Acres
0 Chickadee Trail, Michigan City, IN 46360
MLS# 840522Listed by: KELLER WILLIAMS REALTY SWM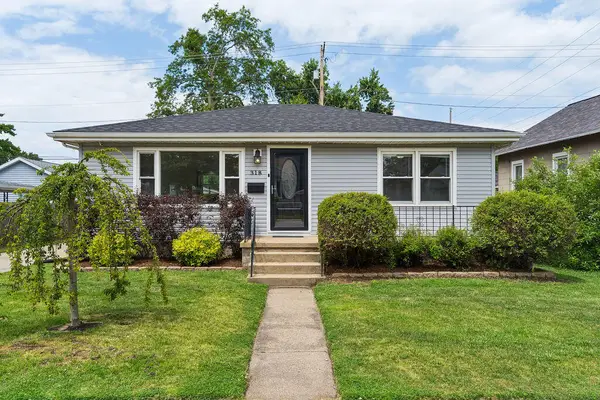 $199,000Pending3 beds 2 baths1,472 sq. ft.
318 South Street, Michigan City, IN 46360
MLS# 840532Listed by: @PROPERTIES/CHRISTIE'S INTL RE $750,000Active3 beds 2 baths3,640 sq. ft.
11011 W 100 N, Michigan City, IN 46360
MLS# 840517Listed by: WEICHERT REALTORS, MERRION GRO $319,000Active3 beds 2 baths1,652 sq. ft.
4825 E Us Highway 12, Michigan City, IN 46360
MLS# 840472Listed by: REALEST.COM $349,000Active15 Acres
6131 N 300 W, Michigan City, IN 46360
MLS# 840461Listed by: REMAX COUNTY WIDE 1ST $139,000Active4 beds 2 baths
315 Dupage Street, Michigan City, IN 46360
MLS# 840431Listed by: WEICHERT REALTORS, MERRION GRO $230,000Active4 beds 2 baths1,774 sq. ft.
6788 N 400 W, Michigan City, IN 46360
MLS# 840386Listed by: @PROPERTIES/CHRISTIE'S INTL RE $199,000Active3 beds 1 baths1,309 sq. ft.
1965 N U. S. Highway 421, Michigan City, IN 46360
MLS# 840379Listed by: @PROPERTIES/CHRISTIE'S INTL RE $260,000Active5 beds 2 baths1,793 sq. ft.
367 Chestnut Street, Michigan City, IN 46360
MLS# 840382Listed by: @PROPERTIES/CHRISTIE'S INTL RE $150,000Active0.88 Acres
0 Blackberry Trail, Michigan City, IN 46360
MLS# 840318Listed by: COLDWELL BANKER REALTY $150,000Active0.78 Acres
0 Magnolia Trail, Michigan City, IN 46360
MLS# 840319Listed by: COLDWELL BANKER REALTY $12,000Pending0.4 Acres
0 Cory Avenue, Michigan City, IN 46360
MLS# 840316Listed by: CENTURY 21 CIRCLE $150,000Active5 beds 2 baths2,366 sq. ft.
606 Main Street, Michigan City, IN 46360
MLS# 840301Listed by: REMAX COUNTY WIDE 1ST $249,000Pending2 beds 1 baths1,112 sq. ft.
10155 W 100 N, Michigan City, IN 46360
MLS# 840289Listed by: CENTURY 21 CIRCLE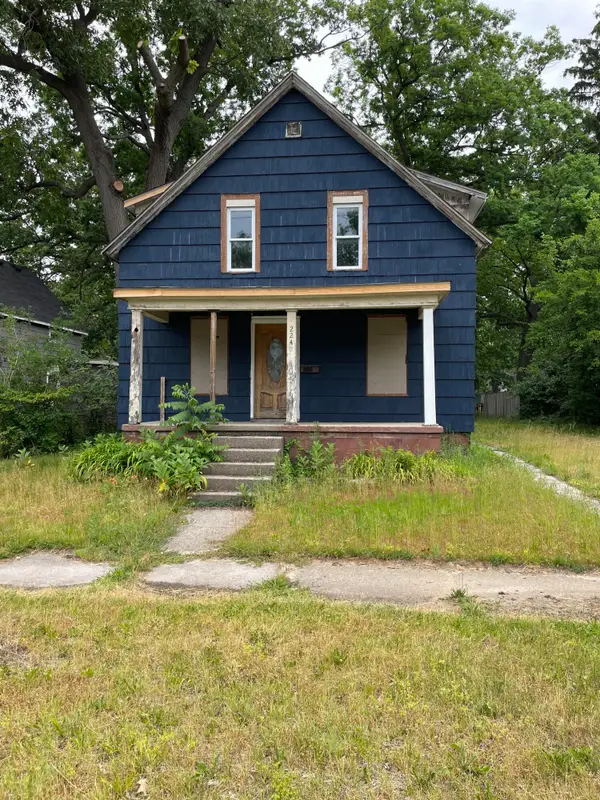 $85,000Active5 beds 2 baths
224 Hobart Street, Michigan City, IN 46360
MLS# 840285Listed by: BEACH TOWN BROKERAGE $195,000Active4 beds 4 baths
322 E 8th Street, Michigan City, IN 46360
MLS# 840279Listed by: COLDWELL BANKER REALTY $495,000Active4 beds 5 baths
320 E 8th, Michigan City, IN 46360
MLS# 840278Listed by: COLDWELL BANKER REALTY $159,000Active3 beds 1 baths1,796 sq. ft.
117 N Calumet Avenue, Michigan City, IN 46360
MLS# 840267Listed by: @PROPERTIES/CHRISTIE'S INTL RE $3,750,000Active5 beds 4 baths4,247 sq. ft.
2940 Lake Shore Drive, Long Beach, IN 46360
MLS# 12669988Listed by: COLDWELL BANKER REALTY
 $495,000Pending6 beds 3 baths4,500 sq. ft.
6606 W Calloway Street, Michigan City, IN 46360
MLS# 840218Listed by: BHHS EXECUTIVE REALTY $317,000Active3 beds 2 baths2,918 sq. ft.
312 Wilshire Avenue, Michigan City, IN 46360
MLS# 840184Listed by: EXP REALTY, LLC $49,900Active0.25 Acres
0 Maple Street, Michigan City, IN 46360
MLS# 840169Listed by: @PROPERTIES/CHRISTIE'S INTL RE $309,000Pending3 beds 2 baths1,856 sq. ft.
617 Greentree Drive, Michigan City, IN 46360
MLS# 840156Listed by: COLDWELL BANKER REALTY $240,000Active3 beds 3 baths1,780 sq. ft.
1202 Washington Street, Michigan City, IN 46360
MLS# 840157Listed by: COLDWELL BANKER REALTY $199,000Active3 beds 2 baths1,448 sq. ft.
1616 Lafayette Street, Michigan City, IN 46360
MLS# 840158Listed by: COLDWELL BANKER REALTY $2,195,000Pending6 beds 3 baths2,945 sq. ft.
2300 Lake Shore Drive, Long Beach, IN 46360
MLS# 839855Listed by: MTM REALTY GROUP $174,900Pending5 beds 2 baths
1201 Wabash Street, Michigan City, IN 46360
MLS# 840152Listed by: DUNES REALTY, LLC $99,000Active0.49 Acres
0 Hutchinson Avenue, Beverly Shores, IN 46304
MLS# 839417Listed by: A.R.E. PARTNERS INC. $395,000Active3 beds 2 baths1,923 sq. ft.
219 W 6th Street, Michigan City, IN 46360
MLS# 840132Listed by: @PROPERTIES/CHRISTIE'S INTL RE $319,000Active4 beds 4 baths
401 E Garfield Street, Michigan City, IN 46360
MLS# 840088Listed by: KEY REALTY INDIANA, LLC $724,900Active8 beds 8 baths5,757 sq. ft.
3309 Springland Avenue, Michigan City, IN 46360
MLS# 840076Listed by: COLDWELL BANKER 1ST CHOICE $389,000Active4 beds 3 baths2,607 sq. ft.
104 Gardena Street, Michigan City, IN 46360
MLS# 840040Listed by: WHITE HAT REALTY GROUP, LLC $16,000Active0.03 Acres
0 Tennessee (corner Lot) Street, Michigan City, IN 46360
MLS# 840054Listed by: CENTURY 21 CIRCLE $20,000Active0.05 Acres
0 Tennessee Street, Michigan City, IN 46360
MLS# 840008Listed by: CENTURY 21 CIRCLE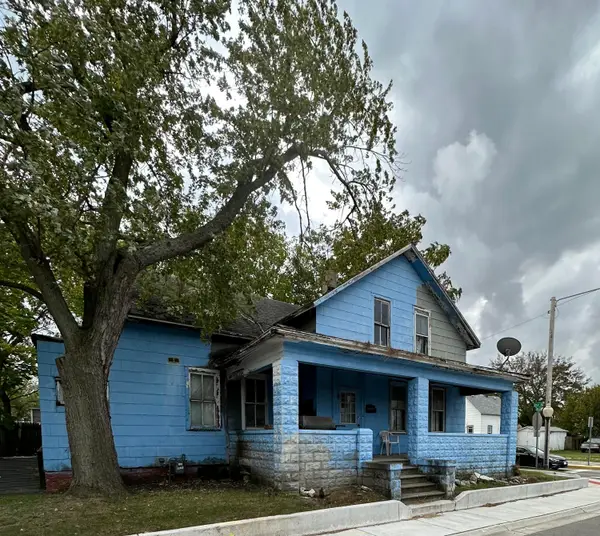 $45,000Active7 beds 2 baths3,346 sq. ft.
616 W 11th Street, Michigan City, IN 46360
MLS# 839984Listed by: HARBOR & LAKE REAL ESTATE, LLC $250,000Pending3 beds 2 baths2,080 sq. ft.
714 Washington Park Boulevard, Michigan City, IN 46360
MLS# 839999Listed by: DOUBLE DIAMOND REAL ESTATE LLC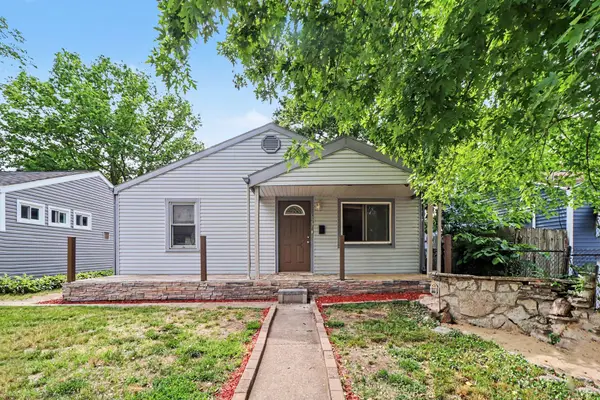 $135,000Active2 beds 1 baths984 sq. ft.
627 Donnelly Street, Michigan City, IN 46360
MLS# 839952Listed by: RE/MAX DIAMOND PROPERTIES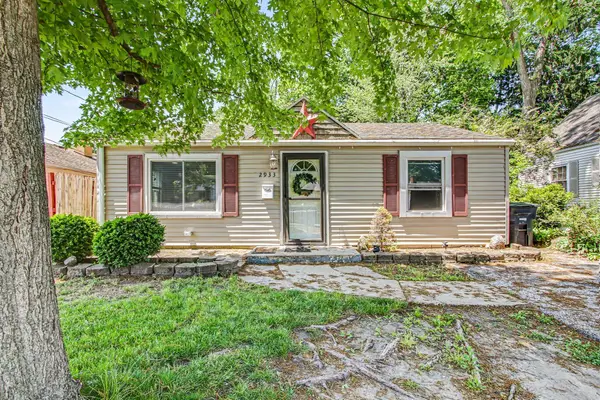 $139,900Active2 beds 1 baths720 sq. ft.
2933 Cleveland Avenue, Michigan City, IN 46360
MLS# 839943Listed by: CENTURY 21 CIRCLE $219,000Active3 beds 2 baths2,120 sq. ft.
1807 E Michigan Boulevard, Michigan City, IN 46360
MLS# 839944Listed by: CENTURY 21 CIRCLE $199,900Pending4 beds 2 baths1,344 sq. ft.
107 Grove Street, Michigan City, IN 46360
MLS# 839946Listed by: RE/MAX DIAMOND PROPERTIES $104,000Active3 beds 3 baths1,368 sq. ft.
6862 NE Suburban Drive, Michigan City, IN 46360
MLS# 839912Listed by: WEICHERT REALTORS, MERRION GRO $325,000Active2 beds 2 baths1,158 sq. ft.
129 S Lake Avenue #A, Michigan City, IN 46360
MLS# 839915Listed by: KELLER WILLIAMS REALTY SWM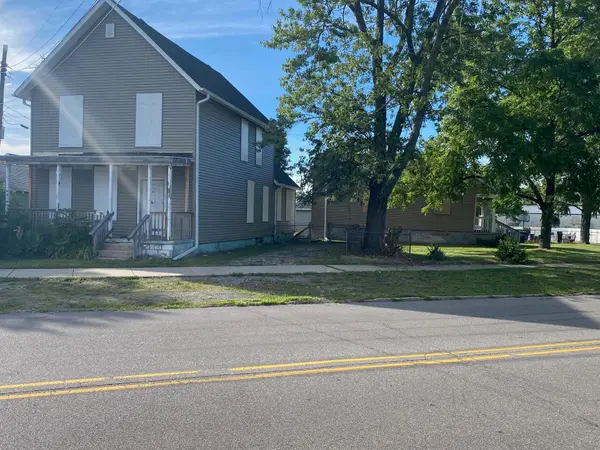 $125,000Pending6 beds -- baths
207 Chicago Street, Michigan City, IN 46360
MLS# 839872Listed by: @PROPERTIES/CHRISTIE'S INTL RE $161,500Active3 beds 1 baths1,000 sq. ft.
721 Indiana Avenue, Michigan City, IN 46360
MLS# 839839Listed by: BLACKROCK REAL ESTATE SERVICES $1,150,000Active3 beds 4 baths3,015 sq. ft.
318 El Portal Drive, Michigan City, IN 46360
MLS# 839836Listed by: PARADIGM REALTY SOLUTIONS, LLC $105,000Active2 beds 1 baths1,100 sq. ft.
529 Jackson Street, Michigan City, IN 46360
MLS# 839821Listed by: KEY REALTY INDIANA, LLC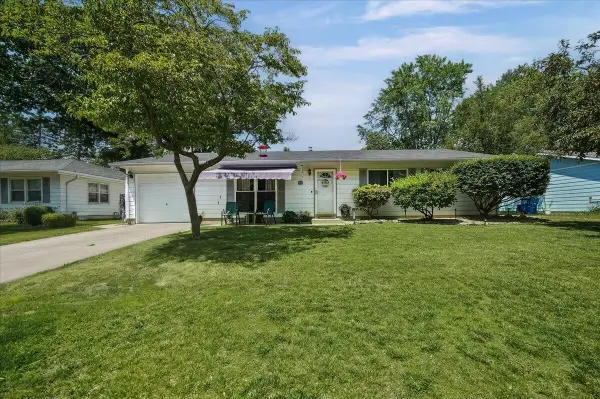 $232,500Active4 beds 1 baths1,680 sq. ft.
337 Southwood Drive, Michigan City, IN 46360
MLS# 839822Listed by: NEW CHAPTER REAL ESTATE $75,000Active3 Acres
6456 N 400 W, Michigan City, IN 46360
MLS# 839828Listed by: WEICHERT REALTORS, MERRION GRO $229,000Active3 beds 2 baths1,309 sq. ft.
224 Madison Street, Michigan City, IN 46360
MLS# 839733Listed by: BLACKROCK REAL ESTATE SERVICES $395,000Active3 beds 2 baths2,016 sq. ft.
400 Autumn Trail, Michigan City, IN 46360
MLS# 839711Listed by: @PROPERTIES/CHRISTIE'S INTL RE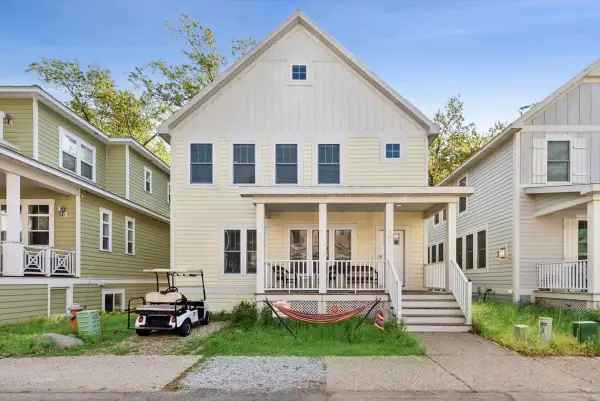 $949,900Active5 beds 4 baths2,532 sq. ft.
204 Mary Lane, Michigan City, IN 46360
MLS# 839458Listed by: @PROPERTIES/CHRISTIE'S INTL RE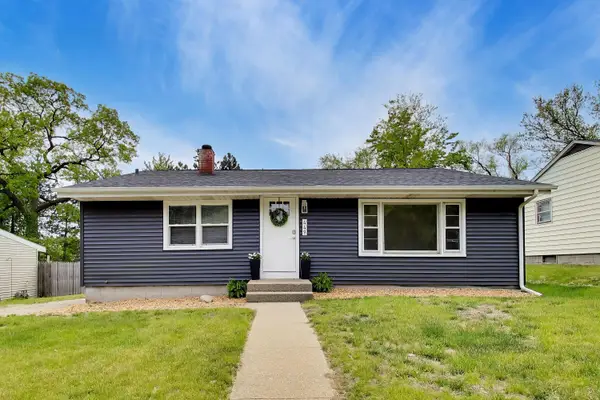 $399,000Active3 beds 2 baths1,368 sq. ft.
449 Washington Park Boulevard, Michigan City, IN 46360
MLS# 839660Listed by: @PROPERTIES/CHRISTIE'S INTL RE $3,300,000Active5 beds 5 baths4,851 sq. ft.
3402 Iroquois Trail, Michigan City, IN 46360
MLS# 839540Listed by: @PROPERTIES/CHRISTIE'S INTL RE $169,000Active6 beds 2 baths
111 S Porter Street, Michigan City, IN 46360
MLS# 839462Listed by: @PROPERTIES/CHRISTIE'S INTL RE $345,000Active3 beds 3 baths2,470 sq. ft.
6762 W 450 N, Michigan City, IN 46360
MLS# 839452Listed by: BLACKROCK REAL ESTATE SERVICES $785,000Active5 beds 4 baths4,452 sq. ft.
104 Keyo Drive, Michigan City, IN 46360
MLS# 839250Listed by: COLDWELL BANKER REALTY $209,000Active0.41 Acres
9 S Beach Avenue, Beverly Shores, IN 46301
MLS# 839437Listed by: MTM REALTY GROUP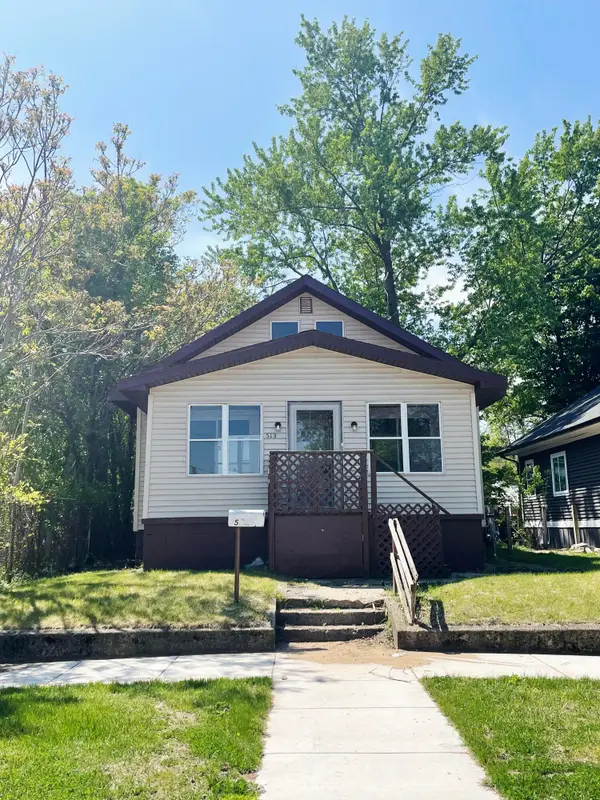 $89,900Active2 beds 2 baths
519 Union Street, Michigan City, IN 46360
MLS# 839364Listed by: THE JAEGER GROUP, LLC- Open Sat, 12 to 2pm
 $485,000Active3 beds 2 baths1,384 sq. ft.
112 Blaine Street, Michigan City, IN 46360
MLS# 839367Listed by: COLDWELL BANKER REALTY  $265,000Pending3 beds 2 baths1,664 sq. ft.
1022 Georgetown Road, Michigan City, IN 46360
MLS# 839323Listed by: @PROPERTIES/CHRISTIE'S INTL RE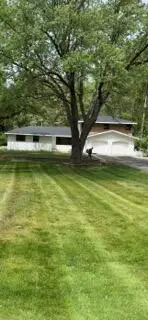 $399,000Active6 beds 2 baths2,950 sq. ft.
7543 W 275 N, Michigan City, IN 46360
MLS# 839284Listed by: PARADIGM REALTY SOLUTIONS, LLC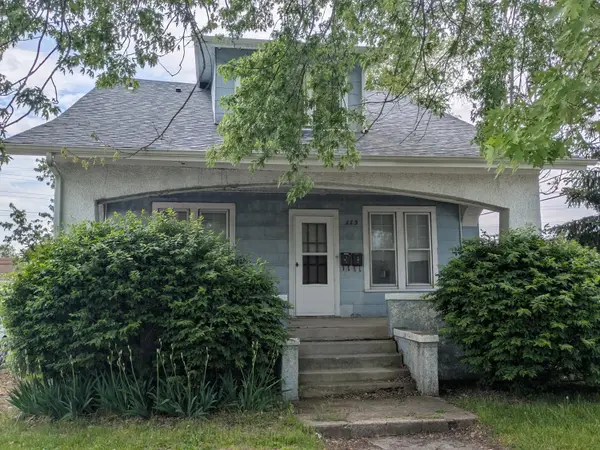 $149,999Pending4 beds 3 baths
115 Greenwood Avenue, Michigan City, IN 46360
MLS# 839237Listed by: MCCOLLY REAL ESTATE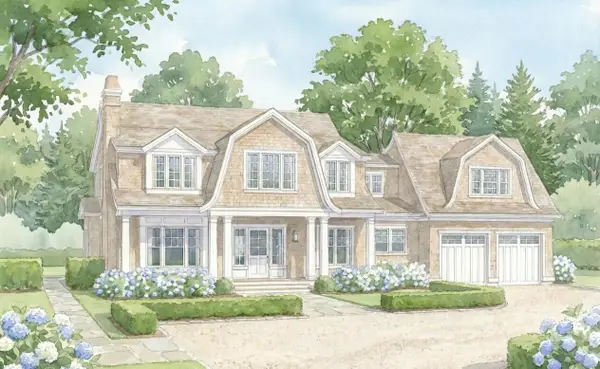 $2,800,000Active4 beds 4 baths3,481 sq. ft.
3 Lilac Lane, GrandBeach, MI 49117
MLS# 69025041240Listed by: BERKSHIRE HATHAWAY HOMESERVICES CHICAGO $1,950,000Active4 beds 5 baths3,490 sq. ft.
2 Lilac Lane, GrandBeach, MI 49117
MLS# 69025049190Listed by: BERKSHIRE HATHAWAY HOMESERVICES CHICAGO $259,000Active1 beds 2 baths741 sq. ft.
10 Tryon Farm Lane #F10, Michigan City, IN 46360
MLS# 839155Listed by: COLDWELL BANKER REALTY $325,000Active3 beds 2 baths1,982 sq. ft.
2614 Maple Street, Michigan City, IN 46360
MLS# 839119Listed by: WEICHERT REALTORS, MERRION GRO $58,000Active-- beds 2 baths
703 W 9th Street, Michigan City, IN 46360
MLS# 839124Listed by: BEACH TOWN BROKERAGE $310,000Active2 beds 2 baths1,183 sq. ft.
11 Tryon Farm Lane, Michigan City, IN 46360
MLS# 839125Listed by: COLDWELL BANKER REALTY $375,000Active3 beds 3 baths3,338 sq. ft.
485 Boyd Circle, Michigan City, IN 46360
MLS# 839118Listed by: @PROPERTIES/CHRISTIE'S INTL RE $159,900Active3 beds 2 baths1,806 sq. ft.
703 N Carroll Avenue, Michigan City, IN 46360
MLS# 839084Listed by: @PROPERTIES/CHRISTIE'S INTL RE $209,900Pending3 beds 1 baths1,541 sq. ft.
125 Martin Drive, Michigan City, IN 46360
MLS# 839093Listed by: REMAX COUNTY WIDE 1ST $24,900Active0.52 Acres
7966 Dianne Drive, Michigan City, IN 46360
MLS# 839064Listed by: CENTURY 21 CIRCLE $561,500Active3 beds 3 baths3,004 sq. ft.
213 Kenwood Place, Michigan City, IN 46360
MLS# 839061Listed by: @PROPERTIES/CHRISTIE'S INTL RE $245,000Active3 beds 2 baths1,817 sq. ft.
2032 Welnetz Road, Trail Creek, IN 46360
MLS# 839053Listed by: MCCOLLY REAL ESTATE- Open Sat, 12 to 5pm
 $599,900Active3 beds 4 baths2,245 sq. ft.
10 Moorebrooke Road, Michigan City, IN 46360
MLS# 839015Listed by: BROKERWORKS GROUP - Open Sat, 12 to 5pm
 $569,900Active3 beds 3 baths1,880 sq. ft.
15 Moorebrooke Road, Michigan City, IN 46360
MLS# 839016Listed by: BROKERWORKS GROUP - Open Sat, 12 to 5pm
 $569,900Active3 beds 3 baths1,880 sq. ft.
17 Moorebrooke Road, Michigan City, IN 46360
MLS# 839017Listed by: BROKERWORKS GROUP  $384,900Active3 beds 2 baths1,866 sq. ft.
6323 N 600 W, Michigan City, IN 46360
MLS# 839019Listed by: REALTY EXECUTIVES PREMIER $134,999Active4 beds 2 baths1,680 sq. ft.
714 E 10th Street, Michigan City, IN 46360
MLS# 838989Listed by: COLDWELL BANKER REALTY $235,000Active4 beds 2 baths1,800 sq. ft.
623 N Carroll Avenue, Michigan City, IN 46360
MLS# 838967Listed by: HARBOR & LAKE REAL ESTATE, LLC $285,000Active3 beds 2 baths1,248 sq. ft.
121 Indian Ridge Drive, Michigan City, IN 46360
MLS# 838908Listed by: MCCOLLY REAL ESTATE $879,000Active4 beds 3 baths3,090 sq. ft.
6373 N 450 W, La Porte, IN 46350
MLS# 838860Listed by: @PROPERTIES/CHRISTIE'S INTL RE $80,000Active4 beds 1 baths2,010 sq. ft.
415 Cleveland Avenue, Michigan City, IN 46360
MLS# 838876Listed by: RE/MAX LIFESTYLES $122,000Active2 beds 1 baths1,624 sq. ft.
810 Poplar Street, Michigan City, IN 46360
MLS# 838820Listed by: PMI NWI $375,000Active2 beds 2 baths2,033 sq. ft.
201 Autumn Trail, Michigan City, IN 46360
MLS# 838796Listed by: REMAX COUNTY WIDE 1ST $260,000Active4 beds 2 baths1,665 sq. ft.
1417 Earl Road, Michigan City, IN 46360
MLS# 838802Listed by: REALTY EXECUTIVES PREMIER $235,000Pending3 beds 2 baths2,250 sq. ft.
3003 Wrobel Avenue, Michigan City, IN 46360
MLS# 838713Listed by: COLDWELL BANKER REALTY $40,000Active0.37 Acres
0 Winnipeg Street, Michigan City, IN 46360
MLS# 838654Listed by: MCCOLLY REAL ESTATE $2,790,000Active5 beds 3 baths3,885 sq. ft.
10 S Oval Avenue, Beverly Shores, IN 46301
MLS# 838550Listed by: @PROPERTIES/CHRISTIE'S INTL RE $314,900Active3 beds 3 baths1,798 sq. ft.
153 Mayfield Drive, Michigan City, IN 46360
MLS# 838510Listed by: COPPER BAY REALTY, LLC $299,000Pending4 beds 3 baths2,338 sq. ft.
321 S Park Street, Michigan City, IN 46360
MLS# 838137Listed by: @PROPERTIES/CHRISTIE'S INTL RE $379,000Pending4 beds 3 baths2,797 sq. ft.
6544 W Calloway Street, Michigan City, IN 46360
MLS# 838449Listed by: LAPORTE COUNTY REALTY, INC. $249,900Active1 beds 1 baths1,077 sq. ft.
223 Shady Oak Drive, Michigan City, IN 46360
MLS# 838441Listed by: CENTURY 21 CIRCLE $749,900Pending3 beds 3 baths2,489 sq. ft.
221 Shady Oak Drive, Michigan City, IN 46360
MLS# 838443Listed by: CENTURY 21 CIRCLE $265,000Active3 beds 2 baths1,654 sq. ft.
1001 Earl Road, Michigan City, IN 46360
MLS# 838417Listed by: @PROPERTIES/CHRISTIE'S INTL RE $179,900Active4 beds 1 baths1,384 sq. ft.
225 Columbia Street, Michigan City, IN 46360
MLS# 838368Listed by: PROPERTY MANAGEMENT OF NWI, LL $115,000Pending3 beds 1 baths1,440 sq. ft.
117 Fir, Michigan City, IN 46360
MLS# 838331Listed by: DOUBLE DIAMOND REAL ESTATE LLC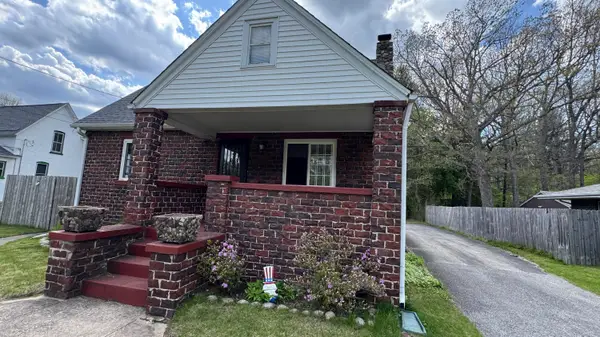 $224,900Active3 beds 1 baths1,852 sq. ft.
424 Yanke Road, Trail Creek, IN 46360
MLS# 838313Listed by: REALTY EXECUTIVES PREMIER $369,900Active4 beds 2 baths2,072 sq. ft.
112 Mayfield Drive, Michigan City, IN 46360
MLS# 838235Listed by: COPPER BAY REALTY, LLC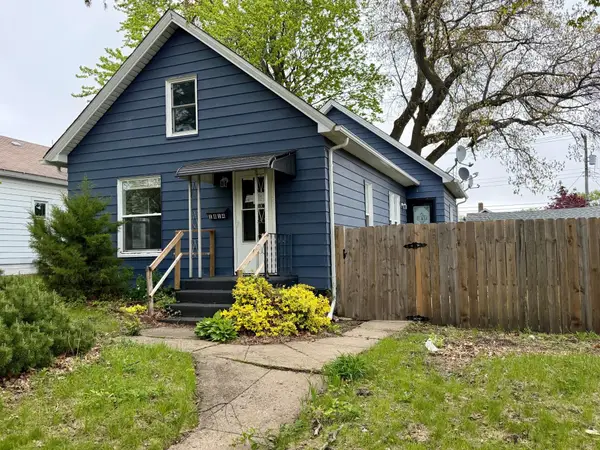 $99,000Active3 beds 2 baths1,896 sq. ft.
1814 Elston Street, Michigan City, IN 46360
MLS# 838213Listed by: DOUBLE DIAMOND REAL ESTATE LLC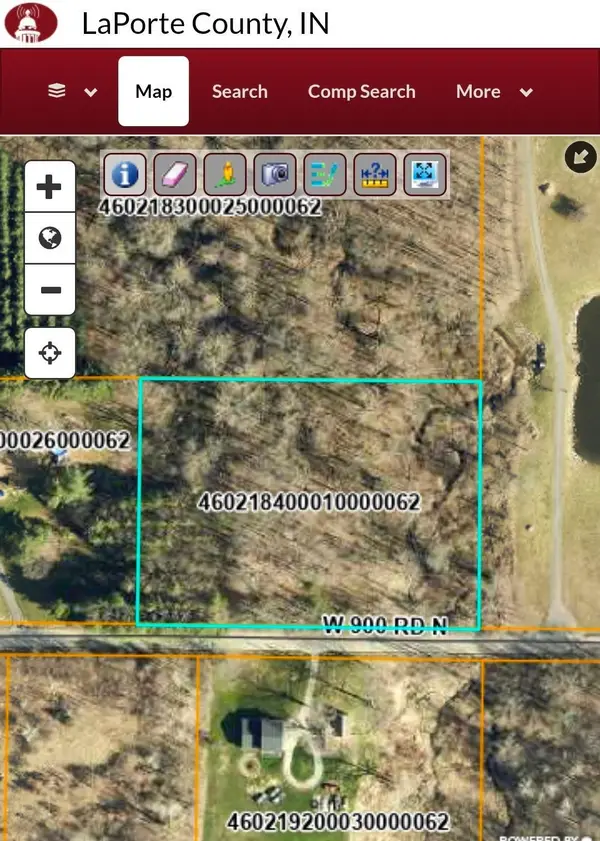 $85,000Active3.43 Acres
0 W 900 N, Michigan City, IN 46360
MLS# 838194Listed by: MCCOLLY REAL ESTATE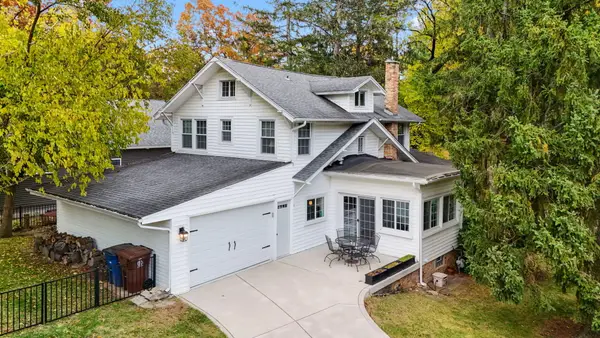 $689,000Pending5 beds 2 baths1,727 sq. ft.
2005 Oriole Trail, Long Beach, IN 46360
MLS# 838133Listed by: COLDWELL BANKER REALTY $169,900Active2 beds 1 baths764 sq. ft.
715 S Ashland Avenue, Michigan City, IN 46360
MLS# 838119Listed by: RE/MAX LIFESTYLES $220,000Active5 beds 2 baths
902 Kentucky Street, Michigan City, IN 46360
MLS# 838127Listed by: HOMESMART REALTY GROUP $319,999Active1 beds 1 baths824 sq. ft.
2 Marine Drive #6, Michigan City, IN 46360
MLS# 838088Listed by: MTM REALTY GROUP $365,000Active4 beds 3 baths2,682 sq. ft.
906 Honeysuckle Lane, Michigan City, IN 46360
MLS# 837378Listed by: BLACKROCK REAL ESTATE SERVICES $310,000Active4 beds 3 baths
1724 Ohio Street, Michigan City, IN 46360
MLS# 838069Listed by: @PROPERTIES/CHRISTIE'S INTL RE $349,999Active2 beds 2 baths1,158 sq. ft.
125 S Lake Avenue #A, Michigan City, IN 46360
MLS# 837311Listed by: COLDWELL BANKER REAL ESTATE GR $140,000Active3 beds 2 baths2,658 sq. ft.
324 Jackson Street, Michigan City, IN 46360
MLS# 838046Listed by: RE/MAX LIFESTYLES $529,000Active-- beds 1 baths
1115 Franklin Street, Michigan City, IN 46360
MLS# 837999Listed by: BLACKROCK REAL ESTATE SERVICES $539,900Pending2 beds 2 baths858 sq. ft.
101 Maggie Lane, Michigan City, IN 46360
MLS# 837964Listed by: COLDWELL BANKER REAL ESTATE GR $975,000Active5 beds 4 baths2,500 sq. ft.
808 Washington Park Boulevard, Michigan City, IN 46360
MLS# 837934Listed by: COLDWELL BANKER REALTY $265,000Active0.17 Acres
820 Washington Park Blvd, Michigan City, IN 46360
MLS# 837937Listed by: COLDWELL BANKER REALTY $275,000Active0.18 Acres
822 Washington Park Blvd, Michigan City, IN 46360
MLS# 837938Listed by: COLDWELL BANKER REALTY $150,000Active0.28 Acres
0 Juneway Drive, Long Beach, IN 46360
MLS# 837839Listed by: MTM REALTY GROUP $495,000Active0.14 Acres
0 Lake Shore Drive, Long Beach, IN 46360
MLS# 837768Listed by: @PROPERTIES/CHRISTIE'S INTL RE $274,900Pending4 beds 3 baths2,702 sq. ft.
231 Old Mill Road, Trail Creek, IN 46360
MLS# 837650Listed by: DOUBLE DIAMOND REAL ESTATE LLC $749,000Active3 beds 2 baths1,402 sq. ft.
17 Angle, Update, IN 46350
MLS# 70526861Listed by: COLDWELL BANKER REALTY $220,000Active8.9 Acres
- W W 400 N, Michigan City, IN 46360
MLS# 837567Listed by: MTM REALTY GROUP $1,100,000Active4 beds 2 baths2,105 sq. ft.
2033 Lake Shore Drive, Long Beach, IN 46360
MLS# 837543Listed by: @PROPERTIES/CHRISTIE'S INTL RE $1,280,000Active4 beds 4 baths3,790 sq. ft.
804 E Wilson Avenue, Beverly Shores, IN 46301
MLS# 12596474Listed by: CENTURY 21 CIRCLE $175,500Active4 beds 1 baths1,444 sq. ft.
705 Plymouth Court, Michigan City, IN 46360
MLS# 837491Listed by: LISTING LEADERS $180,000Pending3 beds 2 baths1,800 sq. ft.
1034 Woodlawn Avenue, Michigan City, IN 46360
MLS# 837431Listed by: MCCOLLY REAL ESTATE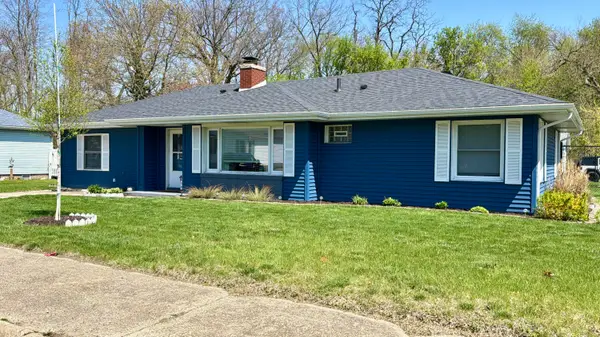 $229,900Pending3 beds 1 baths1,372 sq. ft.
632 S Dickson Street, Michigan City, IN 46360
MLS# 837435Listed by: BANIC REAL ESTATE & APPRAISAL $239,000Active4 beds 3 baths3,147 sq. ft.
606 Hobart Street, Michigan City, IN 46360
MLS# 837400Listed by: COLDWELL BANKER REALTY $98,000Active8.55 Acres
45 Duneland Beach Drive, Michigan City, IN 46360
MLS# 837346Listed by: EXP REALTY, LLC $199,999Active3 beds 1 baths1,702 sq. ft.
724 Dupage Street, Michigan City, IN 46360
MLS# 837343Listed by: PARADIGM REALTY SOLUTIONS, LLC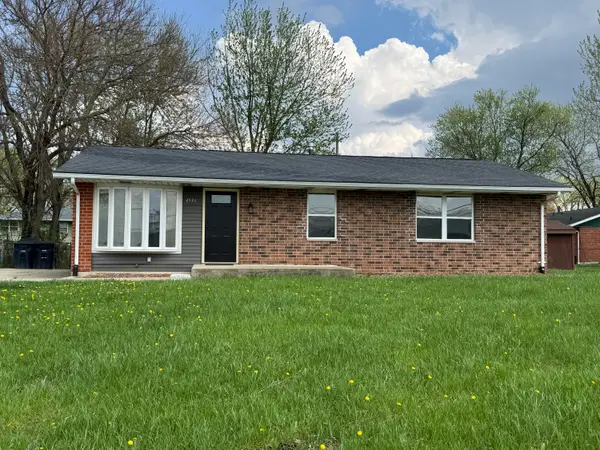 $209,900Active3 beds 2 baths1,144 sq. ft.
4536 Ohio Street, Michigan City, IN 46360
MLS# 837294Listed by: MCCOLLY REAL ESTATE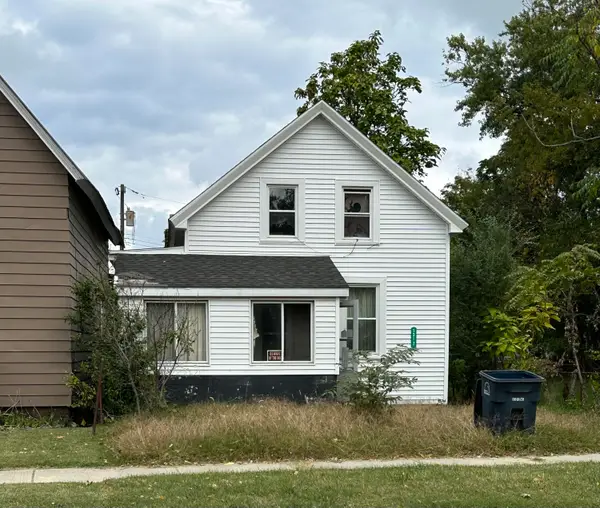 $49,000Active3 beds 2 baths1,902 sq. ft.
1217 W 10th Street, Michigan City, IN 46360
MLS# 837289Listed by: HARBOR & LAKE REAL ESTATE, LLC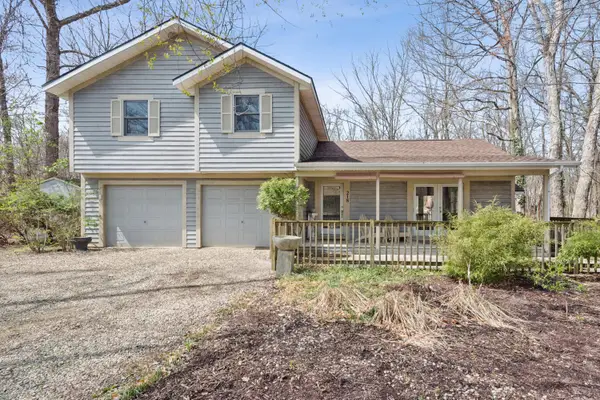 $399,900Active3 beds 3 baths1,333 sq. ft.
218 Chickadee Trail, Michigan City, IN 46360
MLS# 837291Listed by: @PROPERTIES/CHRISTIE'S INTL RE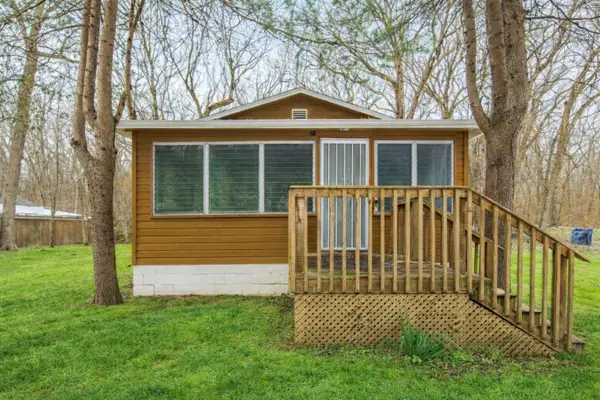 $235,000Pending3 beds 2 baths1,032 sq. ft.
516 Nahas Street, Michigan City, IN 46360
MLS# 837224Listed by: @PROPERTIES/CHRISTIE'S INTL RE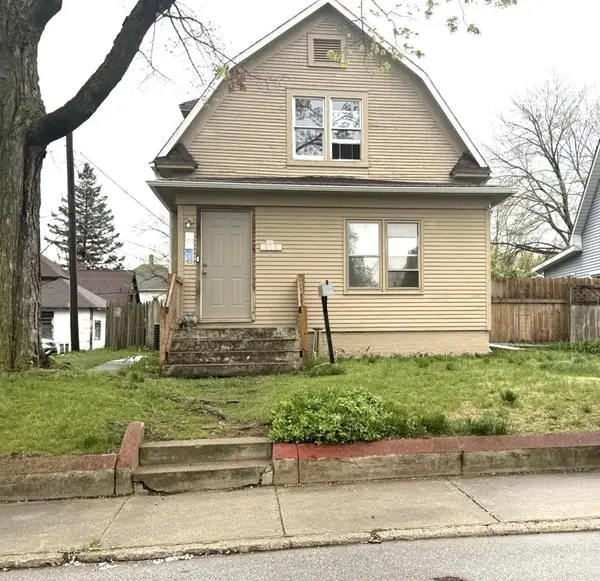 $209,000Active3 beds 2 baths1,587 sq. ft.
118 Dewey Street, Michigan City, IN 46360
MLS# 837225Listed by: @PROPERTIES/CHRISTIE'S INTL RE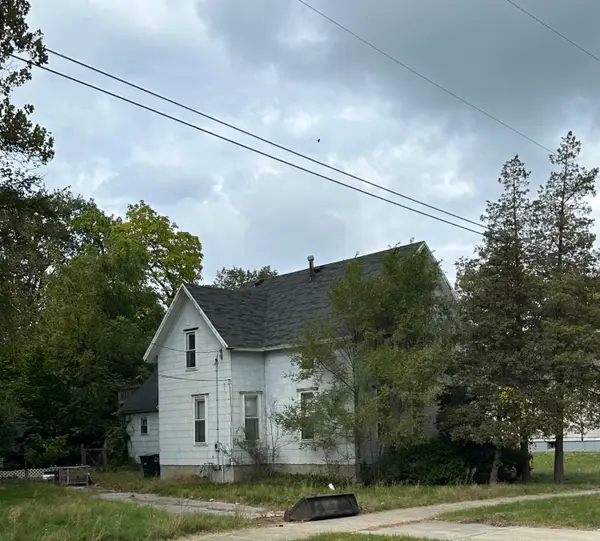 $50,000Active4 beds 2 baths1,804 sq. ft.
219 Grant Avenue, Michigan City, IN 46360
MLS# 837207Listed by: HARBOR & LAKE REAL ESTATE, LLC $649,000Active3 beds 2 baths1,692 sq. ft.
31 S Lake Shore County Road, Beverly Shores, IN 46301
MLS# 837160Listed by: ARLENE BEGLIN REAL ESTATE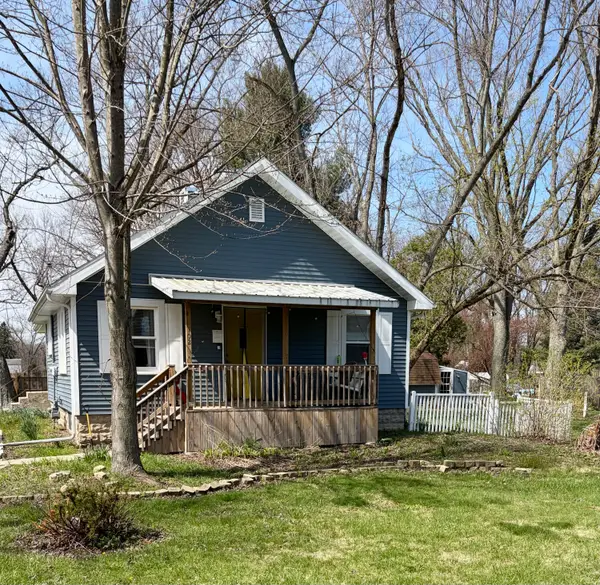 $225,000Active3 beds 2 baths1,078 sq. ft.
102 Leeds Avenue, Michigan City, IN 46360
MLS# 837107Listed by: KELLER WILLIAMS REALTY SWM $475,000Active2 beds 2 baths1,288 sq. ft.
3852 Birchwood, Update, IN 46360
MLS# 70525040Listed by: KELLER WILLIAMS REALTY SWM $590,000Active4 beds 2 baths3,840 sq. ft.
507 Center Street, Michigan City, IN 46360
MLS# 836997Listed by: COLDWELL BANKER REALTY $749,900Active4 beds 3 baths3,323 sq. ft.
2936 Belle Plaine Trail, Long Beach, IN 46360
MLS# 836652Listed by: WEICHERT REALTORS, MERRION GRO $859,000Active4 beds 3 baths2,568 sq. ft.
71 Timber Trail, Michigan City, IN 46360
MLS# 836962Listed by: BERKSHIRE HATHAWAY HOMESERVICE $599,900Active4 beds 3 baths
116 Fogarty Street, Michigan City, IN 46360
MLS# 836840Listed by: WEICHERT REALTORS, MERRION GRO $630,000Active2 beds 1 baths1,365 sq. ft.
218 Fogarty Street, Michigan City, IN 46360
MLS# 836668Listed by: MTM REALTY GROUP $985,000Active5 beds 6 baths2,621 sq. ft.
810 Washington Park Boulevard, Michigan City, IN 46360
MLS# 836568Listed by: COLDWELL BANKER REALTY $2,395,000Active4 beds 4 baths3,485 sq. ft.
250 W Lake Front Drive W, Beverly Shores, IN 46301
MLS# 836564Listed by: @PROPERTIES/CHRISTIE'S INTL RE $50,000Pending2 beds 2 baths1,995 sq. ft.
725 Minnie Street, Michigan City, IN 46360
MLS# 836546Listed by: COLDWELL BANKER REALTY $139,900Active4 beds 2 baths1,850 sq. ft.
1921 E Coolspring Avenue, Trail Creek, IN 46360
MLS# 836399Listed by: DOUBLE DIAMOND REAL ESTATE LLC $111,000Active3 beds 2 baths1,452 sq. ft.
111 N Calumet Avenue, Michigan City, IN 46360
MLS# 836314Listed by: EXP REALTY, LLC $3,675,000Active5 beds 4 baths4,527 sq. ft.
2940 Lake Shore Drive, Long Beach, IN 46360
MLS# 836308Listed by: COLDWELL BANKER REALTY $30,000Active3 beds 1 baths1,128 sq. ft.
2120 Ohio Street, Michigan City, IN 46360
MLS# 836298Listed by: MCCOLLY REAL ESTATE $165,900Active3 beds 1 baths864 sq. ft.
2414 Ohio Street, Michigan City, IN 46360
MLS# 836280Listed by: BERKSHIRE HATHAWAY HOMESERVICE $375,000Active3 beds 3 baths2,393 sq. ft.
101 Briese Lane, Michigan City, IN 46360
MLS# 836271Listed by: MONTY WILLIS TEAM PC $199,000Active1 beds 1 baths860 sq. ft.
514 Birch Tree Lane, Michigan City, IN 46360
MLS# 836242Listed by: COLDWELL BANKER REALTY $99,500Pending3 beds 1 baths1,538 sq. ft.
611 W 9th Street, Michigan City, IN 46360
MLS# 836238Listed by: @PROPERTIES/CHRISTIE'S INTL RE $749,000Active3 beds 2 baths2,602 sq. ft.
17 Angle Road, Michiana Shores, IN 46360
MLS# 836141Listed by: COLDWELL BANKER REALTY $179,000Active3 beds 2 baths1,642 sq. ft.
118 Jackson Street, Michigan City, IN 46360
MLS# 836117Listed by: COLDWELL BANKER REALTY $199,900Active3 beds 2 baths1,820 sq. ft.
312 S Dickson Street, Michigan City, IN 46360
MLS# 202610174Listed by: HOMES LAND & LAKES REALTY $289,900Active4 beds 3 baths2,080 sq. ft.
414 Holly Road, Michigan City, IN 46360
MLS# 836084Listed by: WEICHERT REALTORS, MERRION GRO $425,000Active3 beds 3 baths2,500 sq. ft.
218 Woodsview Street, Michigan City, IN 46360
MLS# 835932Listed by: @PROPERTIES/CHRISTIE'S INTL RE $229,000Pending4 beds 2 baths2,175 sq. ft.
122 Memorial Drive, Michigan City, IN 46360
MLS# 835747Listed by: MTM REALTY GROUP $600,000Pending3 beds 2 baths1,378 sq. ft.
10310 Grand Beach Road, Michigan City, IN 46360
MLS# 835215Listed by: @PROPERTIES/CHRISTIE'S INTL RE $239,000Pending2 beds 2 baths1,418 sq. ft.
162 Indian Rdg Drive, Michigan City, IN 46360
MLS# 835594Listed by: COLDWELL BANKER REALTY $30,000Active0.52 Acres
0 Dahlia Street, Michigan City, IN 46360
MLS# 835589Listed by: BLACKROCK REAL ESTATE SERVICES $70,000Active4 beds 3 baths2,086 sq. ft.
1621 W 10th Street, Michigan City, IN 46360
MLS# 835366Listed by: COLDWELL BANKER REALTY $239,900Active3 beds 2 baths1,716 sq. ft.
122 Top Flight Road, Michigan City, IN 46360
MLS# 835327Listed by: PROPERTY MANAGEMENT OF NWI, LL $30,000Active0.19 Acres
0 Roberts Avenue, Beverly Shores, IN 46301
MLS# 835315Listed by: PARADIGM REALTY SOLUTIONS, LLC $15,000Active0.17 Acres
0 Millicent Avenue, Beverly Shores, IN 46360
MLS# 835228Listed by: PARADIGM REALTY SOLUTIONS, LLC $965,000Active4 beds 5 baths2,856 sq. ft.
206 Hilltop Avenue, Michigan City, IN 46360
MLS# 835168Listed by: COLDWELL BANKER MARKET CONNECT $557,900Active3 beds 2 baths1,692 sq. ft.
10290 Old Grand Beach Road, Michigan City, IN 46360
MLS# 835147Listed by: MTM REALTY GROUP- Open Sat, 11:30am to 1pm
 $234,900Active4 beds 3 baths2,142 sq. ft.
120 Grace Street, Michigan City, IN 46360
MLS# 835042Listed by: COLDWELL BANKER REALTY  $499,000Active3 beds 2 baths1,540 sq. ft.
514 E Bellevue Avenue, Beverly Shores, IN 46301
MLS# 834975Listed by: ARLENE BEGLIN REAL ESTATE $155,000Active0.51 Acres
0 Shorewood, Michigan City, IN 46360
MLS# 834969Listed by: @PROPERTIES/CHRISTIE'S INTL RE $249,900Pending3 beds 2 baths1,572 sq. ft.
726 Freyer Road, Michigan City, IN 46360
MLS# 834940Listed by: REALTY EXECUTIVES PREMIER $899,000Active3 beds 4 baths2,544 sq. ft.
1 Marine Drive #1&3, Michigan City, IN 46360
MLS# 834786Listed by: CENTURY 21 CIRCLE $210,000Active3 beds 2 baths980 sq. ft.
3640 Henry Street, Michigan City, IN 46360
MLS# 834712Listed by: BANGA REALTY, LLC $309,900Active3 beds 2 baths2,395 sq. ft.
3007 Maple Street, Michigan City, IN 46360
MLS# 834535Listed by: SERAMUR PROPERTIES, LLC $149,000Active3 beds 2 baths1,816 sq. ft.
132 Hendricks Street, Michigan City, IN 46360
MLS# 834463Listed by: COLDWELL BANKER REAL ESTATE GR $649,900Active14.11 Acres
4211 Franklin Street, Michigan City, IN 46360
MLS# 834427Listed by: REALTY EXECUTIVES PREMIER $199,000Active3 beds 2 baths1,518 sq. ft.
1803 Tennessee Street, Michigan City, IN 46360
MLS# 834392Listed by: RE/MAX DIAMOND PROPERTIES $99,000Active-- beds -- baths
2109 Ohio Street, Michigan City, IN 46360
MLS# 834383Listed by: MTM REALTY GROUP $214,900Pending3 beds 2 baths2,592 sq. ft.
119 Claire Street, Michigan City, IN 46360
MLS# 834360Listed by: RILEY REALTY & ASSOCIATES LLC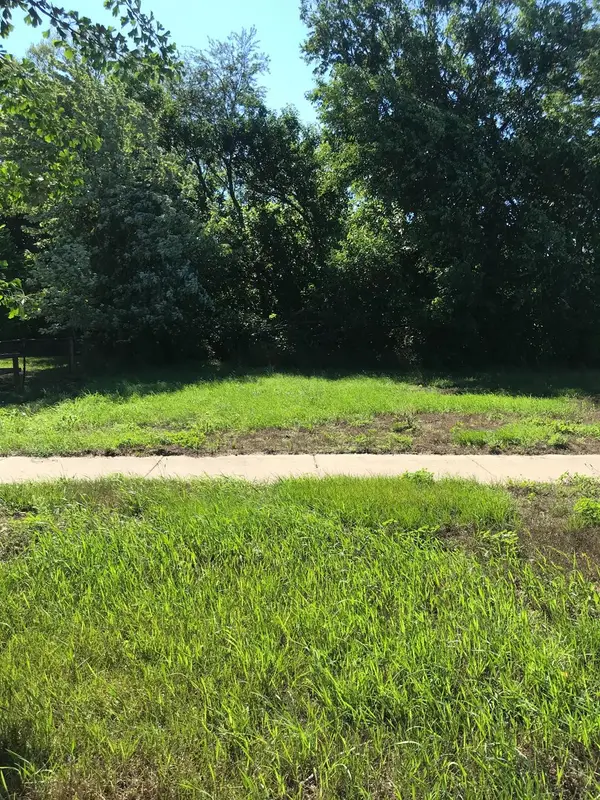 $15,000Active0.1 Acres
0 Willard Avenue, Michigan City, IN 46360
MLS# 834277Listed by: BLACKROCK REAL ESTATE SERVICES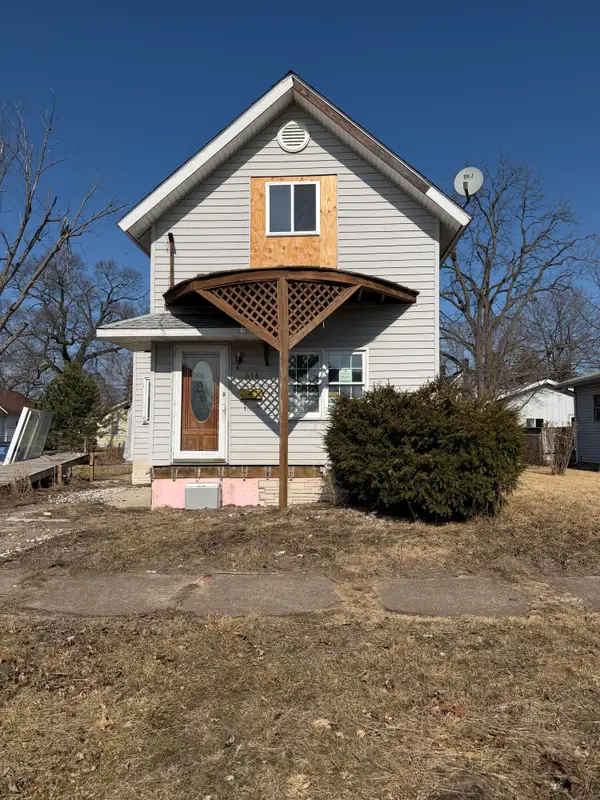 $83,500Active3 beds 1 baths1,261 sq. ft.
618 Dupage Street, Michigan City, IN 46360
MLS# 834262Listed by: BHHS INDIANA REALTY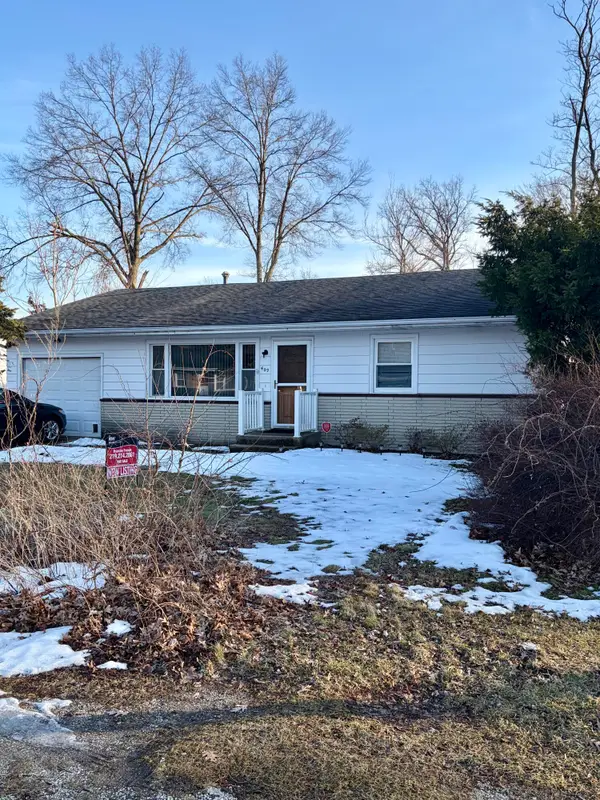 $225,000Active3 beds 2 baths1,228 sq. ft.
409 Holly Road, Michigan City, IN 46360
MLS# 834166Listed by: KELLER WILLIAMS REALTY SWM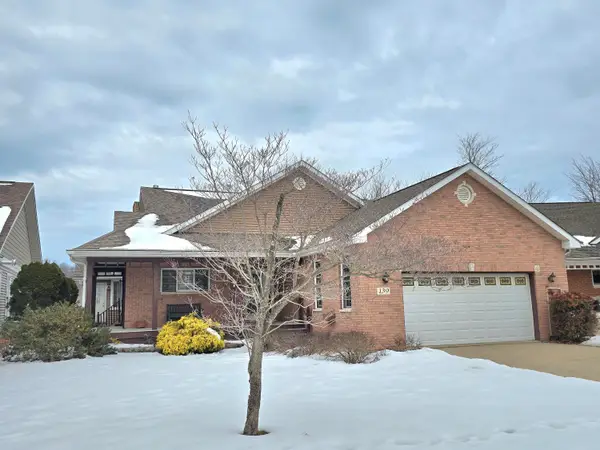 $499,900Active3 beds 2 baths1,904 sq. ft.
139 Shorewood Drive, Michigan City, IN 46360
MLS# 834103Listed by: WEICHERT REALTORS, MERRION GRO $293,000Active3 beds 2 baths2,344 sq. ft.
406 Bolka Avenue, Michigan City, IN 46360
MLS# 834080Listed by: COLDWELL BANKER REALTY $279,900Pending3 beds 2 baths1,478 sq. ft.
1524 Woodland Avenue, Michigan City, IN 46360
MLS# 833865Listed by: @PROPERTIES/CHRISTIE'S INTL RE $279,900Pending3 beds 2 baths1,478 sq. ft.
1528 Woodland, Michigan City, IN 46360
MLS# 833866Listed by: @PROPERTIES/CHRISTIE'S INTL RE $540,000Pending6 beds 4 baths
1524-28 Woodland Avenue, Michigan City, IN 46360
MLS# 833911Listed by: @PROPERTIES/CHRISTIE'S INTL RE- $237,000Active20 Acres
0 N Frontage Road, Michigan City, IN 46360
MLS# 833948Listed by: WEICHERT REALTORS, MERRION GRO 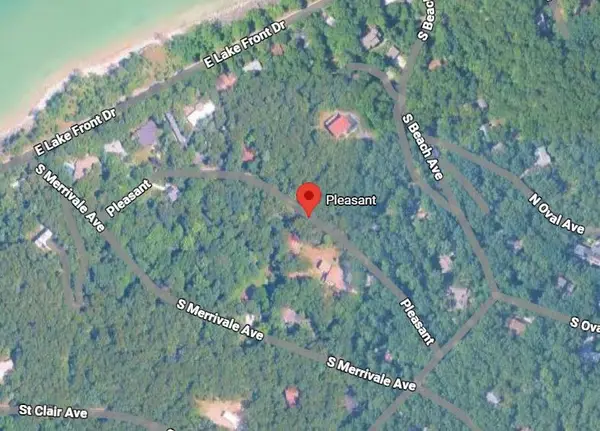 $149,000Active0.7 Acres
0 Pleasant Avenue, Beverly Shores, IN 46301
MLS# 833858Listed by: A.R.E. PARTNERS INC.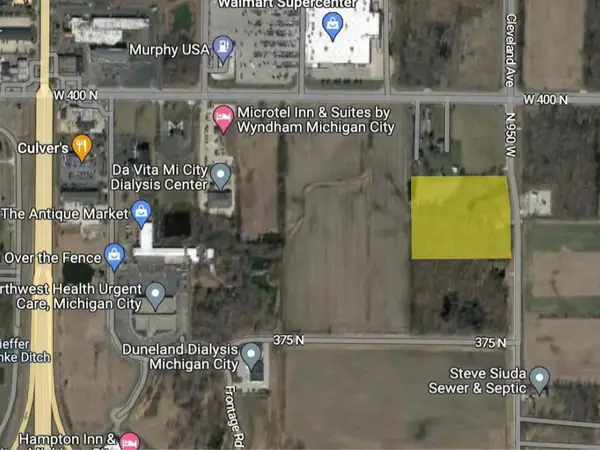 $350,000Active5.58 Acres
3886 N 950 W, Michigan City, IN 46360
MLS# 833834Listed by: COLDWELL BANKER REALTY $120,000Pending3 beds 3 baths1,360 sq. ft.
506 E Coolspring Avenue #C, Michigan City, IN 46360
MLS# 833736Listed by: CENTURY 21 CIRCLE $485,000Pending3 beds 1 baths2,034 sq. ft.
11111 W 100 N, Michigan City, IN 46360
MLS# 833572Listed by: CENTURY 21 CIRCLE $130,000Active4.56 Acres
0 W 10th Street, Michigan City, IN 46360
MLS# 833175Listed by: MCCOLLY REAL ESTATE $759,000Active69 Acres
0 Us Highway 421, Michigan City, IN 46360
MLS# 833039Listed by: MCCOLLY REAL ESTATE $169,000Active0.12 Acres
0 Arndt Street, Michigan City, IN 46360
MLS# 26002399Listed by: COLDWELL BANKER REALTY $825,000Active4 beds 3 baths2,922 sq. ft.
119 Blaine Street, Michigan City, IN 46360
MLS# 829112Listed by: @PROPERTIES/CHRISTIE'S INTL RE $379,900Active4 beds -- baths2,062 sq. ft.
123 Bellflower Drive, Michigan City, IN 46360
MLS# 832881Listed by: COPPER BAY REALTY, LLC $299,999Active3 beds 3 baths2,744 sq. ft.
710 Springland Avenue, Michigan City, IN 46360
MLS# 832631Listed by: @PROPERTIES/CHRISTIE'S INTL RE $349,999Pending1 beds 1 baths824 sq. ft.
2 Marine Drive #2, Michigan City, IN 46360
MLS# 832600Listed by: NEW CHAPTER REAL ESTATE $585,000Active5 beds 3 baths3,866 sq. ft.
1441 N Wozniak Road, Michigan City, IN 46360
MLS# 832609Listed by: COLDWELL BANKER REALTY $364,900Active4 beds -- baths1,882 sq. ft.
125 Bellflower Drive, Michigan City, IN 46360
MLS# 832433Listed by: COPPER BAY REALTY, LLC $22,000Active0.18 Acres
0 S S Carroll Avenue, Michigan City, IN 46360
MLS# 832307Listed by: CENTURY 21 CIRCLE $94,500Active0.31 Acres
0 Warren Road, Michigan City, IN 46360
MLS# 832284Listed by: @PROPERTIES/CHRISTIE'S INTL RE $250,000Active4 beds 2 baths2,020 sq. ft.
4446 Budlee Drive, Michigan City, IN 46360
MLS# 832278Listed by: COLDWELL BANKER REAL ESTATE GR $32,000Active0.12 Acres
826 Emily Street, Michigan City, IN 46360
MLS# 202605863Listed by: MCKINNIES REALTY, LLC $35,000Active1.67 Acres
0 Hwy 12, Michigan City, IN 46360
MLS# 832142Listed by: WEICHERT REALTORS, MERRION GRO $379,900Active3 beds 1 baths1,330 sq. ft.
432 Washington Park Boulevard, Michigan City, IN 46360
MLS# 831938Listed by: CENTURY 21 CIRCLE $329,900Pending4 beds 2 baths2,072 sq. ft.
123 Mayfield Drive, Michigan City, IN 46360
MLS# 833995Listed by: COPPER BAY REALTY, LLC $889,000Pending3 beds 3 baths2,801 sq. ft.
105 S Merrivale Avenue, Beverly Shores, IN 46301
MLS# 834716Listed by: ARLENE BEGLIN REAL ESTATE $590,000Pending2 beds 2 baths1,099 sq. ft.
101 W Michigan Boulevard, Michigan City, IN 46360
MLS# 830748Listed by: ENCORE SOTHEBY'S INTERNATIONAL $580,000Pending2 beds 2 baths1,072 sq. ft.
101 W Michigan Boulevard #922, Michigan City, IN 46360
MLS# 830751Listed by: ENCORE SOTHEBY'S INTERNATIONAL $899,000Active7 beds 7 baths
514 Lake Shore Drive, Michigan City, IN 46360
MLS# 830554Listed by: LISTING LEADERS EXECUTIVE RE $1,790,000Active5 beds 4 baths2,932 sq. ft.
1909 Lake Shore Drive, Long Beach, IN 46360
MLS# 830171Listed by: COLDWELL BANKER REALTY $150,000Active2.86 Acres
0 E Highway 212, Michigan City, IN 46360
MLS# 830041Listed by: MCCOLLY REAL ESTATE $115,000Active1.47 Acres
1601 Columbia Avenue, Michigan City, IN 46360
MLS# 829982Listed by: WEICHERT REALTORS, MERRION GRO $590,000Pending2 beds 2 baths1,054 sq. ft.
101 W Michigan Boulevard #719, Michigan City, IN 46360
MLS# 829488Listed by: ENCORE SOTHEBY'S INTERNATIONAL $150,000Active0.17 Acres
123 Blaine Street, Michigan City, IN 46360
MLS# 829028Listed by: @PROPERTIES/CHRISTIE'S INTL RE $2,800,000Active4 beds 4 baths3,481 sq. ft.
3 Lilac Lane, Grand Beach, MI 49117
MLS# 25041240Listed by: BERKSHIRE HATHAWAY HOMESERVICES CHICAGO $374,900Active3 beds 1 baths1,196 sq. ft.
802 Washington Park Boulevard, Michigan City, IN 46360
MLS# 828218Listed by: BHHS INDIANA REALTY $159,900Active2.4 Acres
0 W Us Hwy 12, Michigan City, IN 46360
MLS# 827555Listed by: MCCOLLY REAL ESTATE $90,000Active3 beds 2 baths
800 212 Highway #C5N, Michigan City, IN 46360
MLS# 12465013Listed by: RE/MAX ACTION $410,000Active2 beds 2 baths1,056 sq. ft.
2022 Bellevire Avenue, Long Beach, IN 46360
MLS# 826780Listed by: WEICHERT REALTORS, MERRION GRO $1,250,000Pending84 Acres
V/l N 600 W, Michigan City, IN 46360
MLS# 835686Listed by: INDIANA LAND AND LIFESTYLE $849,000Active5 beds 4 baths2,019 sq. ft.
110 Arndt Street, Michigan City, IN 46360
MLS# 825213Listed by: BERKSHIRE HATHAWAY HOMESERVICE $640,000Pending2 beds 2 baths1,095 sq. ft.
101 W Michigan Boulevard #1123, Michigan City, IN 46360
MLS# 825864Listed by: ENCORE SOTHEBY'S INTERNATIONAL $580,000Pending2 beds 2 baths1,095 sq. ft.
101 W Michigan Boulevard #523, Michigan City, IN 46360
MLS# 825865Listed by: ENCORE SOTHEBY'S INTERNATIONAL $345,000Pending2 beds 2 baths1,680 sq. ft.
1602 N 500 E, Michigan City, IN 46360
MLS# 825852Listed by: BLACKROCK REAL ESTATE SERVICES $549,000Pending5 beds 6 baths4,500 sq. ft.
717 Pine Street, Michigan City, IN 46360
MLS# 825822Listed by: COLDWELL BANKER REALTY $175,000Active2.94 Acres
0 Chicago Avenue, Michigan City, IN 46360
MLS# 825816Listed by: BLACKROCK REAL ESTATE SERVICES $430,000Pending1 beds 1 baths1,049 sq. ft.
101 W Michigan Boulevard #315, Michigan City, IN 46360
MLS# 824745Listed by: ENCORE SOTHEBY'S INTERNATIONAL $30,000Active0.19 Acres
2102 Plum Street, Michigan City, IN 46360
MLS# 824474Listed by: COLDWELL BANKER REAL ESTATE GR- $895,000Active4 beds 4 baths2,518 sq. ft.
2019 Silvertip Lane, Unknown, IN 46360
MLS# 69025010272Listed by: @PROPERTIES CHRISTIE'S INTERNATIONAL R.E.  $215,000Active3 beds 1 baths1,729 sq. ft.
8343 W Pahs Road, Michigan City, IN 46360
MLS# 833835Listed by: LAPORTE COUNTY REALTY, INC. $3,200,000Active6.3 Acres
600 E 2nd Street, Michigan City, IN 46360
MLS# 824124Listed by: KELLER WILLIAMS REALTY SWM $950,000Active0.7 Acres
611 E Lake Front Drive, Beverly Shores, IN 46301
MLS# 824100Listed by: @PROPERTIES/CHRISTIE'S INTL RE $200,000Active3 beds 1 baths960 sq. ft.
4851 N Clover Lane, Michigan City, IN 46360
MLS# 824002Listed by: BLACKROCK REAL ESTATE SERVICES $420,000Active3 beds 1 baths3,534 sq. ft.
1941 N Shebel Road, Michigan City, IN 46360
MLS# 823698Listed by: CENTURY 21 CIRCLE $610,000Pending2 beds 2 baths1,072 sq. ft.
101 W Michigan Boulevard #1222, Michigan City, IN 46360
MLS# 821898Listed by: ENCORE SOTHEBY'S INTERNATIONAL $590,000Pending2 beds 2 baths1,095 sq. ft.
101 W Michigan Boulevard #623, Michigan City, IN 46360
MLS# 819388Listed by: ENCORE SOTHEBY'S INTERNATIONAL $380,000Pending1 beds 1 baths760 sq. ft.
101 W Michigan Boulevard #618, Michigan City, IN 46360
MLS# 819390Listed by: ENCORE SOTHEBY'S INTERNATIONAL $1,050,000Active21.81 Acres
0 W 400 N, Michigan City, IN 46360
MLS# 818882Listed by: COLDWELL BANKER REALTY $440,000Pending1 beds 2 baths760 sq. ft.
101 W Michigan Boulevard #1218, Michigan City, IN 46360
MLS# 818657Listed by: ENCORE SOTHEBY'S INTERNATIONAL $506,000Pending2 beds 2 baths1,072 sq. ft.
101 W Michigan Boulevard #622, Michigan City, IN 46360
MLS# 818658Listed by: ENCORE SOTHEBY'S INTERNATIONAL $777,000Pending3 beds 3 baths1,602 sq. ft.
101 W Michigan Boulevard #1124, Michigan City, IN 46360
MLS# 818223Listed by: ENCORE SOTHEBY'S INTERNATIONAL $950,000Pending3 beds 3 baths1,540 sq. ft.
101 W Michigan Boulevard #725, Michigan City, IN 46360
MLS# 818213Listed by: ENCORE SOTHEBY'S INTERNATIONAL $400,000Pending1 beds 2 baths760 sq. ft.
101 W Michigan Boulevard #818, Michigan City, IN 46360
MLS# 818215Listed by: ENCORE SOTHEBY'S INTERNATIONAL $50,000Active0.52 Acres
0 California Street, Michigan City, IN 46360
MLS# 818181Listed by: COLDWELL BANKER REALTY $2,500,000Pending6 beds 5 baths3,309 sq. ft.
101 W Michigan Boulevard #1225, Michigan City, IN 46360
MLS# 817689Listed by: ENCORE SOTHEBY'S INTERNATIONAL $500,000Pending2 beds 2 baths1,099 sq. ft.
101 W Michigan Boulevard #620, Michigan City, IN 46360
MLS# 817684Listed by: ENCORE SOTHEBY'S INTERNATIONAL $787,000Pending3 beds 3 baths1,602 sq. ft.
101 W Michigan Boulevard #1224, Michigan City, IN 46360
MLS# 817685Listed by: ENCORE SOTHEBY'S INTERNATIONAL $149,000Active5 beds 1 baths1,727 sq. ft.
105 Hancock Avenue, Michigan City, IN 46360
MLS# 817470Listed by: RE/MAX LIFESTYLES $710,000Pending3 beds 3 baths1,637 sq. ft.
101 W Michigan Boulevard #610, Michigan City, IN 46360
MLS# 817074Listed by: ENCORE SOTHEBY'S INTERNATIONAL $526,000Pending2 beds 2 baths1,072 sq. ft.
101 W Michigan Boulevard #822, Michigan City, IN 46360
MLS# 816880Listed by: ENCORE SOTHEBY'S INTERNATIONAL $535,000Pending2 beds 2 baths1,072 sq. ft.
101 W Michigan Boulevard #1022, Michigan City, IN 46360
MLS# 816882Listed by: ENCORE SOTHEBY'S INTERNATIONAL $486,000Pending2 beds 2 baths1,072 sq. ft.
101 W Michigan Boulevard #422, Michigan City, IN 46360
MLS# 816510Listed by: ENCORE SOTHEBY'S INTERNATIONAL $560,000Pending2 beds 3 baths1,314 sq. ft.
101 W Michigan Boulevard #512, Michigan City, IN 46360
MLS# 816506Listed by: ENCORE SOTHEBY'S INTERNATIONAL $490,000Pending2 beds 2 baths1,043 sq. ft.
101 W Michigan Boulevard #608, Michigan City, IN 46360
MLS# 816508Listed by: ENCORE SOTHEBY'S INTERNATIONAL $587,000Pending2 beds 2 baths1,095 sq. ft.
101 W Michigan Boulevard #1023, Michigan City, IN 46360
MLS# 816509Listed by: ENCORE SOTHEBY'S INTERNATIONAL $390,000Pending1 beds 2 baths760 sq. ft.
101 W Michigan Boulevard #718, Michigan City, IN 46360
MLS# 816291Listed by: ENCORE SOTHEBY'S INTERNATIONAL $575,000Pending2 beds 2 baths1,095 sq. ft.
101 W Michigan Boulevard #1223, Michigan City, IN 46360
MLS# 816292Listed by: ENCORE SOTHEBY'S INTERNATIONAL $750,000Pending3 beds 3 baths1,602 sq. ft.
101 W Michigan Boulevard #1024, Michigan City, IN 46360
MLS# 816293Listed by: ENCORE SOTHEBY'S INTERNATIONAL $570,000Pending2 beds 3 baths1,314 sq. ft.
101 W Michigan Boulevard #612, Michigan City, IN 46360
MLS# 816288Listed by: ENCORE SOTHEBY'S INTERNATIONAL $385,000Pending1 beds 1 baths828 sq. ft.
101 W Michigan Boulevard #503, Michigan City, IN 46360
MLS# 816290Listed by: ENCORE SOTHEBY'S INTERNATIONAL $545,000Pending2 beds 2 baths1,072 sq. ft.
101 W Michigan Boulevard #1122, Michigan City, IN 46360
MLS# 816042Listed by: ENCORE SOTHEBY'S INTERNATIONAL
Local realty services provided by:CENTURY 21 Circle, CENTURY 21 Scheetz, CENTURY 21 Broughton Team, CENTURY 21 Curran & Oberski, CENTURY 21 Realty North, CENTURY 21 White House Realty
Based on information submitted to the MLS GRID as of June 24, 2026. All data is obtained from various sources and may not have been verified by broker or MLS GRID. Supplied Open House Information is subject to change without notice. All information should be independently reviewed and verified for accuracy. Properties may or may not be listed by the office/agent presenting the information. IDX information is provided exclusively for consumers’ personal non-commercial use, that it may not be used for any purpose other than to identify prospective properties consumers may be interested in purchasing, that the data is deemed reliable but is not guaranteed by MLS GRID, and that the use of the MLS GRID Data may be subject to an end user license agreement prescribed by the Member Participant’s applicable MLS if any and as amended from time to time.
IRMLS information is provided exclusively for consumers' personal, non-commercial use and may not be used for any purpose other than to identify prospective properties consumers may be interested in purchasing. IRMLS Data is deemed reliable but is not guaranteed accurate by the MLS. IRMLS information provided by the Indiana Regional MLS. Copyright 2026 Indiana Regional MLS LLC.
Copyright 2026 Midwest Real Estate Data LLC. All rights reserved. The data relating to real estate for sale on this web site comes in part from the Broker Reciprocity Program of the Midwest Real Estate Data LLC. Listing information is deemed reliable but not guaranteed. MLSNI Member Broker: Barbara K. Broughton
Popular searches near 46360
Popular neighborhoods near 46360
- Central Valparaiso, Valparaiso homes for sale
- Downtown Valparaiso, Valparaiso homes for sale
- Far Northwest, South Bend homes for sale
- Far West Side, South Bend homes for sale
- Hegewisch, Chicago homes for sale
- Indiana Harbor, East Chicago homes for sale
- Kennedy Park, South Bend homes for sale
- LaSalle, South Bend homes for sale
- Lasalle Park, South Bend homes for sale
- Lincoln Way, South Bend homes for sale
- Near West Side, South Bend homes for sale
- Northside Valparaiso, Valparaiso homes for sale
- Portage Crossing, South Bend homes for sale
- Rum Village, South Bend homes for sale
- Sand Creek Country Club, Chesterton homes for sale
- South Gary, Gary homes for sale
- Southside Valparaiso, Valparaiso homes for sale
- Upper West Side Valparaiso, Valparaiso homes for sale
- Washington Park, Michigan City homes for sale
- Westside, South Bend homes for sale
Counties near Michigan City, 46360
- Berrien County homes for sale
- Cass County homes for sale
- Cook County homes for sale
- DuPage County homes for sale
- Elkhart County homes for sale
- Fulton County homes for sale
- Jasper County homes for sale
- Kankakee County homes for sale
- Kosciusko County homes for sale
- Lake County homes for sale
- Lake County homes for sale
- LaPorte County homes for sale
- Marshall County homes for sale
- Newton County homes for sale
- Porter County homes for sale
- Pulaski County homes for sale
- St. Joseph County homes for sale
- Starke County homes for sale
- Van Buren County homes for sale
- Will County homes for sale
Protect your home and budget from life's surprises with an Assurant Home Warranty, backed by a partner that supports you through every step of homeownership. Explore Plans.
©2026 Century 21 Real Estate LLC. All rights reserved. CENTURY 21®, the CENTURY 21 Logo and C21® are service marks owned by Century 21 Real Estate LLC. Century 21 Real Estate LLC fully supports the principles of the Fair Housing Act and the Equal Opportunity Act. Each office is independently owned and operated. Listing information is deemed reliable but not guaranteed accurate.