- Adventure District, Oklahoma City properties for sale
- Bartlett, Oklahoma City properties for sale
- Deep Deuce, Oklahoma City properties for sale
- East Wilshire Heights, Oklahoma City properties for sale
- Garden Neighborhood Council, Oklahoma City properties for sale
- Green Pastures, Spencer properties for sale
- Lincoln Terrace, Oklahoma City properties for sale
- Martin Luther King, Oklahoma City properties for sale
- Medical Community, Oklahoma City properties for sale
- North Creston Hills, Oklahoma City properties for sale
- Northeast Oklahoma City, Edmond properties for sale
- Oakcliff, Oklahoma City properties for sale
- Oklahoma State Capitol Park, Oklahoma City properties for sale
- Park Estates, Oklahoma City properties for sale
- Parkview, Oklahoma City properties for sale
- Pasadena Heights, Oklahoma City properties for sale
- Pitts Park, Oklahoma City properties for sale
- Ross Heights, Oklahoma City properties for sale
- Shidler-Wheeler, Oklahoma City properties for sale
- Southeast Oklahoma City, Oklahoma City properties for sale
Nicoma Park, OK - homes for sale
13 of 13 results displayed
- New
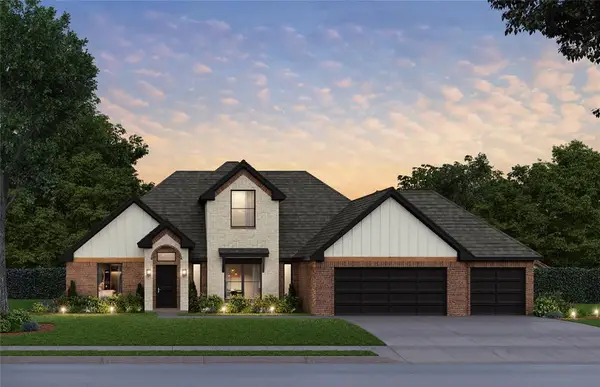 $409,502Active3 beds 2 baths1,970 sq. ft.
15452 NE 11th Street, Choctaw, OK 73020
MLS# 1208112Listed by: CENTRAL OKLAHOMA REAL ESTATE - New
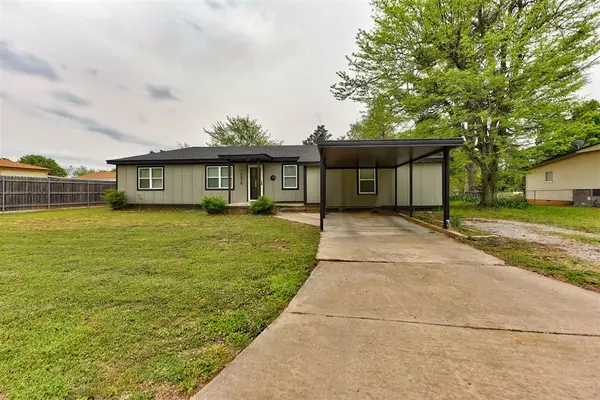 $260,000Active4 beds 3 baths1,831 sq. ft.
10834 NE 17th Street, Oklahoma City, OK 73141
MLS# 1207159Listed by: COPPER CREEK REAL ESTATE 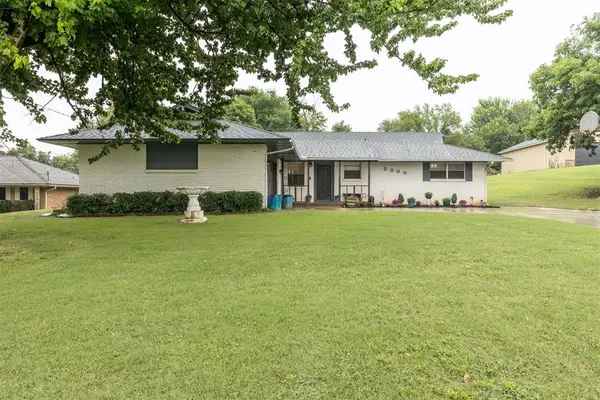 $322,000Active3 beds 2 baths2,299 sq. ft.
2000 N Anderson Road, Choctaw, OK 73020
MLS# 1207607Listed by: KING REAL ESTATE GROUP $230,000Active2 beds 2 baths1,236 sq. ft.
1940 Ives Way, Choctaw, OK 73020
MLS# 1205507Listed by: HOMEWORX, LLC $238,900Active3 beds 2 baths1,333 sq. ft.
11300 Stewart Avenue, Choctaw, OK 73020
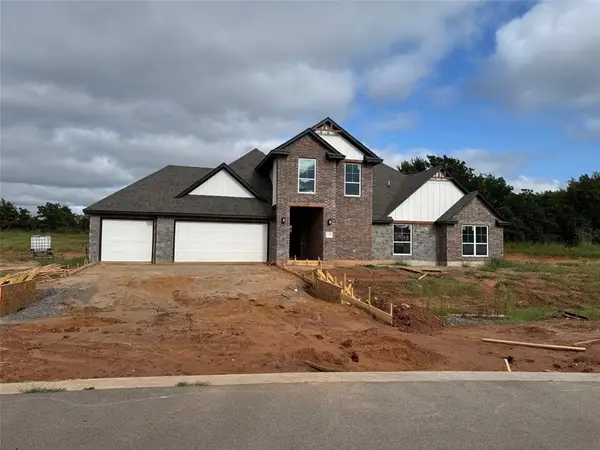
MLS# 1204717Listed by: METRO MARK REALTORS $699,500Active4 beds 4 baths3,266 sq. ft.
12120 Eastwood Drive, Choctaw, OK 73020
MLS# 1200796Listed by: PRESTIGE REAL ESTATE SERVICES $367,478Active3 beds 2 baths1,833 sq. ft.
1309 Lighthorsemen Way, Choctaw, OK 73020
MLS# 1196959Listed by: CENTRAL OKLAHOMA REAL ESTATE- New
 $383,233Active3 beds 2 baths1,833 sq. ft.
1300 Lighthorsemen Way, Choctaw, OK 73020
MLS# 1209686Listed by: CENTRAL OKLAHOMA REAL ESTATE  $395,300Active3 beds 3 baths2,221 sq. ft.
1313 Lighthorsemen Way, Choctaw, OK 73020
MLS# 1204639Listed by: CENTRAL OKLAHOMA REAL ESTATE $495,000Active3 beds 2 baths1,300 sq. ft.
11708 E Draper Avenue, Choctaw, OK 73020
MLS# 1182749Listed by: PRESTIGE REAL ESTATE SERVICES $357,190Active3 beds 2 baths1,876 sq. ft.
1316 Lighthorsemen Way, Choctaw, OK 73020
MLS# 1206443Listed by: CENTRAL OKLAHOMA REAL ESTATE $410,364Active3 beds 3 baths2,221 sq. ft.
15482 NE 11th Street, Choctaw, OK 73020
MLS# 1204648Listed by: CENTRAL OKLAHOMA REAL ESTATE $339,990Active3 beds 2 baths1,689 sq. ft.
15422 NE 11th Street, Choctaw, OK 73020
MLS# 1174843Listed by: CENTRAL OK REAL ESTATE GROUP
Local realty services provided by:CENTURY 21 Judge Fite Company
Neighborhoods near Nicoma Park, OK
Zip codes near Nicoma Park, OK
- 73013 properties for sale
- 73020 properties for sale
- 73045 properties for sale
- 73049 properties for sale
- 73084 properties for sale
- 73104 properties for sale
- 73105 properties for sale
- 73110 properties for sale
- 73111 properties for sale
- 73115 properties for sale
- 73117 properties for sale
- 73121 properties for sale
- 73129 properties for sale
- 73130 properties for sale
- 73131 properties for sale
- 73135 properties for sale
- 73141 properties for sale
- 73150 properties for sale
- 73151 properties for sale
- 73165 properties for sale
Popular searches near Nicoma Park, OK
- Arcadia properties for sale
- Choctaw properties for sale
- Del City properties for sale
- Edmond properties for sale
- Forest Park properties for sale
- Harrah properties for sale
- Jones properties for sale
- McLoud properties for sale
- Midwest City properties for sale
- Moore properties for sale
- Newalla properties for sale
- Nichols Hills properties for sale
- North Cleveland properties for sale
- Oklahoma City properties for sale
- Oklahoma City Northeast properties for sale
- Oklahoma City Southeast properties for sale
- Oklahoma City Southwest properties for sale
- Spencer properties for sale
- The Village properties for sale
- Valley Brook properties for sale
©2026 Century 21 Real Estate LLC. All rights reserved. CENTURY 21®, the CENTURY 21 Logo and C21® are service marks owned by Century 21 Real Estate LLC. Century 21 Real Estate LLC fully supports the principles of the Fair Housing Act and the Equal Opportunity Act. Each office is independently owned and operated. Listing information is deemed reliable but not guaranteed accurate.
©2026 Century 21 Real Estate LLC. All rights reserved. CENTURY 21®, the CENTURY 21 Logo and C21® are service marks owned by Century 21 Real Estate LLC. Century 21 Real Estate LLC fully supports the principles of the Fair Housing Act and the Equal Opportunity Act. Each office is independently owned and operated. Listing information is deemed reliable but not guaranteed accurate.