- Bradford Park, Springfield homes for sale
- Brentwood, Springfield homes for sale
- Delaware, Springfield homes for sale
- Ewing, Springfield homes for sale
- Fassnight, Springfield homes for sale
- Kickapoo, Springfield homes for sale
- Lake Springfield, Springfield homes for sale
- Mark Twain, Springfield homes for sale
- Meador Park, Springfield homes for sale
- Millwood, East Clay A homes for sale
- Oak Grove, Springfield homes for sale
- Parkcrest, Springfield homes for sale
- Phelps, Springfield homes for sale
- Primrose, Springfield homes for sale
- Seminole, Springfield homes for sale
- Sequiota, Springfield homes for sale
- Southern Hills, Springfield homes for sale
- Southside, Springfield homes for sale
- University Heights, Springfield homes for sale
- West Central, Springfield homes for sale
Nixa, MO - homes for sale
252 of 252 results displayed
- New
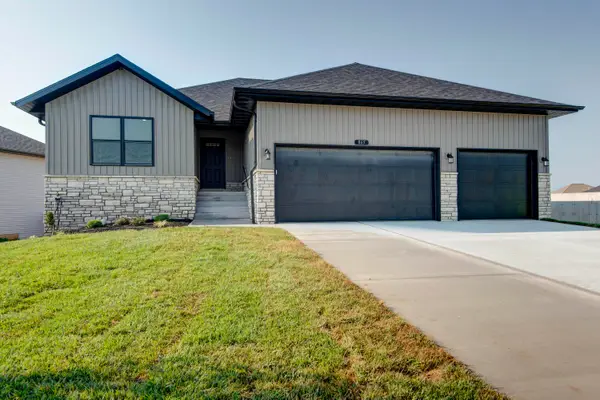
 $439,900Active5 beds 3 baths3,256 sq. ft.
625 W Arbor Glenn Drive, Nixa, MO 65714
MLS# 60330210Listed by: MURNEY ASSOCIATES - PRIMROSE - New
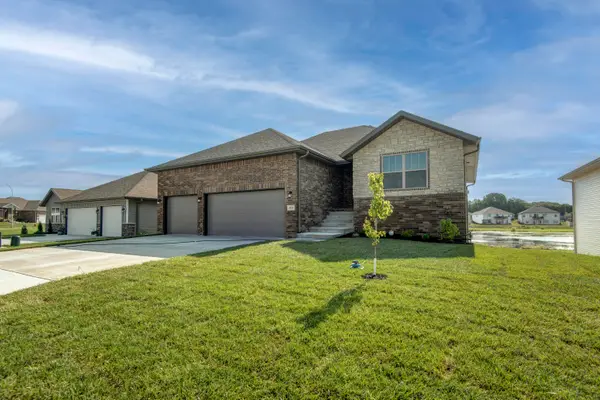
 $306,900Active3 beds 2 baths1,610 sq. ft.
650 W Castor Loop, Nixa, MO 65714
MLS# 60330211Listed by: MURNEY ASSOCIATES - PRIMROSE - New
 $439,900Active5 beds 3 baths3,336 sq. ft.
629 W Arbor Glenn Drive, Nixa, MO 65714
MLS# 60330212Listed by: MURNEY ASSOCIATES - PRIMROSE - New
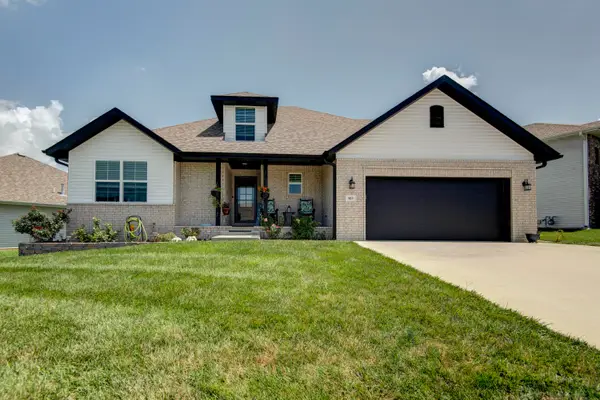
 $439,900Active5 beds 3 baths3,256 sq. ft.
633 W Arbor Glenn Drive, Nixa, MO 65714
MLS# 60330214Listed by: MURNEY ASSOCIATES - PRIMROSE - New
 $306,900Active3 beds 2 baths1,608 sq. ft.
938 S Pindall Lane, Nixa, MO 65714
MLS# 60330215Listed by: MURNEY ASSOCIATES - PRIMROSE - New
 $339,900Active4 beds 2 baths1,861 sq. ft.
934 S Pindall Lane, Nixa, MO 65714
MLS# 60330216Listed by: MURNEY ASSOCIATES - PRIMROSE - New
 $306,900Active3 beds 2 baths1,608 sq. ft.
965 S Pindall Lane, Nixa, MO 65714
MLS# 60330217Listed by: MURNEY ASSOCIATES - PRIMROSE - New
 $339,900Active4 beds 2 baths1,861 sq. ft.
953 S Pindall Lane, Nixa, MO 65714
MLS# 60330218Listed by: MURNEY ASSOCIATES - PRIMROSE - Open Sun, 1 to 3pmNew
 $195,000Active3 beds 1 baths1,314 sq. ft.
102 E Scott Wayne Drive, Nixa, MO 65714
MLS# 60330197Listed by: KELLER WILLIAMS LOCAL - New
 $524,900Active4 beds 4 baths2,562 sq. ft.
739 N Fox Hill Circle, Nixa, MO 65714
MLS# 60330148Listed by: ALBERS REAL ESTATE GROUP - New
 $324,000Active3 beds 2 baths1,531 sq. ft.
1312 N Maxine Avenue, Nixa, MO 65714
MLS# 60330149Listed by: KELLER WILLIAMS LOCAL - New
 $395,000Active3 beds 2 baths1,779 sq. ft.
800 E Kings Mead Circle #Unit 3, Nixa, MO 65714
MLS# 60330060Listed by: ASSIST 2 SELL - New
 $311,900Active3 beds 2 baths1,608 sq. ft.
648 W Brook Hollow Road, Nixa, MO 65714
MLS# 60330079Listed by: MURNEY ASSOCIATES - PRIMROSE - New
 $349,900Active4 beds 2 baths1,861 sq. ft.
664 W Brook Hollow Road, Nixa, MO 65714
MLS# 60330080Listed by: MURNEY ASSOCIATES - PRIMROSE - New
 $349,900Active4 beds 2 baths1,861 sq. ft.
668 W Brook Hollow Road, Nixa, MO 65714
MLS# 60330081Listed by: MURNEY ASSOCIATES - PRIMROSE - New
 $311,900Active3 beds 2 baths1,608 sq. ft.
930 S Pindall Lane, Nixa, MO 65714
MLS# 60330082Listed by: MURNEY ASSOCIATES - PRIMROSE - New
 $415,000Active3 beds 2 baths1,806 sq. ft.
311 N Estes Street, Nixa, MO 65714
MLS# 60329917Listed by: EXP REALTY LLC - New
 $350,000Active4 beds 3 baths2,436 sq. ft.
617 E Southeast Hills Court, Nixa, MO 65714
MLS# 60329893Listed by: ALPHA REALTY MO, LLC - New
 $339,000Active4 beds 3 baths2,752 sq. ft.
211 N Marie Street, Nixa, MO 65714
MLS# 60329777Listed by: CALLAWAY PROPERTY GROUP - Open Sun, 2 to 4pmNew
 $675,000Active4 beds 3 baths3,572 sq. ft.
1657 S Timber Lake Drive, Nixa, MO 65714
MLS# 60329794Listed by: JIM GARLAND REAL ESTATE - New
 $224,900Active3 beds 1 baths1,456 sq. ft.
803 Lone Oak Circle, Nixa, MO 65714
MLS# 60329800Listed by: KELLER WILLIAMS LOCAL - New
 $259,000Active3 beds 2 baths1,437 sq. ft.
610 N Ellen Street, Nixa, MO 65714
MLS# 60329765Listed by: KELLER WILLIAMS TRI-LAKES - Open Sun, 1 to 3pmNew
 $255,000Active3 beds 2 baths1,419 sq. ft.
712 S Pinewood Lane, Nixa, MO 65714
MLS# 60329783Listed by: MURNEY ASSOCIATES - PRIMROSE  $340,000Pending4 beds 2 baths1,824 sq. ft.
1657 N Kingfisher Drive, Nixa, MO 65714
MLS# 60329775Listed by: GATEWAY REAL ESTATE TEAM LLC- New
 $325,000Active-- beds 2 baths
1265 1267 W Vintage Lane, Nixa, MO 65714
MLS# 60329762Listed by: KELLER WILLIAMS TRI-LAKES - New
 $319,900Active3 beds 3 baths2,096 sq. ft.
204 N Maplecrest Drive, Nixa, MO 65714
MLS# 60329751Listed by: ACTION REAL ESTATE - New
 $690,000Active5 beds 4 baths4,300 sq. ft.
691 N Fox Hill Circle, Nixa, MO 65714
MLS# 60329723Listed by: MURNEY ASSOCIATES - PRIMROSE - Open Sat, 1 to 2:30pmNew
 $315,000Active3 beds 2 baths1,523 sq. ft.
658 Greer Avenue, Nixa, MO 65714
MLS# 60329561Listed by: KELLER WILLIAMS LOCAL - New
 $474,999Active5 beds 3 baths3,554 sq. ft.
865 E Virginia Lane #Lot 187, Nixa, MO 65714
MLS# 60329563Listed by: MURNEY ASSOCIATES - PRIMROSE - Open Fri, 12 to 6pmNew
 $459,999Active5 beds 3 baths3,554 sq. ft.
851 E Virginia Lane #Lot 193, Nixa, MO 65714
MLS# 60329569Listed by: MURNEY ASSOCIATES - PRIMROSE 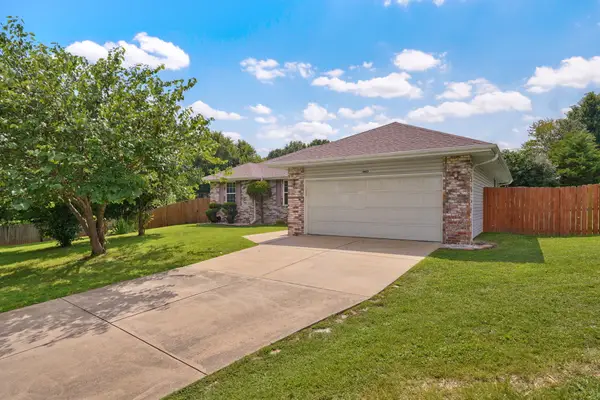 $250,000Pending3 beds 2 baths1,425 sq. ft.
1403 Windsor Court, Nixa, MO 65714
MLS# 60329529Listed by: KELLER WILLIAMS LOCAL- New
 $439,000Active4 beds 3 baths2,697 sq. ft.
813 E Brewer Avenue, Nixa, MO 65714
MLS# 60329335Listed by: MURNEY ASSOCIATES - PRIMROSE - New
 $749,900Active5 beds 3 baths3,158 sq. ft.
849 E Kerry Court, Nixa, MO 65714
MLS# 60329447Listed by: KELLER WILLIAMS LOCAL - New
 $329,900Active5 beds 3 baths2,118 sq. ft.
1145 E Manitou Court, Nixa, MO 65714
MLS# 60329426Listed by: KELLER WILLIAMS LOCAL - New
 $449,900Active5 beds 3 baths3,138 sq. ft.
1293 N Maxine Avenue, Nixa, MO 65714
MLS# 60329411Listed by: MURNEY ASSOCIATES - PRIMROSE  $275,000Pending3 beds 2 baths1,684 sq. ft.
503 Spruce Avenue, Nixa, MO 65714
MLS# 60325442Listed by: KELLER WILLIAMS LOCAL- New
 $410,000Active4 beds 3 baths2,180 sq. ft.
1496 S Alice Gayle Circle, Nixa, MO 65714
MLS# 60329390Listed by: ALPHA REALTY MO, LLC - New
 $257,000Active3 beds 2 baths1,387 sq. ft.
968 S Redwood Street, Nixa, MO 65714
MLS# 60329346Listed by: REECENICHOLS - SPRINGFIELD - New
 $429,900Active4 beds 2 baths2,142 sq. ft.
599 Penzance Drive, Nixa, MO 65714
MLS# 60329344Listed by: THE FIRM REAL ESTATE, LLC  $306,900Pending3 beds 2 baths1,608 sq. ft.
950 S Pindall Lane, Nixa, MO 65714
MLS# 60329218Listed by: MURNEY ASSOCIATES - PRIMROSE $190,000Pending3 beds 1 baths1,022 sq. ft.
209 W State Street, Nixa, MO 65714
MLS# 60329159Listed by: KELLER WILLIAMS LOCAL $305,000Pending-- beds 2 baths
Address Withheld By Seller, Nixa, MO 65714
MLS# 60329166Listed by: KELLER WILLIAMS LOCAL $159,000Pending5 beds 3 baths3,158 sq. ft.
207 N Gregg Road, Nixa, MO 65714
MLS# 60329139Listed by: ACTION REAL ESTATE $384,850Active4 beds 2 baths2,038 sq. ft.
734 S Wheaton Hills Drive #Lot 238, Nixa, MO 65714
MLS# 60328704Listed by: MURNEY ASSOCIATES - PRIMROSE $369,700Active4 beds 3 baths2,565 sq. ft.
734 S Wheaton Hills Drive #Lot 242, Nixa, MO 65714
MLS# 60329117Listed by: MURNEY ASSOCIATES - PRIMROSE $235,000Pending3 beds 2 baths1,575 sq. ft.
149 S Cedar Heights Drive, Nixa, MO 65714
MLS# 60329112Listed by: REECENICHOLS - BRANSON $1,150,000Pending5 beds 5 baths4,283 sq. ft.
403 W Declan Court, Nixa, MO 65714
MLS# 60329076Listed by: ALPHA REALTY MO, LLC- Open Sun, 2 to 4pm
 $304,900Active3 beds 2 baths1,491 sq. ft.
873 E Ozark Jubilee Drive, Nixa, MO 65714
MLS# 60329064Listed by: KELLER WILLIAMS LOCAL  $335,000Active4 beds 3 baths2,133 sq. ft.
206 N Cheyenne Valley Road, Nixa, MO 65714
MLS# 60328874Listed by: KELLER WILLIAMS LOCAL $635,900Pending4 beds 3 baths2,947 sq. ft.
856 E Edenmore Circle, Nixa, MO 65714
MLS# 60328916Listed by: ALPHA REALTY MO, LLC $249,900Pending3 beds 2 baths1,964 sq. ft.
17 Hillside Drive, Nixa, MO 65714
MLS# 60328905Listed by: KELLER WILLIAMS LOCAL $267,500Pending3 beds 2 baths1,618 sq. ft.
721 N Bluegill Street, Nixa, MO 65714
MLS# 60328907Listed by: MURNEY ASSOCIATES - PRIMROSE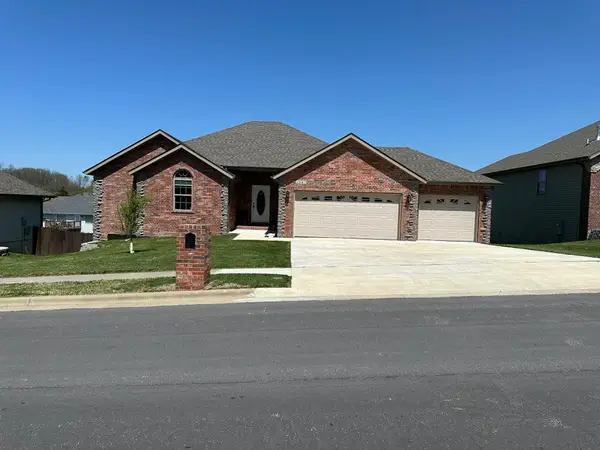 $439,900Active5 beds 4 baths3,432 sq. ft.
1087 E Daisy Falls Drive, Nixa, MO 65714
MLS# 60328840Listed by: KELLER WILLIAMS LOCAL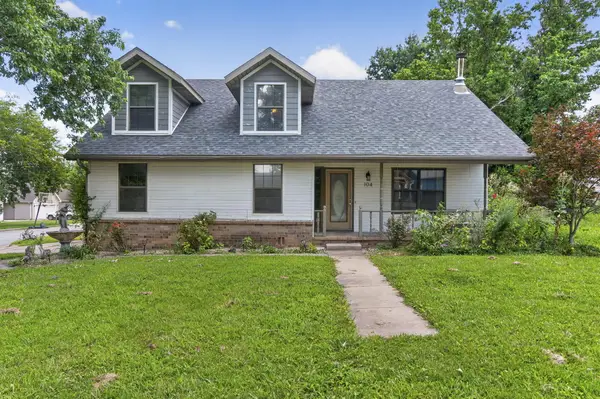 $199,900Pending3 beds 2 baths1,425 sq. ft.
104 N Market Street, Nixa, MO 65714
MLS# 60328822Listed by: KELLER WILLIAMS LOCAL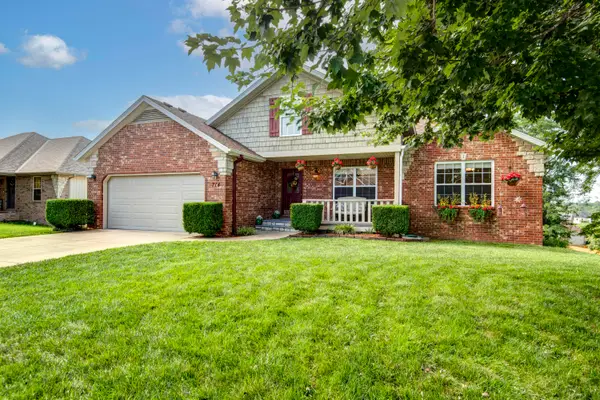 $435,000Pending6 beds 3 baths3,713 sq. ft.
714 River Rock Court, Nixa, MO 65714
MLS# 60328730Listed by: MURNEY ASSOCIATES - NIXA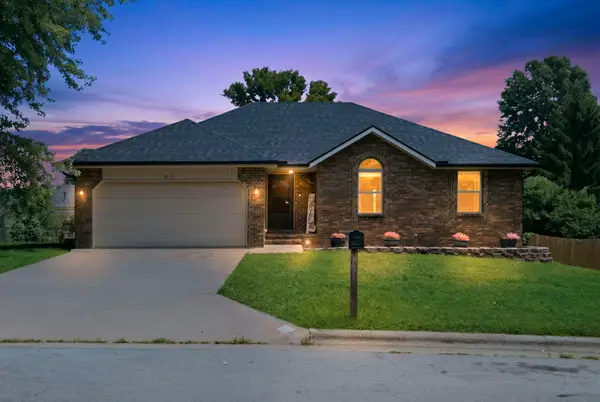 $320,000Active5 beds 3 baths2,514 sq. ft.
615 E Sunset Avenue, Nixa, MO 65714
MLS# 60328695Listed by: KELLER WILLIAMS LOCAL $343,500Active4 beds 2 baths1,758 sq. ft.
1099 E Lakota Street, Nixa, MO 65714
MLS# 60328672Listed by: AGENT MULDER REAL ESTATE, LLC $329,900Active3 beds 2 baths1,983 sq. ft.
1110 N Arlington Street, Nixa, MO 65714
MLS# 60328654Listed by: MURNEY ASSOCIATES - PRIMROSE $295,000Pending3 beds 2 baths1,550 sq. ft.
403 N Cheyenne Valley Road, Nixa, MO 65714
MLS# 60328633Listed by: RE/MAX HOUSE OF BROKERS $549,500Active5 beds 3 baths3,428 sq. ft.
1482 N Osburn Lane, Nixa, MO 65714
MLS# 60328577Listed by: KELLER WILLIAMS LOCAL $325,000Active3 beds 2 baths1,664 sq. ft.
939 E Hodgson Street, Nixa, MO 65714
MLS# 60328567Listed by: MURNEY ASSOCIATES - PRIMROSE- Open Sun, 2 to 4pm
 $284,900Active2 beds 2 baths1,480 sq. ft.
1352 N Sandy Creek Circle #Unit 3, Nixa, MO 65714
MLS# 60328457Listed by: STURDY REAL ESTATE  $215,000Active3 beds 2 baths1,008 sq. ft.
305 N Missouri Avenue, Nixa, MO 65714
MLS# 60328448Listed by: GERKEN & ASSOCIATES, INC.- Open Sun, 2 to 4pm
 $415,000Active4 beds 3 baths3,047 sq. ft.
647 N Althea Avenue, Nixa, MO 65714
MLS# 60328399Listed by: CANTRELL REAL ESTATE  $306,900Active3 beds 2 baths1,608 sq. ft.
990 S Foxboro Court, Nixa, MO 65714
MLS# 60328274Listed by: MURNEY ASSOCIATES - PRIMROSE $306,900Pending3 beds 2 baths1,608 sq. ft.
991 S Foxboro Court, Nixa, MO 65714
MLS# 60328276Listed by: MURNEY ASSOCIATES - PRIMROSE $349,900Pending4 beds 2 baths1,861 sq. ft.
660 W Brook Hollow Road, Nixa, MO 65714
MLS# 60328282Listed by: MURNEY ASSOCIATES - PRIMROSE $359,900Active4 beds 2 baths1,870 sq. ft.
730 E Penzance Circle, Nixa, MO 65714
MLS# 60328284Listed by: REECENICHOLS - SPRINGFIELD $237,900Pending3 beds 2 baths1,422 sq. ft.
604 E Southeast Hills Court, Nixa, MO 65714
MLS# 60328258Listed by: AVENUE 2 REAL ESTATE CO $350,000Pending4 beds 2 baths2,274 sq. ft.
908 Domino Court, Nixa, MO 65714
MLS# 60328253Listed by: THE AGENCY REAL ESTATE $325,000Pending3 beds 2 baths1,931 sq. ft.
308 S Coventry Circle, Nixa, MO 65714
MLS# 60328123Listed by: MURNEY ASSOCIATES - PRIMROSE $1,350,000Active5 beds 4 baths3,779 sq. ft.
860 E Bantry Court, Nixa, MO 65714
MLS# 60328184Listed by: KELLER WILLIAMS $339,000Pending5 beds 3 baths2,746 sq. ft.
289 W Canyon Court, Nixa, MO 65714
MLS# 60328024Listed by: MASSENGALE GROUP - KELLER WILLIAMS - NIXA $215,000Pending3 beds 1 baths1,196 sq. ft.
404 E Deanna Lane, Nixa, MO 65714
MLS# 60327958Listed by: MURNEY ASSOCIATES - PRIMROSE $407,500Active5 beds 3 baths3,157 sq. ft.
912 E Welch Street, Nixa, MO 65714
MLS# 60327963Listed by: KELLER WILLIAMS LOCAL $650,000Pending6 beds 4 baths4,259 sq. ft.
1005 Denali Drive, Nixa, MO 65714
MLS# 60327926Listed by: KELLER WILLIAMS LOCAL $252,000Pending3 beds 2 baths1,351 sq. ft.
313 N Richards Castle Drive, Nixa, MO 65714
MLS# 60327906Listed by: MURNEY ASSOCIATES - PRIMROSE $300,000Pending3 beds 2 baths1,289 sq. ft.
1438 N Woodview Road, Nixa, MO 65714
MLS# 60327872Listed by: MURNEY ASSOCIATES - PRIMROSE $485,900Active4 beds 3 baths2,295 sq. ft.
129 N Glengary Drive, Nixa, MO 65714
MLS# 60327873Listed by: KELLER WILLIAMS LOCAL $314,999Active3 beds 2 baths1,651 sq. ft.
822 S Wheaton Hills Drive #Lot 164, Nixa, MO 65714
MLS# 60327820Listed by: MURNEY ASSOCIATES - PRIMROSE $399,900Active5 beds 4 baths2,756 sq. ft.
1122 E Lakota Street, Nixa, MO 65714
MLS# 60327817Listed by: KELLER WILLIAMS LOCAL $289,000Pending3 beds 2 baths2,166 sq. ft.
1214 W Verna Lane, Nixa, MO 65714
MLS# 60327810Listed by: MURNEY ASSOCIATES - PRIMROSE $380,000Pending4 beds 2 baths2,001 sq. ft.
921 E Thorndale Drive, Nixa, MO 65714
MLS# 60327741Listed by: MURNEY ASSOCIATES - NIXA $349,000Active4 beds 2 baths1,776 sq. ft.
1107 N Gretchen Street, Nixa, MO 65714
MLS# 60327695Listed by: MURNEY ASSOCIATES - PRIMROSE $499,900Active5 beds 3 baths3,240 sq. ft.
845 S Black Sands Avenue, Nixa, MO 65714
MLS# 60327608Listed by: MURNEY ASSOCIATES - PRIMROSE $375,000Active4 beds 3 baths3,156 sq. ft.
1083 E Daisy Falls Drive, Nixa, MO 65714
MLS# 60327597Listed by: KELLER WILLIAMS LOCAL $374,500Pending5 beds 4 baths2,719 sq. ft.
205 Great Plains Street, Nixa, MO 65714
MLS# 60327573Listed by: KELLER WILLIAMS LOCAL $269,900Pending3 beds 2 baths1,554 sq. ft.
901 N Dabney Street, Nixa, MO 65714
MLS# 60327525Listed by: EXP REALTY LLC $339,900Active4 beds 2 baths2,000 sq. ft.
722 E Mining Camp Road, Nixa, MO 65714
MLS# 60327458Listed by: KELLER WILLIAMS LOCAL $174,900Active5 Acres
Lot #4 N Ginger Lane, Nixa, MO 65714
MLS# 60327482Listed by: HOME SWEET HOME REALTY & ASSOCIATES, LLC $510,000Active4 beds 3 baths2,740 sq. ft.
1409 N Wicklow Road, Nixa, MO 65714
MLS# 60327409Listed by: MURNEY ASSOCIATES - PRIMROSE $279,900Pending3 beds 2 baths1,798 sq. ft.
307 N Market Street, Nixa, MO 65714
MLS# 60327255Listed by: KELLER WILLIAMS LOCAL $324,900Active3 beds 2 baths1,700 sq. ft.
802 S Wheaton Hills Drive, Nixa, MO 65714
MLS# 60327377Listed by: ALPHA REALTY MO, LLC $325,000Active4 beds 3 baths1,927 sq. ft.
509 N Pine Leaf Road, Nixa, MO 65714
MLS# 60327321Listed by: RE/MAX HOUSE OF BROKERS $259,900Pending3 beds 3 baths1,526 sq. ft.
826 S Hickory Lane, Nixa, MO 65714
MLS# 60327277Listed by: PLATINUM ESTATES REALTY INC $239,900Pending3 beds 2 baths1,491 sq. ft.
901 S Timber Ridge Drive, Nixa, MO 65714
MLS# 60327290Listed by: PROPERTY BROKERS OF S/W MO- Open Sun, 2 to 4pm
 $499,900Active4 beds 3 baths3,738 sq. ft.
1109 Glen Oaks Drive, Nixa, MO 65714
MLS# 60327270Listed by: REECENICHOLS - SPRINGFIELD  $549,000Pending4 beds 3 baths2,635 sq. ft.
597 E Selby Drive, Nixa, MO 65714
MLS# 60327224Listed by: HCW REALTY $315,000Active4 beds 2 baths2,172 sq. ft.
883 Dustin Lane, Nixa, MO 65714
MLS# 60327239Listed by: MURNEY ASSOCIATES - PRIMROSE $339,900Active4 beds 2 baths1,861 sq. ft.
939 S Pindall Lane, Nixa, MO 65714
MLS# 60327203Listed by: MURNEY ASSOCIATES - PRIMROSE- Open Sun, 2 to 4pm
 $454,500Active4 beds 3 baths2,575 sq. ft.
653 Greer Avenue, Nixa, MO 65714
MLS# 60327194Listed by: MURNEY ASSOCIATES - PRIMROSE 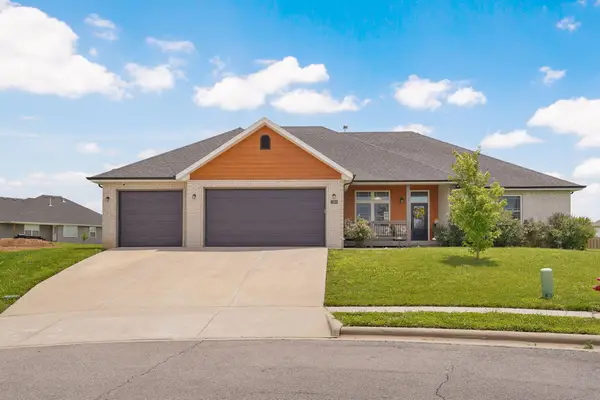 $375,000Active4 beds 2 baths2,196 sq. ft.
1360 N Rainbow Court, Nixa, MO 65714
MLS# 60327127Listed by: KELLER WILLIAMS LOCAL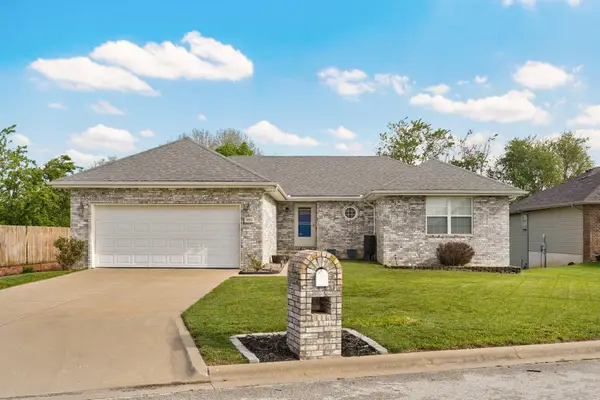 $349,900Pending4 beds 3 baths2,736 sq. ft.
991 W Bates Drive, Nixa, MO 65714
MLS# 60327071Listed by: KELLER WILLIAMS LOCAL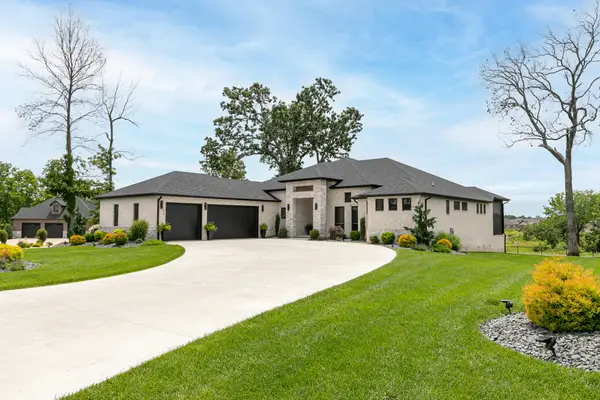 $899,900Active3 beds 3 baths3,000 sq. ft.
874 E Kenmare Court, Nixa, MO 65714
MLS# 60327054Listed by: EXP REALTY LLC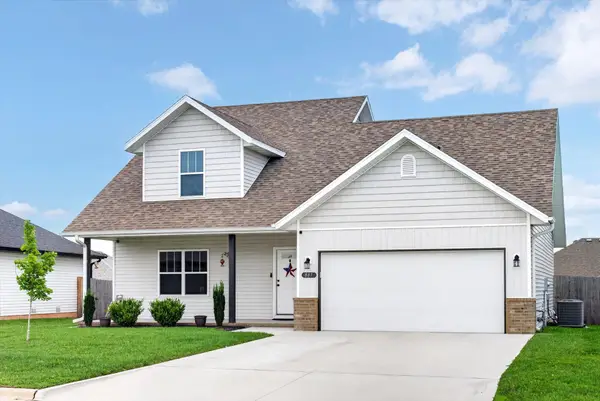 $349,900Active4 beds 3 baths2,034 sq. ft.
887 S Parkside Circle, Nixa, MO 65714
MLS# 60327021Listed by: ALPHA REALTY MO, LLC $340,000Active4 beds 3 baths2,045 sq. ft.
841 E Acacia Lane, Nixa, MO 65714
MLS# 60326966Listed by: MURNEY ASSOCIATES - PRIMROSE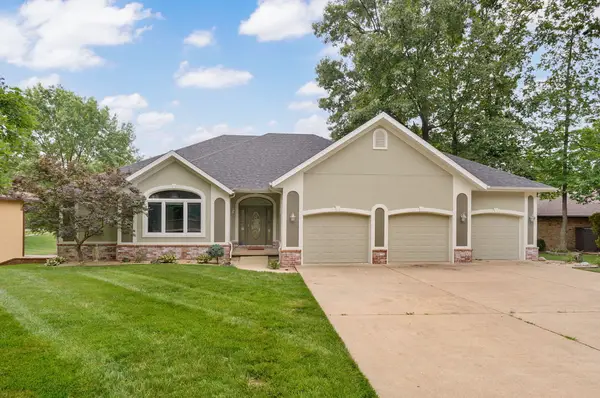 $614,900Active5 beds 3 baths4,373 sq. ft.
3318 Winged Foot Drive, Nixa, MO 65714
MLS# 60326843Listed by: MURNEY ASSOCIATES - PRIMROSE $329,900Pending4 beds 3 baths2,600 sq. ft.
1082 E Daisy Falls Drive, Nixa, MO 65714
MLS# 60326743Listed by: KELLER WILLIAMS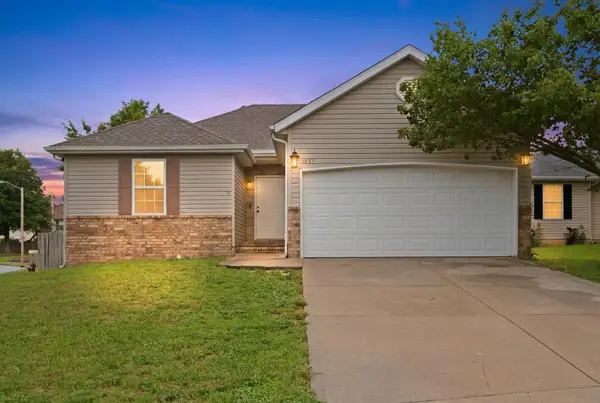 $225,000Pending3 beds 2 baths1,289 sq. ft.
1135 S Almond Court, Nixa, MO 65714
MLS# 60326797Listed by: ALPHA REALTY MO, LLC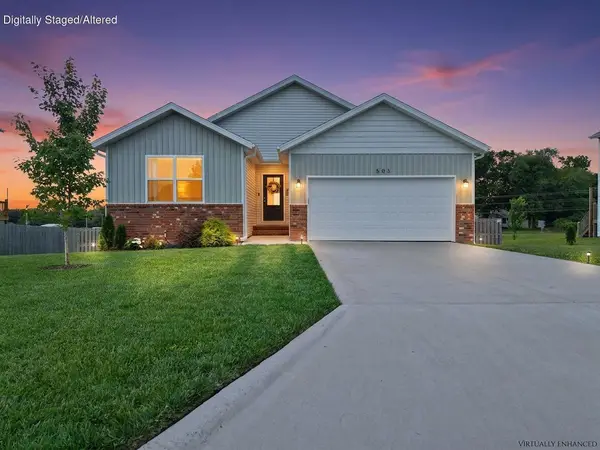 $399,900Active5 beds 3 baths2,727 sq. ft.
503 N Pine Leaf Road, Nixa, MO 65714
MLS# 60326480Listed by: RE/MAX HOUSE OF BROKERS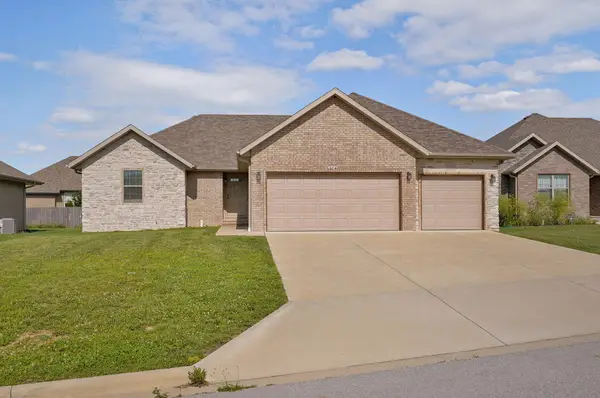 $334,900Pending4 beds 2 baths1,732 sq. ft.
664 N Montego Street, Nixa, MO 65714
MLS# 60326506Listed by: MURNEY ASSOCIATES - NIXA $178,000Active7.25 Acres
1326 Sassafras Lane, Nixa, MO 65714
MLS# 60326413Listed by: MURNEY ASSOCIATES - PRIMROSE $290,000Pending4 beds 2 baths1,645 sq. ft.
889 W Crestwood Street, Nixa, MO 65714
MLS# 60326336Listed by: LANDMARK BROKERS $250,000Pending3 beds 2 baths1,306 sq. ft.
611 E Marian Court, Nixa, MO 65714
MLS# 60326248Listed by: KELLER WILLIAMS $225,000Active3 beds 2 baths1,938 sq. ft.
577 S Canterbury Lane, Nixa, MO 65714
MLS# 60326095Listed by: KELLER WILLIAMS LOCAL $392,000Active5 beds 3 baths2,542 sq. ft.
710 Silver Streak Road, Nixa, MO 65714
MLS# 60326147Listed by: KELLER WILLIAMS LOCAL $459,900Active4 beds 4 baths3,961 sq. ft.
808 W Jackson Avenue, Nixa, MO 65714
MLS# 60326079Listed by: ALPHA REALTY MO, LLC $239,000Pending2 beds 2 baths1,461 sq. ft.
1356 N Sandy Creek Circle #3, Nixa, MO 65714
MLS# 60326047Listed by: GPS REALTY $289,900Pending3 beds 2 baths1,588 sq. ft.
653 N Althea Avenue, Nixa, MO 65714
MLS# 60326009Listed by: RE/MAX HOUSE OF BROKERS $589,900Active6 beds 4 baths3,400 sq. ft.
932 E Downshire Drive, Nixa, MO 65714
MLS# 60325890Listed by: ALPHA REALTY MO, LLC $449,900Pending4 beds 3 baths2,127 sq. ft.
926 E Downshire Drive, Nixa, MO 65714
MLS# 60325879Listed by: KELLER WILLIAMS $471,350Active5 beds 3 baths3,450 sq. ft.
879 E Virginia Lane #Lot 183, Nixa, MO 65714
MLS# 60325587Listed by: MURNEY ASSOCIATES - PRIMROSE $179,000Active1.26 Acres
000 Crimson Avenue, Nixa, MO 65714
MLS# 60325594Listed by: KELLER WILLIAMS $375,000Pending3 beds 3 baths2,367 sq. ft.
752 E Gallup Hill Road, Nixa, MO 65714
MLS# 60325468Listed by: KELLER WILLIAMS $324,900Active4 beds 3 baths2,000 sq. ft.
204 N Big Horn Road, Nixa, MO 65714
MLS# 60325471Listed by: SPRINGFIELD REALTY EXPERTS $479,000Pending3 beds 3 baths2,805 sq. ft.
746 S Moppin Hollow Lane, Nixa, MO 65714
MLS# 60325452Listed by: MURNEY ASSOCIATES - NIXA $60,000Pending0.52 Acres
000 Eastwood Drive #Lot B, Nixa, MO 65714
MLS# 60325327Listed by: MASSENGALE GROUP - KELLER WILLIAMS - NIXA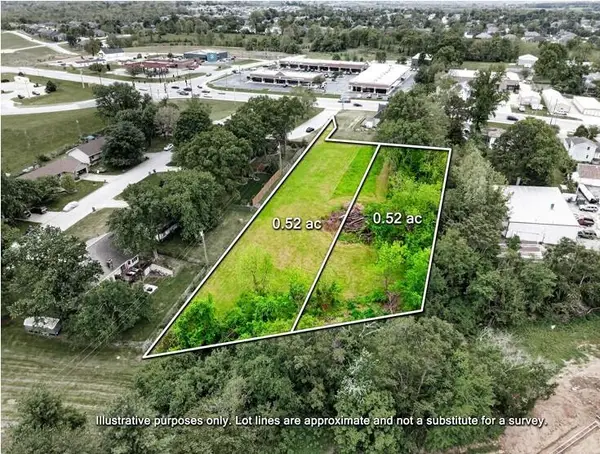 $60,000Pending0.52 Acres
Address Withheld By Seller, Nixa, MO 65714
MLS# 60325328Listed by: MASSENGALE GROUP - KELLER WILLIAMS - NIXA $1,349,000Active4 beds 3 baths3,371 sq. ft.
878 E Galway Court, Nixa, MO 65714
MLS# 60325230Listed by: EXP REALTY LLC $349,000Active4 beds 3 baths2,683 sq. ft.
848 S Black Sands Avenue, Nixa, MO 65714
MLS# 60324948Listed by: GATEWAY REAL ESTATE TEAM LLC $1,400,000Active5 beds 4 baths3,807 sq. ft.
861 Bantry Court, Nixa, MO 65714
MLS# 60324858Listed by: MURNEY ASSOCIATES - PRIMROSE $346,978Active3 beds 2 baths1,922 sq. ft.
746 W Brook Hollow Road, Nixa, MO 65714
MLS# 60324775Listed by: KELLER WILLIAMS $287,134Active3 beds 2 baths1,409 sq. ft.
733 W Brook Hollow Road, Nixa, MO 65714
MLS# 60324777Listed by: KELLER WILLIAMS $655,000Pending6 beds 4 baths4,342 sq. ft.
1061 S Eagle Lake Drive, Nixa, MO 65714
MLS# 60324709Listed by: MASSENGALE GROUP - KELLER WILLIAMS - NIXA
 $314,900Active3 beds 2 baths1,622 sq. ft.
1656 N Penrose Avenue, Nixa, MO 65714
MLS# 60324596Listed by: CENTURY 21 INTEGRITY GROUP $219,000Pending3 beds 2 baths1,109 sq. ft.
1206 W Belwood Court, Nixa, MO 65714
MLS# 60324579Listed by: INVESTMENT REALTY, INC.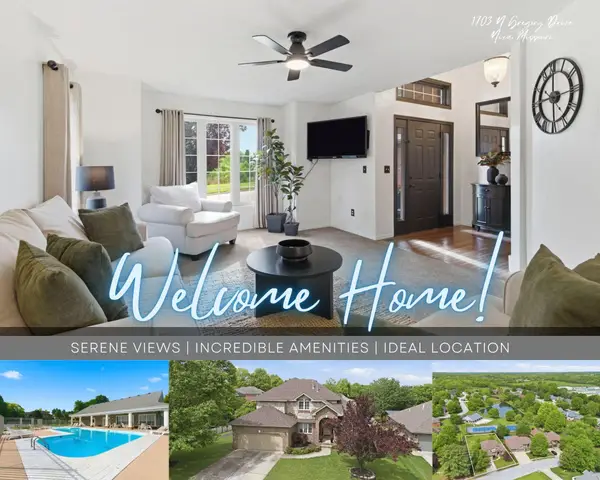 $515,000Active5 beds 4 baths4,026 sq. ft.
1703 N Gregory Drive, Nixa, MO 65714
MLS# 60324549Listed by: MURNEY ASSOCIATES - NIXA $305,600Pending3 beds 2 baths1,490 sq. ft.
822 S Ridgemont Drive #Lot 143, Nixa, MO 65714
MLS# 60324501Listed by: MURNEY ASSOCIATES - PRIMROSE $304,900Pending3 beds 2 baths1,608 sq. ft.
935 S Pindall Lane, Nixa, MO 65714
MLS# 60324462Listed by: MURNEY ASSOCIATES - PRIMROSE $304,900Pending3 beds 2 baths1,608 sq. ft.
943 S Pindall Lane, Nixa, MO 65714
MLS# 60324463Listed by: MURNEY ASSOCIATES - PRIMROSE $369,900Pending5 beds 4 baths2,521 sq. ft.
301 Great Plains Street, Nixa, MO 65714
MLS# 60324369Listed by: RE/MAX HOUSE OF BROKERS $345,000Active4 beds 3 baths2,650 sq. ft.
849 S Cobble Creek Boulevard, Nixa, MO 65714
MLS# 60324186Listed by: KELLER WILLIAMS $405,925Pending5 beds 3 baths3,296 sq. ft.
845 E Virginia Lane #Lot 196, Nixa, MO 65714
MLS# 60324081Listed by: MURNEY ASSOCIATES - PRIMROSE $398,875Pending5 beds 3 baths3,296 sq. ft.
863 E Virginia Lane #Lot 188, Nixa, MO 65714
MLS# 60324028Listed by: MURNEY ASSOCIATES - PRIMROSE $659,000Pending5 beds 3 baths4,360 sq. ft.
1402 N Rockingham Avenue, Nixa, MO 65714
MLS# 60323991Listed by: MURNEY ASSOCIATES - NIXA $279,000Active3 beds 2 baths1,742 sq. ft.
714 N Fort Street, Nixa, MO 65714
MLS# 60323908Listed by: MURNEY ASSOCIATES - PRIMROSE $264,900Pending3 beds 2 baths1,613 sq. ft.
1343 W Berkshire Avenue, Nixa, MO 65714
MLS# 60323859Listed by: KELLER WILLIAMS LOCAL $614,900Pending5 beds 4 baths3,739 sq. ft.
781 N Fox Hill Circle, Nixa, MO 65714
MLS# 60323771Listed by: ALPHA REALTY MO, LLC $209,000Pending3 beds 2 baths1,267 sq. ft.
702 W Eagle Street, Nixa, MO 65714
MLS# 60323605Listed by: ACTION REAL ESTATE $119,900Active0.33 Acres
Tbd N Main Street, Nixa, MO 65714
MLS# 60323362Listed by: HOME SWEET HOME REALTY & ASSOCIATES, LLC $145,000Active0.31 Acres
8302 Rolling Hills Drive, Nixa, MO 65714
MLS# 60323302Listed by: ALPHA REALTY MO, LLC $295,000Active2 beds 2 baths1,666 sq. ft.
1376 N Sandy Creek Circle #3, Nixa, MO 65714
MLS# 60323237Listed by: KELLER WILLIAMS $922,500Pending5 beds 4 baths4,463 sq. ft.
1662 S Timber Lake Drive, Nixa, MO 65714
MLS# 60323107Listed by: REAL ESTATE UNITED $1,575,000Active4 beds 5 baths5,227 sq. ft.
1539 S Millridge Court, Nixa, MO 65714
MLS# 60322889Listed by: OLD WORLD REALTY, LLC $319,000Active3 beds 2 baths1,670 sq. ft.
1659 N Kingfisher Drive, Nixa, MO 65714
MLS# 60322837Listed by: KELLER WILLIAMS LOCAL $339,900Active4 beds 2 baths1,861 sq. ft.
931 S Pindall Lane, Nixa, MO 65714
MLS# 60322787Listed by: MURNEY ASSOCIATES - PRIMROSE- Open Sat, 2 to 5pm
 $399,900Active4 beds 3 baths2,738 sq. ft.
502 S Pepperhill Drive, Nixa, MO 65714
MLS# 60322764Listed by: EXP REALTY LLC  $295,000Active3 beds 3 baths2,163 sq. ft.
203 N Ellen Street, Nixa, MO 65714
MLS# 60322650Listed by: ALPHA REALTY MO, LLC $660,000Active5 beds 4 baths3,314 sq. ft.
204 N Blarney Court, Nixa, MO 65714
MLS# 60322437Listed by: CANTRELL REAL ESTATE $590,000Active16.98 Acres
000 W Copper Creek Drive, Nixa, MO 65714
MLS# 60322310Listed by: MURNEY ASSOCIATES - NIXA- Open Sat, 1 to 3pm
 $448,000Active5 beds 3 baths3,470 sq. ft.
816 S Ridgemont Drive, Nixa, MO 65714
MLS# 60322193Listed by: CANTRELL REAL ESTATE  $394,000Active5 beds 3 baths2,727 sq. ft.
608 N Cheyenne Valley Road, Nixa, MO 65714
MLS# 60322144Listed by: STURDY REAL ESTATE $439,900Active4 beds 3 baths3,400 sq. ft.
506 S Pepperhill Drive, Nixa, MO 65714
MLS# 60322057Listed by: WISER LIVING REALTY LLC $569,900Active5 beds 3 baths3,773 sq. ft.
634 N Rockingham Avenue, Nixa, MO 65714
MLS# 60322085Listed by: AVENUE 2 REAL ESTATE CO $299,000Pending0.55 Acres
607 E Mount Vernon Street, Nixa, MO 65714
MLS# 60322010Listed by: MASSENGALE GROUP - KELLER WILLIAMS - NIXA $1,700,000Pending25.96 Acres
Tr 2&3 W Mount Vernon Street (hwy 14), Nixa, MO 65714
MLS# 60321948Listed by: MURNEY ASSOCIATES - PRIMROSE $175,000Active2.2 Acres
601 S Gregg Road, Nixa, MO 65714
MLS# 60321673Listed by: ALPHA REALTY MO, LLC $900,000Active30 Acres
000 W Itaska Road, Nixa, MO 65714
MLS# 60321607Listed by: STURDY REAL ESTATE $375,000Active9.09 Acres
Lot 2 Muskego Road, Nixa, MO 65714
MLS# 60321487Listed by: OLD WORLD REALTY, LLC $375,000Active9.09 Acres
Lot 3 Muskego Road, Nixa, MO 65714
MLS# 60321488Listed by: OLD WORLD REALTY, LLC $375,000Active9.09 Acres
Lot 5 Muskego Road, Nixa, MO 65714
MLS# 60321489Listed by: OLD WORLD REALTY, LLC $375,000Active9.09 Acres
Lot 6 Muskego Road, Nixa, MO 65714
MLS# 60321490Listed by: OLD WORLD REALTY, LLC $375,000Active13.2 Acres
Lot 1 Muskego Road, Nixa, MO 65714
MLS# 60321486Listed by: OLD WORLD REALTY, LLC $385,000Pending4 beds 4 baths3,114 sq. ft.
311 Northview Road, Nixa, MO 65714
MLS# 60321349Listed by: MURNEY ASSOCIATES - PRIMROSE $239,999Pending2 beds 2 baths1,366 sq. ft.
653 S Woodbridge Court, Nixa, MO 65714
MLS# 60321279Listed by: MURNEY ASSOCIATES - PRIMROSE $434,772Pending4 beds 3 baths2,410 sq. ft.
1411 E Hayston Avenue, Nixa, MO 65714
MLS# 60321244Listed by: KELLER WILLIAMS REALTY ELEVATE $725,000Active5 beds 4 baths4,600 sq. ft.
4202 Buttonwood Drive, Nixa, MO 65714
MLS# 60321147Listed by: KELLER WILLIAMS $279,900Active3 beds 2 baths1,438 sq. ft.
142 W Trail Point Drive, Nixa, MO 65714
MLS# 60321130Listed by: EXP REALTY LLC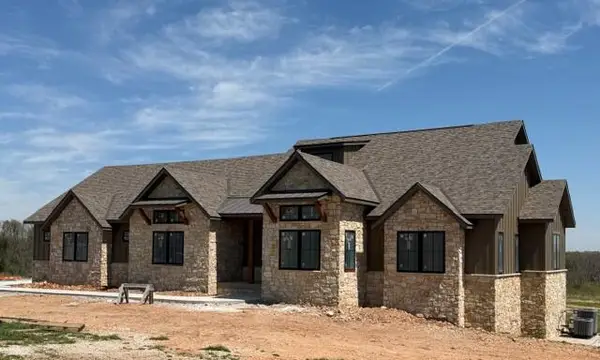 $1,695,000Active6 beds 4 baths5,230 sq. ft.
1024 Muskego Road, Nixa, MO 65714
MLS# 60320723Listed by: OLD WORLD REALTY, LLC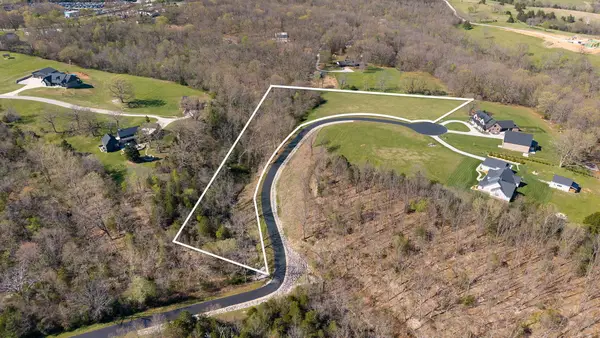 $199,900Active5.11 Acres
Lot 11 S Ironridge Court, Nixa, MO 65714
MLS# 60320180Listed by: ALPHA REALTY MO, LLC $239,000Active2 beds 2 baths1,342 sq. ft.
1398 N Sandy Creek Circle #4, Nixa, MO 65714
MLS# 60320110Listed by: AMAX REAL ESTATE- Open Sat, 2 to 4pm
 $579,000Active4 beds 3 baths3,104 sq. ft.
855 E Ashford Avenue, Nixa, MO 65714
MLS# 60320033Listed by: KELLER WILLIAMS LOCAL  $639,000Active5 beds 4 baths3,314 sq. ft.
1301 S Amber Ridge Drive, Nixa, MO 65714
MLS# 60319153Listed by: GATEWAY REAL ESTATE TEAM LLC $199,000Active3 beds 2 baths1,128 sq. ft.
602 Oak Leaf Court, Nixa, MO 65714
MLS# 60318780Listed by: KELLER WILLIAMS LOCAL $305,000Active5 beds 3 baths2,408 sq. ft.
207 N Meadow Street, Nixa, MO 65714
MLS# 60318732Listed by: KELLER WILLIAMS LOCAL $305,000Pending3 beds 2 baths1,646 sq. ft.
Address Withheld By Seller, Nixa, MO 65714
MLS# 60318686Listed by: MURNEY ASSOCIATES - PRIMROSE $680,000Active4 beds 3 baths2,903 sq. ft.
870 E Emerald Terrace, Nixa, MO 65714
MLS# 60318416Listed by: ALPHA REALTY MO, LLC $1,999,000Active21.7 Acres
Tbd Highway 160, Nixa, MO 65714
MLS# 60318355Listed by: KELLER WILLIAMS $685,500Pending4 beds 3 baths2,761 sq. ft.
704 W Savanna Court, Nixa, MO 65714
MLS# 60317455Listed by: KELLER WILLIAMS LOCAL $699,900Pending4 beds 4 baths3,810 sq. ft.
208 N Glengary Drive, Nixa, MO 65714
MLS# 60317207Listed by: RE/MAX HOUSE OF BROKERS $199,000Active3 Acres
Lot 3 Mack Road, Nixa, MO 65714
MLS# 60317235Listed by: MURNEY ASSOCIATES - NIXA $179,000Active2.8 Acres
Lot 6 Mack Road, Nixa, MO 65714
MLS# 60317237Listed by: MURNEY ASSOCIATES - NIXA $209,500Active2 beds 3 baths1,433 sq. ft.
640 E Spring Valley Circle #1, Nixa, MO 65714
MLS# 60316103Listed by: MURNEY ASSOCIATES - PRIMROSE $224,000Pending3 beds 2 baths1,758 sq. ft.
1257 W Bridgewood Place, Nixa, MO 65714
MLS# 60315263Listed by: ACTION REAL ESTATE $84,900Pending0.4 Acres
Lot 52 The Village Of Cloverhill, Nixa, MO 65714
MLS# 60314643Listed by: MURNEY ASSOCIATES - PRIMROSE $94,900Active0.28 Acres
Lot 45 The Village Of Cloverhill, Nixa, MO 65714
MLS# 60314470Listed by: MURNEY ASSOCIATES - PRIMROSE $96,900Pending0.22 Acres
Lot 49 The Village Of Cloverhill, Nixa, MO 65714
MLS# 60314474Listed by: MURNEY ASSOCIATES - PRIMROSE $89,900Pending0.29 Acres
Lot 50 The Village Of Cloverhill, Nixa, MO 65714
MLS# 60314475Listed by: MURNEY ASSOCIATES - PRIMROSE $89,900Pending0.27 Acres
Lot 51 The Village Of Cloverhill, Nixa, MO 65714
MLS# 60314476Listed by: MURNEY ASSOCIATES - PRIMROSE $125,000Active1.41 Acres
L 26 S Kelby Creek, Nixa, MO 65714
MLS# 60314439Listed by: ALPHA REALTY MO, LLC $325,000Active3 beds 2 baths2,214 sq. ft.
1719 N Pine Street, Nixa, MO 65714
MLS# 60313506Listed by: MAYHEW REALTY GROUP LLC $249,000Active3 beds 2 baths1,714 sq. ft.
1721 N Pine Street, Nixa, MO 65714
MLS# 60313507Listed by: MAYHEW REALTY GROUP LLC $2,521,252.8Active14.47 Acres
1209 W Mt Vernon Street, Nixa, MO 65714
MLS# 60313431Listed by: KELLER WILLIAMS $1,045,440Active6 Acres
120 N Nicholas Road, Nixa, MO 65714
MLS# 60313432Listed by: KELLER WILLIAMS $95,900Pending0.45 Acres
Lot 28 The Village Of Cloverhill, Nixa, MO 65714
MLS# 60313305Listed by: MURNEY ASSOCIATES - PRIMROSE $94,900Pending0.31 Acres
Lot 34 The Village Of Cloverhill, Nixa, MO 65714
MLS# 60313311Listed by: MURNEY ASSOCIATES - PRIMROSE $94,900Active0.27 Acres
Lot 38 The Village Of Cloverhill, Nixa, MO 65714
MLS# 60313315Listed by: MURNEY ASSOCIATES - PRIMROSE $94,900Pending0.23 Acres
Lot 25 The Village Of Cloverhill, Nixa, MO 65714
MLS# 60312966Listed by: MURNEY ASSOCIATES - PRIMROSE $94,900Pending0.23 Acres
Lot 26 The Village Of Cloverhill, Nixa, MO 65714
MLS# 60312967Listed by: MURNEY ASSOCIATES - PRIMROSE $96,900Pending0.27 Acres
Lot 27 The Village Of Cloverhill, Nixa, MO 65714
MLS# 60312899Listed by: MURNEY ASSOCIATES - PRIMROSE $91,900Active0.25 Acres
Lot 9 The Village Of Cloverhill, Nixa, MO 65714
MLS# 60312873Listed by: MURNEY ASSOCIATES - PRIMROSE $850,000Active6 beds 4 baths4,791 sq. ft.
1294 S Amber Ridge Drive, Nixa, MO 65714
MLS# 60309263Listed by: KELLER WILLIAMS LOCAL $99,900Active0.46 Acres
Lot 13 Kelby Creek Phase 4, Nixa, MO 65714
MLS# 60308489Listed by: MURNEY ASSOCIATES - NIXA $104,900Active0.43 Acres
Lot 16 Kelby Creek Phase 4, Nixa, MO 65714
MLS# 60308492Listed by: MURNEY ASSOCIATES - NIXA $119,900Active0.55 Acres
Lot 17 Kelby Creek Phase 4, Nixa, MO 65714
MLS# 60308493Listed by: MURNEY ASSOCIATES - NIXA $94,900Active0.31 Acres
Lot 18 Kelby Creek Phase 4, Nixa, MO 65714
MLS# 60308494Listed by: MURNEY ASSOCIATES - NIXA $94,900Active0.35 Acres
Lot 19 Kelby Creek Phase 4, Nixa, MO 65714
MLS# 60308495Listed by: MURNEY ASSOCIATES - NIXA $84,900Active0.28 Acres
Lot 2 Kelby Creek Phase 4, Nixa, MO 65714
MLS# 60308496Listed by: MURNEY ASSOCIATES - NIXA $99,900Active0.44 Acres
Lot 20 Kelby Creek Phase 4, Nixa, MO 65714
MLS# 60308497Listed by: MURNEY ASSOCIATES - NIXA $89,900Active0.34 Acres
Lot 21 Kelby Creek Phase 4, Nixa, MO 65714
MLS# 60308498Listed by: MURNEY ASSOCIATES - NIXA $84,900Active0.34 Acres
Lot 3 Kelby Creek Phase 4, Nixa, MO 65714
MLS# 60308499Listed by: MURNEY ASSOCIATES - NIXA $84,900Active0.33 Acres
Lot 4 Kelby Creek Phase 4, Nixa, MO 65714
MLS# 60308500Listed by: MURNEY ASSOCIATES - NIXA $84,900Active0.31 Acres
Lot 5 Kelby Creek Phase 4, Nixa, MO 65714
MLS# 60308501Listed by: MURNEY ASSOCIATES - NIXA $129,900Active0.53 Acres
Lot 6 Kelby Creek Phase 4, Nixa, MO 65714
MLS# 60308502Listed by: MURNEY ASSOCIATES - NIXA $360,296Active4 beds 3 baths1,979 sq. ft.
1343 N Maxine Avenue, Nixa, MO 65714
MLS# 60308391Listed by: KELLER WILLIAMS LOCAL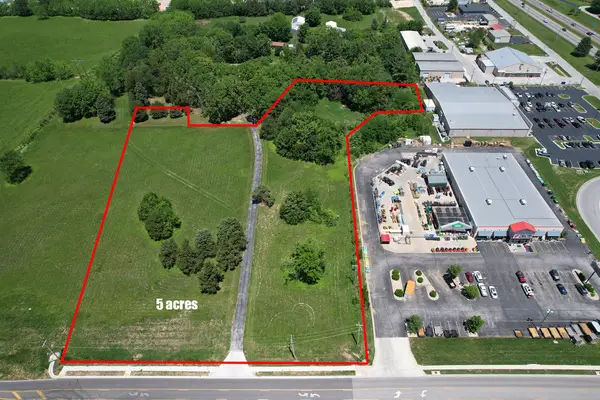 $1,000,000Active5.74 Acres
000 W Northview, Nixa, MO 65714
MLS# 60306930Listed by: MASSENGALE GROUP - KELLER WILLIAMS - NIXA $295,000Pending4 beds 3 baths2,555 sq. ft.
1222 W Butterfield Drive, Nixa, MO 65714
MLS# 60306879Listed by: KELLER WILLIAMS $449,900Pending5 beds 3 baths3,256 sq. ft.
621 W Arbor Glenn Drive, Nixa, MO 65714
MLS# 60306828Listed by: MURNEY ASSOCIATES - PRIMROSE $230,000Active4.16 Acres
Lot 60 Kelby Creek Phase 2, Nixa, MO 65714
MLS# 60305476Listed by: MURNEY ASSOCIATES - NIXA $470,000Active4 beds 3 baths3,100 sq. ft.
825 S Cobble Creek Boulevard, Nixa, MO 65714
MLS# 60304815Listed by: MURNEY ASSOCIATES - PRIMROSE $400,000Active5.83 Acres
287 Sunrise Drive, Nixa, MO 65714
MLS# 60302379Listed by: MASSENGALE GROUP - KELLER WILLIAMS - NIXA $250,000Active1.82 Acres
287 Sunrise Drive, Nixa, MO 65714
MLS# 60302381Listed by: MASSENGALE GROUP - KELLER WILLIAMS - NIXA $160,000Active4.01 Acres
000 S Croley Boulevard #Lots 12,13, 14, Nixa, MO 65714
MLS# 60302383Listed by: MASSENGALE GROUP - KELLER WILLIAMS - NIXA $335,000Active4 beds 3 baths2,610 sq. ft.
111 E Daleview Circle, Nixa, MO 65714
MLS# 60302252Listed by: BETTER HOMES & GARDENS SW GRP $450,000Active0.34 Acres
209&211 E Mount Vernon Street, Nixa, MO 65714
MLS# 60301179Listed by: ALPHA REALTY MO, LLC $695,000Active10.3 Acres
000 Citydel Road, Nixa, MO 65714
MLS# 60295324Listed by: MASSENGALE GROUP - KELLER WILLIAMS - NIXA $1,800,000Active14.8 Acres
000 (Tbd) Highway 160 (14.8 Acres) Street, Nixa, MO 65714
MLS# 60295328Listed by: MASSENGALE GROUP - KELLER WILLIAMS - NIXA $260,000Active3 beds 2 baths1,585 sq. ft.
603 E Mt Vernon Street, Nixa, MO 65714
MLS# 60316802Listed by: ALPHA REALTY MO, LLC $335,000Active4 beds 3 baths2,360 sq. ft.
602 E Cherry Street, Nixa, MO 65714
MLS# 60305090Listed by: REECENICHOLS - SPRINGFIELD $110,000Active0.46 Acres
1006 E Tipperary Court, Nixa, MO 65714
MLS# 60276766Listed by: ALPHA REALTY MO, LLC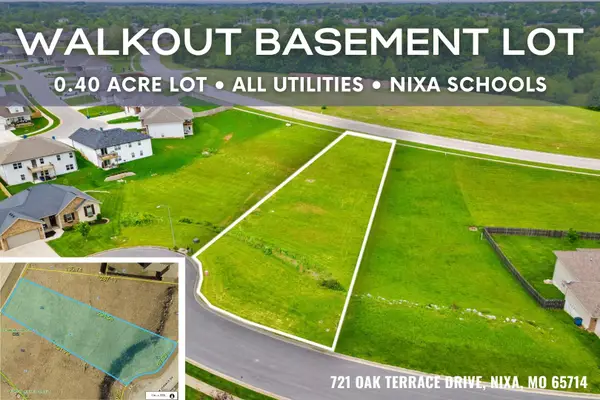 $40,000Active0.4 Acres
721 Oak Terrace Drive, Nixa, MO 65714
MLS# 60317690Listed by: KELLER WILLIAMS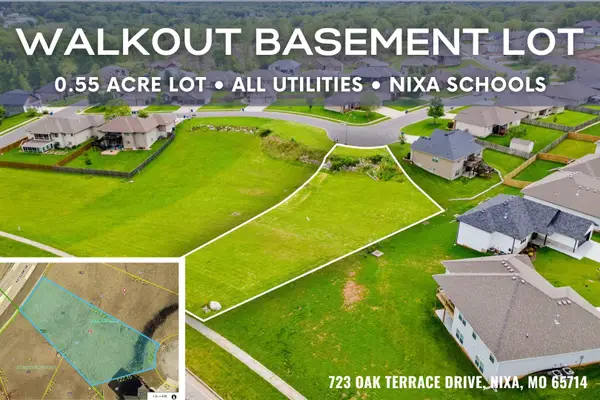 $40,000Active0.55 Acres
723 Oak Terrace Drive, Nixa, MO 65714
MLS# 60317691Listed by: KELLER WILLIAMS $649,900Active5 beds 3 baths3,275 sq. ft.
679 N Fox Hill Circle, Nixa, MO 65714
MLS# 60305838Listed by: JIM HUTCHESON, REALTORS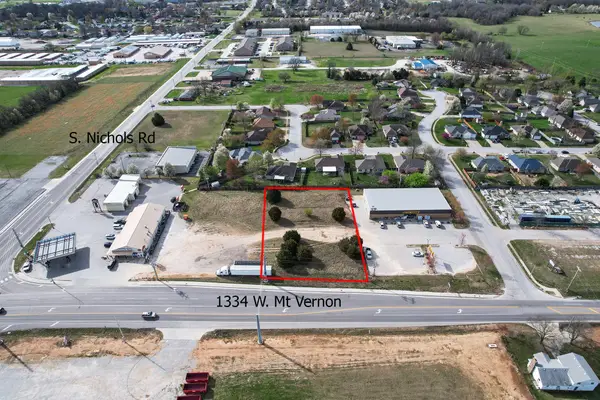 $300,000Active0.77 Acres
1334 W Mt Vernon Street, Nixa, MO 65714
MLS# 60264463Listed by: MASSENGALE GROUP - KELLER WILLIAMS - NIXA $419,900Active1.31 Acres
985 Crimson Avenue, Nixa, MO 65714
MLS# 60305972Listed by: MURNEY ASSOCIATES - NIXA $239,900Pending2 beds 2 baths1,480 sq. ft.
1352 North Sandy Creek Circle #2, Nixa, MO 65714
MLS# 60255848Listed by: ASSIST 2 SELL $300,000Pending4 beds 3 baths2,166 sq. ft.
1120 Buffalo Court, Nixa, MO 65714
MLS# 60254604Listed by: KELLER WILLIAMS $289,995Pending4 beds 3 baths1,927 sq. ft.
1130 East White Antelope Road, Nixa, MO 65714
MLS# 60254402Listed by: KELLER WILLIAMS $250,000Pending3 beds 2 baths1,560 sq. ft.
912 North Crane Court, Nixa, MO 65714
MLS# 60253410Listed by: MURNEY ASSOCIATES - PRIMROSE $49,900Active1.7 Acres
Lot 24 Bentwater Phase 3, Nixa, MO 65714
MLS# 60116593Listed by: MURNEY ASSOCIATES - PRIMROSE $17,000Active0.18 Acres
847 South Black Sands Lot 117, Nixa, MO 65714
MLS# 60218314Listed by: 417 AREA REALTY $2,950,000Active14 Acres
Sw Corner Highway 160 & South Street, Nixa, MO 65714
MLS# 60234239Listed by: MURNEY ASSOCIATES - PRIMROSE
Local realty services provided by:CENTURY 21 Combs & Associates Real Estate
Copyright 2026 Southern Missouri MLS. All rights reserved. Listings courtesy of Southern Missouri MLS as distributed by MLS GRID <Last Updated July 30, 2026. Southern Missouri MLS provides content displayed here (“provided content”) on an “as is” basis and makes no representations or warranties regarding the provided content, including, but not limited to those of non-infringement, timeliness, accuracy, or completeness. Individuals and companies using information presented are responsible for verification and validation of information they utilize and present to their customers and clients. Southern Missouri MLS will not be liable for any damage or loss resulting from use of the provided content or the products available through Portals, IDX, VOW, and/or Syndication. Recipients of this information shall not resell, redistribute, reproduce, modify, or otherwise copy any portion thereof without the expressed written consent of Southern Missouri MLS
Neighborhoods near Nixa, MO
Zip codes near Nixa, MO
- 65610 homes for sale
- 65612 homes for sale
- 65619 homes for sale
- 65630 homes for sale
- 65631 homes for sale
- 65633 homes for sale
- 65669 homes for sale
- 65705 homes for sale
- 65714 homes for sale
- 65721 homes for sale
- 65738 homes for sale
- 65742 homes for sale
- 65754 homes for sale
- 65802 homes for sale
- 65803 homes for sale
- 65804 homes for sale
- 65806 homes for sale
- 65807 homes for sale
- 65809 homes for sale
- 65810 homes for sale
Popular searches near Nixa, MO
- Battlefield homes for sale
- Battlefield A homes for sale
- Battlefield B homes for sale
- Cassidy homes for sale
- Cherokee homes for sale
- East Clay A homes for sale
- East Finley homes for sale
- Fremont Hills homes for sale
- Garden Grove homes for sale
- Highlandville homes for sale
- North Galloway homes for sale
- Northview homes for sale
- Ozark homes for sale
- Riverside homes for sale
- Rosedale homes for sale
- Union Chapel homes for sale
- West Finley homes for sale
- Wilson A homes for sale
- Wilson C homes for sale
- Wilson CW homes for sale
Protect your home and budget from life's surprises with an Assurant Home Warranty, backed by a partner that supports you through every step of homeownership. Explore Plans.
©2026 Century 21 Real Estate LLC. All rights reserved. CENTURY 21®, the CENTURY 21 Logo and C21® are service marks owned by Century 21 Real Estate LLC. Century 21 Real Estate LLC fully supports the principles of the Fair Housing Act and the Equal Opportunity Act. Each office is independently owned and operated. Listing information is deemed reliable but not guaranteed accurate.