- Bridle Trails, Kirkland homes for sale
- Central Houghton, Kirkland homes for sale
- Downtown, Redmond homes for sale
- Everest, Kirkland homes for sale
- Evergreen Hill, Kirkland homes for sale
- Finn Hill, Kirkland homes for sale
- Grass Lawn, Redmond homes for sale
- Hawthorne Hills, Seattle homes for sale
- Highlands, Kirkland homes for sale
- Lakeview, Kirkland homes for sale
- Market, Kirkland homes for sale
- Moss Bay, Kirkland homes for sale
- North Juanita, Kirkland homes for sale
- North Rose Hill, Kirkland homes for sale
- South Juanita, Kirkland homes for sale
- South Rose Hill, Kirkland homes for sale
- Totem Lake, Kirkland homes for sale
- View Ridge, Seattle homes for sale
- Willows, Kirkland homes for sale
- Windermere, Seattle homes for sale
Norkirk, Kirkland, WA - homes for sale
27 of 27 results displayed
- New
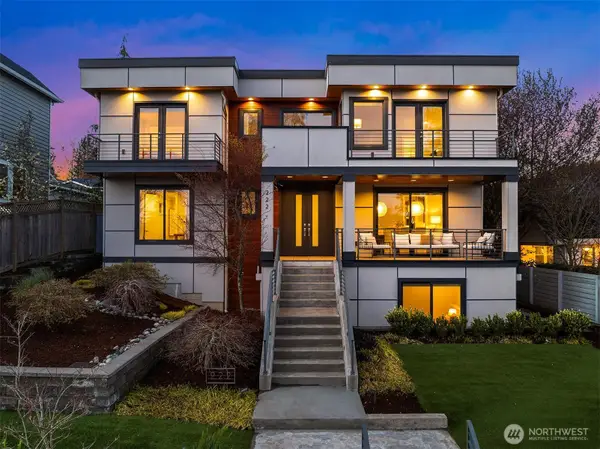 $3,750,000Active5 beds 6 baths5,340 sq. ft.
222 8th Avenue, Kirkland, WA 98033
MLS# 2496798Listed by: COMPASS
- New
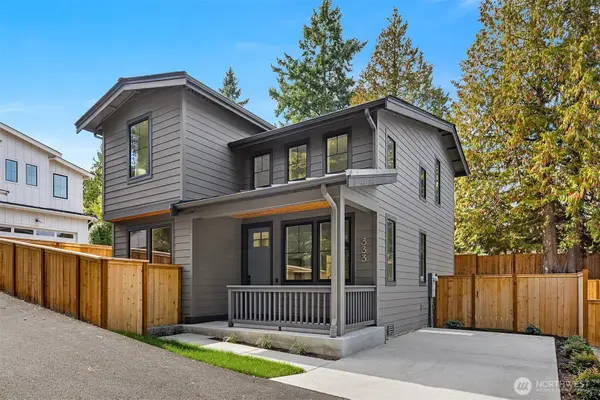 $1,200,000Active3 beds 3 baths1,332 sq. ft.
333 18th Avenue, Kirkland, WA 98033
MLS# 2498806Listed by: WINDERMERE REAL ESTATE CO. - New
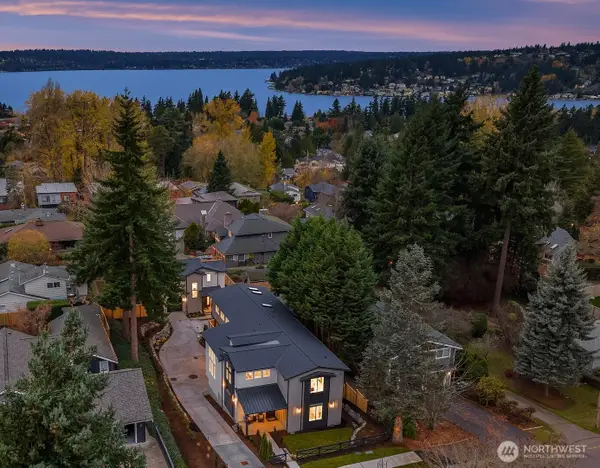 $4,190,000Active6 beds 6 baths5,081 sq. ft.
1813 3rd Street, Kirkland, WA 98033
MLS# 2496616Listed by: CHAMPIONS REAL ESTATE  $3,450,000Active5 beds 4 baths4,330 sq. ft.
1525 4th Street, Kirkland, WA 98033
MLS# 2493066Listed by: WINDERMERE REAL ESTATE/EAST $1,724,998Active3 beds 2 baths1,200 sq. ft.
1513 3rd Place, Kirkland, WA 98033
MLS# 2467498Listed by: COMPASS $1,248,000Pending3 beds 3 baths1,321 sq. ft.
337 18th Avenue, Kirkland, WA 98033
MLS# 2492766Listed by: WINDERMERE REAL ESTATE CO.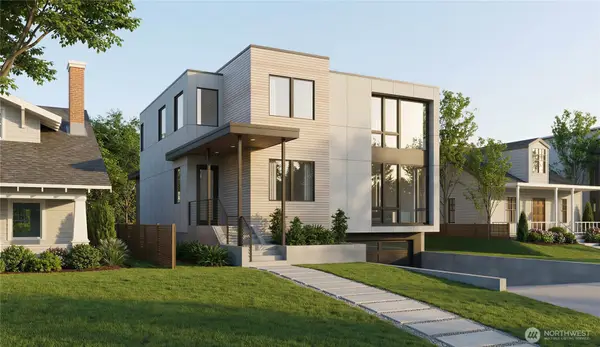 $3,789,850Active4 beds 4 baths3,955 sq. ft.
436 7th Avenue, Kirkland, WA 98033
MLS# 2488303Listed by: WINDERMERE R.E. NORTHEAST, INC $1,529,950Active3 beds 3 baths1,768 sq. ft.
410 2nd Street #A, Kirkland, WA 98033
MLS# 2489122Listed by: KELLER WILLIAMS EASTSIDE $3,400,000Active4 beds 5 baths4,030 sq. ft.
1416 2nd Street, Kirkland, WA 98033
MLS# 2488164Listed by: REALOGICS SOTHEBY'S INT'L RLTY $2,245,000Active4 beds 3 baths2,856 sq. ft.
412 15th Avenue, Kirkland, WA 98033
MLS# 2484149Listed by: WINDERMERE REAL ESTATE/EAST $1,775,000Active3 beds 3 baths1,687 sq. ft.
105 19th Avenue, Kirkland, WA 98033
MLS# 2486456Listed by: GILLIS REAL ESTATE LLC $1,894,000Active4 beds 3 baths1,834 sq. ft.
1860 1st Street, Kirkland, WA 98033
MLS# 2486461Listed by: GILLIS REAL ESTATE LLC $1,150,000Pending2 beds 3 baths1,517 sq. ft.
316 5th Avenue #102, Kirkland, WA 98033
MLS# 2481712Listed by: WINDERMERE REAL ESTATE/EAST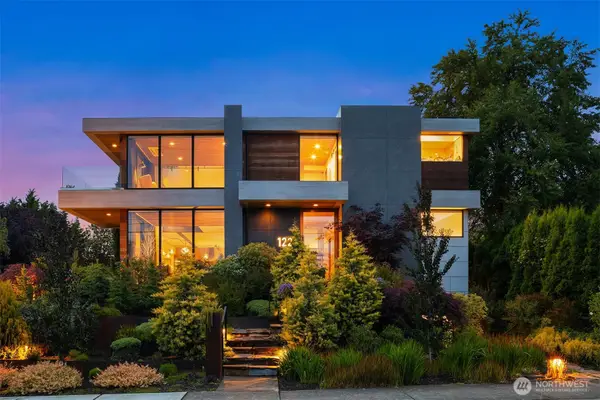 $3,998,000Active5 beds 6 baths4,902 sq. ft.
122 10th Avenue, Kirkland, WA 98033
MLS# 2480297Listed by: WINDERMERE REAL ESTATE/EAST $1,834,000Active3 beds 3 baths1,802 sq. ft.
1864 1st Street, Kirkland, WA 98033
MLS# 2471760Listed by: GILLIS REAL ESTATE LLC $1,698,500Active3 beds 3 baths1,584 sq. ft.
636 11th Avenue, Kirkland, WA 98033
MLS# 2471605Listed by: KELLER WILLIAMS EASTSIDE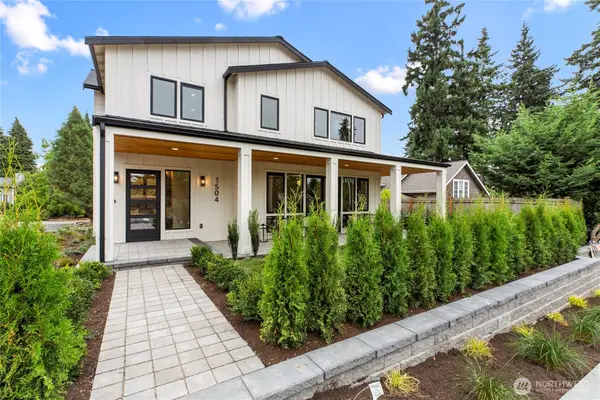 $2,699,950Pending4 beds 5 baths3,278 sq. ft.
1504 3rd Street, Kirkland, WA 98033
MLS# 2471262Listed by: COLDWELL BANKER BAIN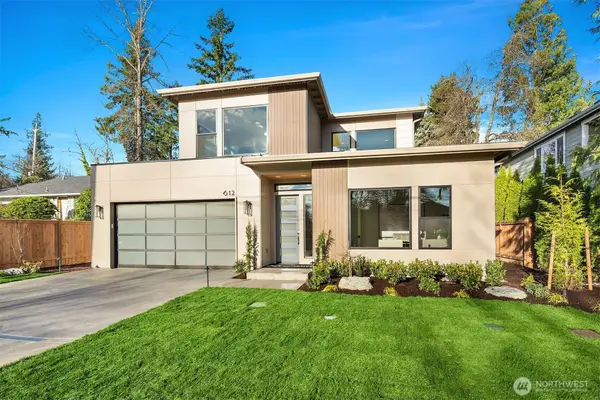 $3,575,000Pending5 beds 5 baths3,743 sq. ft.
612 11th Avenue, Kirkland, WA 98033
MLS# 2468285Listed by: REAL RESIDENTIAL $2,750,000Active6 beds 6 baths4,800 sq. ft.
1545 3rd St, Kirkland, WA 98033
MLS# 2466318Listed by: KW GREATER SEATTLE $5,390,000Active6 beds 6 baths7,261 sq. ft.
1813 3rd Street, Kirkland, WA 98033
MLS# 2458610Listed by: CHAMPIONS REAL ESTATE $1,185,000Active2 beds 3 baths1,291 sq. ft.
1919 3rd Street, Kirkland, WA 98033
MLS# 2442683Listed by: WINDERMERE R.E. NORTHEAST, INC $1,699,950Active3 beds 2 baths1,999 sq. ft.
639 12th Avenue, Kirkland, WA 98033
MLS# 2440304Listed by: RSVP BROKERS ERA $2,999,999Active5 beds 5 baths3,287 sq. ft.
138 8th Court, Kirkland, WA 98033
MLS# 2439692Listed by: WINDERMERE REAL ESTATE/EAST $2,999,999Active4 beds 5 baths3,722 sq. ft.
134 8th Court, Kirkland, WA 98033
MLS# 2439711Listed by: WINDERMERE REAL ESTATE/EAST $2,299,990Pending2 beds 3 baths2,171 sq. ft.
238 4th Avenue #200, Kirkland, WA 98033
MLS# 2402177Listed by: WINDERMERE REAL ESTATE/EAST $1,049,350Pending2 beds 2 baths1,188 sq. ft.
428 20th Avenue, Kirkland, WA 98033
MLS# 2359785Listed by: WINDERMERE R.E. NORTHEAST, INC $2,125,000Pending0.3 Acres
1043 5th Street, Kirkland, WA 98033
MLS# 2328604Listed by: PRIMESTREET REAL ESTATE LLC
Local realty services provided by:CENTURY 21 Real Estate Center
Listings courtesy of Northwest MLS as distributed by MLS GRID. Based on information submitted to the MLS GRID as of March 30, 2026. All data is obtained from various sources and may not have been verified by broker or MLS GRID. Supplied Open House Information is subject to change without notice. All information should be independently reviewed and verified for accuracy. Properties may or may not be listed by the office/agent presenting the information. Listing information is provided for consumers' personal, non-commercial use, solely to identify prospective properties for potential purchase; all other use is strictly prohibited and may violate relevant federal and state law. Information deemed reliable but not guaranteed. Copyright © 2026 MLS GRID. All Rights Reserved.
Popular neighborhoods near Norkirk, Kirkland, WA
Zip codes near Norkirk, Kirkland, WA
- 98004 homes for sale
- 98005 homes for sale
- 98007 homes for sale
- 98008 homes for sale
- 98011 homes for sale
- 98028 homes for sale
- 98033 homes for sale
- 98034 homes for sale
- 98039 homes for sale
- 98052 homes for sale
- 98072 homes for sale
- 98102 homes for sale
- 98103 homes for sale
- 98105 homes for sale
- 98112 homes for sale
- 98115 homes for sale
- 98122 homes for sale
- 98125 homes for sale
- 98133 homes for sale
- 98155 homes for sale
Counties near Norkirk, Kirkland, WA
- Chelan County homes for sale
- Clallam County homes for sale
- Grays Harbor County homes for sale
- Island County homes for sale
- Jefferson County homes for sale
- King County homes for sale
- Kitsap County homes for sale
- Kittitas County homes for sale
- Lewis County homes for sale
- Mason County homes for sale
- Pierce County homes for sale
- San Juan County homes for sale
- Skagit County homes for sale
- Snohomish County homes for sale
- Thurston County homes for sale
- Whatcom County homes for sale
Protect your home and budget from life's surprises with an Assurant Home Warranty, backed by a partner that supports you through every step of homeownership. Explore Plans.
©2026 Century 21 Real Estate LLC. All rights reserved. CENTURY 21®, the CENTURY 21 Logo and C21® are service marks owned by Century 21 Real Estate LLC. Century 21 Real Estate LLC fully supports the principles of the Fair Housing Act and the Equal Opportunity Act. Each office is independently owned and operated. Listing information is deemed reliable but not guaranteed accurate.