- Capitol Hill, North Salt Lake homes for sale
- DeSoto, Salt Lake City homes for sale
- Downtown Ogden, Ogden homes for sale
- East Bench, Ogden homes for sale
- East Central, Ogden homes for sale
- Ensign Downs, Salt Lake City homes for sale
- Foxboro, North Salt Lake homes for sale
- Greater Avenues, Salt Lake City homes for sale
- Morton Meadows, Salt Lake City homes for sale
- North End, Ogden homes for sale
- North Rose Park, Salt Lake City homes for sale
- Northcrest, Salt Lake City homes for sale
- Rose Park, Salt Lake City homes for sale
- Shadow Valley, Ogden homes for sale
- South Rose Park, Salt Lake City homes for sale
- Valentine Estates, Woods Cross homes for sale
- West Capitol Hill, Salt Lake City homes for sale
- West Haven, West Haven homes for sale
- West Ogden, Ogden homes for sale
- Westpointe, Salt Lake City homes for sale
Ogden, UT - homes for sale
300 of 764 results displayed
- New
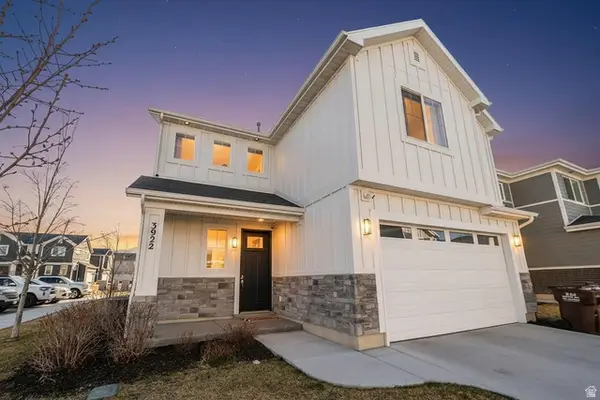 $482,000Active3 beds 3 baths1,852 sq. ft.
3922 S 2950 W, West Haven, UT 84401
MLS# 2142982Listed by: RED ROCK REAL ESTATE LLC - New
 $815,000Active7 beds 4 baths4,373 sq. ft.
2316 N 3825 W, Plain City, UT 84404
MLS# 2142987Listed by: BESST REALTY GROUP LLC - New
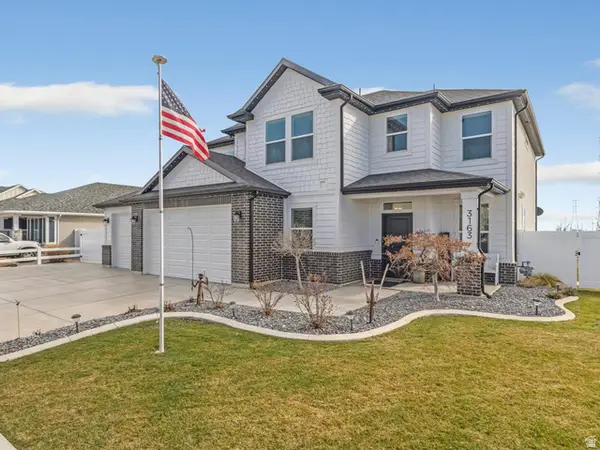 $750,000Active4 beds 3 baths2,655 sq. ft.
3163 W 3050 N, Plain City, UT 84404
MLS# 2142956Listed by: EXP REALTY, LLC - New
 $450,000Active3 beds 2 baths1,738 sq. ft.
2660 S Jefferson Ave, Ogden, UT 84401
MLS# 2142965Listed by: UTAH REAL ESTATE PC - New
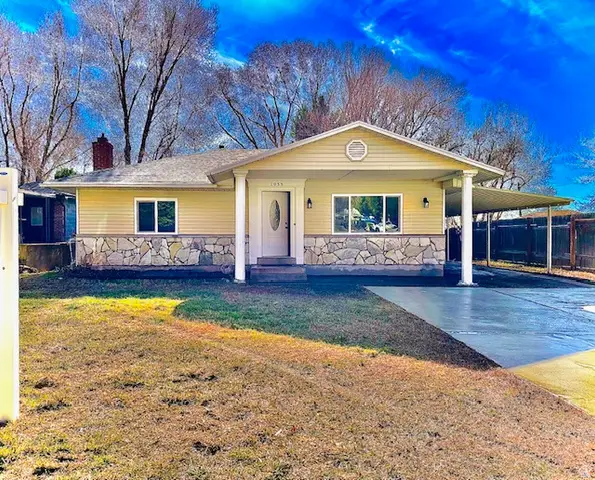 $409,900Active3 beds 2 baths2,224 sq. ft.
1055 Collins Blvd, Ogden, UT 84404
MLS# 2142922Listed by: EQUITY REAL ESTATE - Open Sat, 12 to 2pmNew
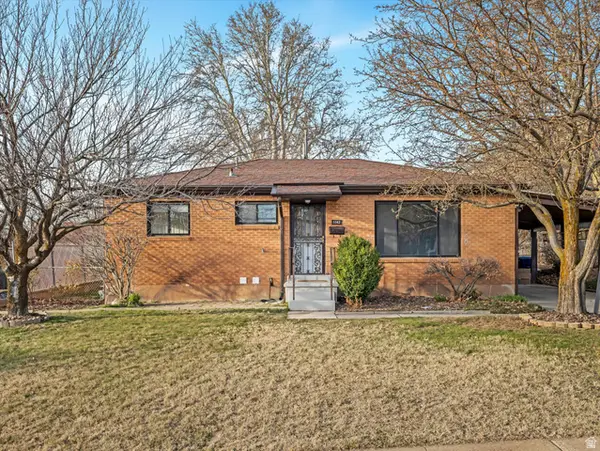
 $333,000Active3 beds 1 baths1,101 sq. ft.
788 E North St N, Ogden, UT 84404
MLS# 2142815Listed by: ATTENTION TO DETAIL REALTY LLC - New

 $429,900Active5 beds 2 baths2,154 sq. ft.
2102 S Harrison Blvd E, Ogden, UT 84401
MLS# 2142891Listed by: CENTURY 21 N & N REALTORS - Open Sat, 3 to 5pmNew
 $450,000Active4 beds 2 baths2,028 sq. ft.
1042 E Douglas N, Ogden, UT 84404
MLS# 2142772Listed by: REAL BROKER, LLC - New
 $399,900Active5 beds 3 baths2,512 sq. ft.
619 28 Th St, Ogden, UT 84403
MLS# 2142780Listed by: REALTYPATH LLC (SUMMIT) - New
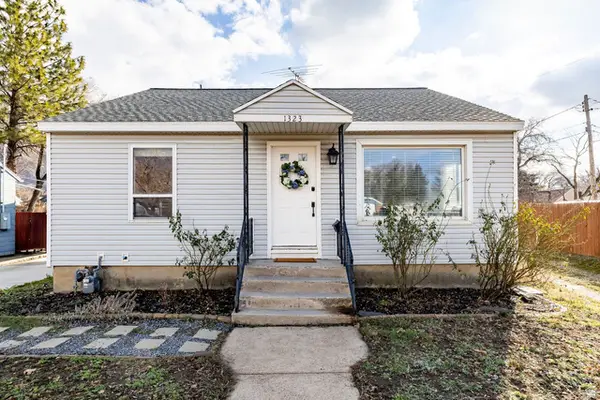 $447,500Active3 beds 2 baths1,740 sq. ft.
1323 E 22nd St S, Ogden, UT 84401
MLS# 2142737Listed by: SUMMIT SOTHEBY'S INTERNATIONAL REALTY - Open Sat, 12 to 3pmNew
 $695,000Active5 beds 3 baths3,408 sq. ft.
5341 Fillmore Ave, South Ogden, UT 84403
MLS# 2142327Listed by: REAL ESTATE ESSENTIALS  $84,900Active3 beds 2 baths1,300 sq. ft.
900 S Century Dr. S #101, Ogden, UT 84404
MLS# 2124006Listed by: EQUITY REAL ESTATE (SELECT)- New
 $349,900Active5 beds 2 baths1,976 sq. ft.
2930 Adams Ave, Ogden, UT 84403
MLS# 2142532Listed by: REALTYPATH LLC (SUMMIT) - New
 $441,000Active4 beds 3 baths2,131 sq. ft.
3167 W 3725 S, West Haven, UT 84401
MLS# 2142549Listed by: ALLIANCE RESIDENTIAL REAL ESTATE LLC - New
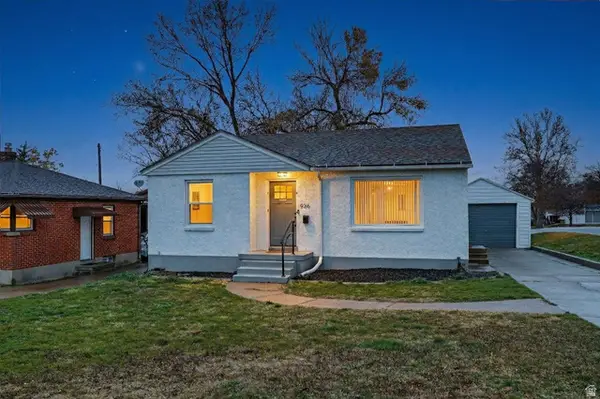 $300,000Active4 beds 2 baths1,720 sq. ft.
936 36th St, Ogden, UT 84403
MLS# 2142515Listed by: EXP REALTY, LLC - New
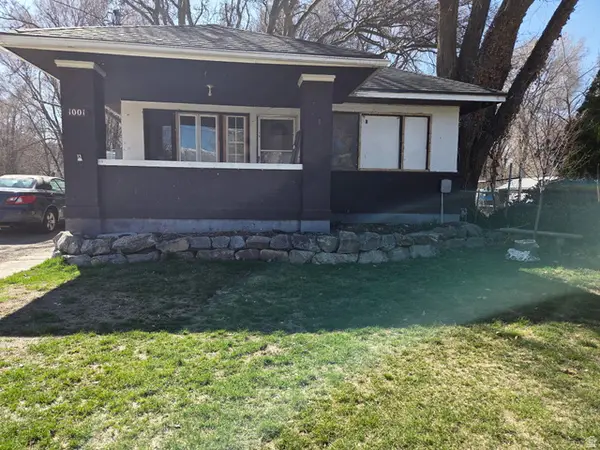 $350,000Active4 beds 1 baths1,900 sq. ft.
1001 16th St, Ogden, UT 84404
MLS# 2142461Listed by: ERA BROKERS CONSOLIDATED (OGDEN) - Open Sat, 12 to 3pmNew
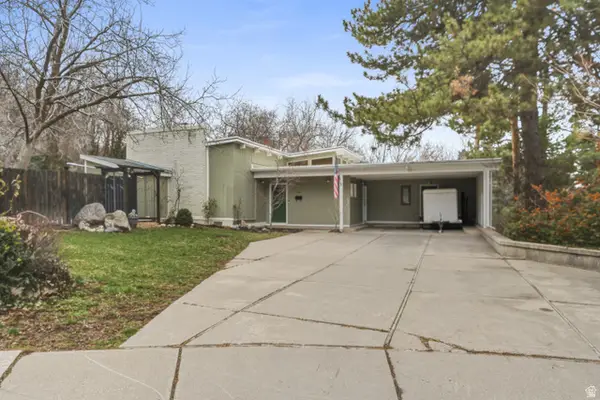 $910,000Active5 beds 3 baths3,638 sq. ft.
3417 S Fillmore, Ogden, UT 84403
MLS# 2142408Listed by: RIDGELINE REALTY - New
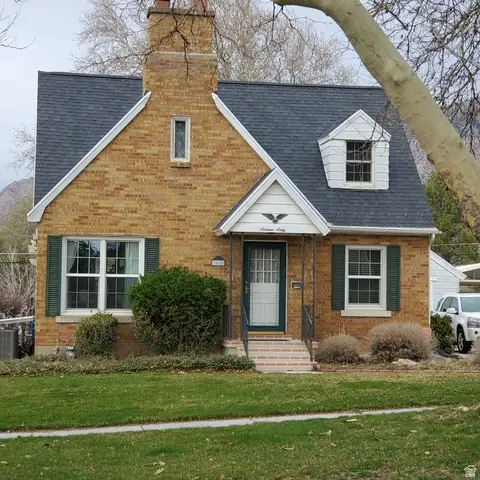 $548,000Active3 beds 3 baths2,468 sq. ft.
1660 E 26th St S, Ogden, UT 84401
MLS# 2142413Listed by: REALTY BROKERS ROBINSON & ASSOCIATES - New
 $1,500,000Active0.72 Acres
159 E 21st St, Ogden, UT 84401
MLS# 2142381Listed by: EQUITY REAL ESTATE (PREMIER ELITE) - Open Sat, 12 to 2pmNew
 $395,000Active2 beds 1 baths1,766 sq. ft.
3658 S Jefferson Ave E, Ogden, UT 84403
MLS# 2142398Listed by: WINDERMERE REAL ESTATE (LAYTON BRANCH) - New
 $544,900Active3 beds 2 baths2,308 sq. ft.
3787 S 4250 W #A, West Haven, UT 84401
MLS# 2142307Listed by: BROUGH REALTY 2 LLC  $950,000Pending5 beds 4 baths5,200 sq. ft.
1644 E Wasatch Dr, Ogden, UT 84403
MLS# 2142254Listed by: MOUNTAIN VALLEY REALTY- New
 $320,000Active4 beds 1 baths1,535 sq. ft.
1419 S Grant, Ogden, UT 84404
MLS# 2142150Listed by: REALTYPATH LLC - Open Sat, 12:30 to 3:30pmNew
 $407,997Active4 beds 3 baths1,786 sq. ft.
615 S Plum Creek Ln E, Ogden, UT 84404
MLS# 2141852Listed by: TRANSCEND REAL ESTATE - New
 $210,000Active2 beds 1 baths846 sq. ft.
5660 S Meadow Ln #140, Ogden, UT 84403
MLS# 2142100Listed by: WASATCH GROUP REAL ESTATE - New
 $850,000Active5 beds 3 baths3,428 sq. ft.
4253 S Spring Rd E, Ogden, UT 84403
MLS# 2142103Listed by: EXP REALTY, LLC - New
 $437,000Active3 beds 3 baths1,858 sq. ft.
1987 Birch Cove St, Ogden, UT 84401
MLS# 2142117Listed by: KW SUCCESS KELLER WILLIAMS REALTY - EDEN - New
 $250,000Active2 beds 1 baths944 sq. ft.
1842 E 5625 S #C, Ogden, UT 84403
MLS# 2142123Listed by: PAK HOME REALTY - New
 $440,000Active4 beds 2 baths1,583 sq. ft.
848 E Wood St, Ogden, UT 84404
MLS# 2142086Listed by: REALTYPATH LLC - New
 $539,000Active5 beds 3 baths2,720 sq. ft.
986 E 1200 N, Ogden, UT 84404
MLS# 2142077Listed by: REALTYPATH LLC - Open Sat, 11am to 2pmNew
 $385,000Active3 beds 3 baths1,345 sq. ft.
598 Plum Ln, Ogden, UT 84404
MLS# 2142080Listed by: RE/MAX COMMUNITY- VALLEY - New
 $589,000Active3 beds 3 baths2,028 sq. ft.
740 N 175 E, Harrisville, UT 84404
MLS# 2142047Listed by: WINDERMERE REAL ESTATE (LAYTON BRANCH) - New
 $47,000Active3 beds 2 baths1,056 sq. ft.
900 Century Dr #92, Ogden, UT 84404
MLS# 2141946Listed by: REAL BROKER, LLC - New
 $320,000Active3 beds 2 baths1,404 sq. ft.
1616 S Fowler, Ogden, UT 84404
MLS# 2141897Listed by: CENTURY 21 EVEREST (CENTERVILLE) - Open Sat, 12 to 1pmNew
 $470,000Active5 beds 2 baths2,024 sq. ft.
1019 E 1100 N, Ogden, UT 84404
MLS# 2141857Listed by: EQUITY REAL ESTATE (SOLID) - New
 $830,000Active9 beds 6 baths4,947 sq. ft.
2946 Ogden Ave, Ogden, UT 84403
MLS# 2141837Listed by: R AND R REALTY LLC - New
 $230,000Active1 beds 1 baths656 sq. ft.
2262 Monroe Blvd, Ogden, UT 84401
MLS# 2141823Listed by: KW SUCCESS KELLER WILLIAMS REALTY - Open Sat, 11am to 2pmNew
 $415,000Active6 beds 2 baths2,280 sq. ft.
2319 Harrison Blvd, Ogden, UT 84401
MLS# 2141807Listed by: EQUITY REAL ESTATE - New
 $310,000Active3 beds 1 baths1,248 sq. ft.
815 E 22nd St, Ogden, UT 84401
MLS# 2141712Listed by: REAL TEAM REALTY LLC - New
 $350,000Active3 beds 1 baths1,330 sq. ft.
1134 28th St, Ogden, UT 84403
MLS# 2141687Listed by: ERA BROKERS CONSOLIDATED (OGDEN) - New
 $599,900Active3 beds 3 baths4,864 sq. ft.
1773 Meadow Creek Lane, Ogden, UT 84403
MLS# 2141410Listed by: EQUITY REAL ESTATE (BEAR RIVER) - New
 $495,000Active3 beds 2 baths1,847 sq. ft.
1675 E 27th Street, Ogden, UT 84403
MLS# 2141452Listed by: SUMMIT SOTHEBY'S INTERNATIONAL REALTY - New
 $495,000Active4 beds 2 baths2,074 sq. ft.
2084 Robins Ave, Ogden, UT 84401
MLS# 2141495Listed by: RE/MAX ASSOCIATES - New
 $219,000Active2 beds 2 baths936 sq. ft.
1325 Lincoln Ave #43, Ogden, UT 84404
MLS# 2141291Listed by: KW UTAH REALTORS KELLER WILLIAMS (BRICKYARD)  $360,000Pending3 beds 2 baths1,466 sq. ft.
574 E 15th St S, Ogden, UT 84404
MLS# 2141376Listed by: EQUITY REAL ESTATE (SELECT)- New
 $385,000Active4 beds 2 baths1,380 sq. ft.
965 N Liberty Ave, Ogden, UT 84404
MLS# 2141382Listed by: LRG COLLECTIVE - New
 $399,900Active5 beds 3 baths1,654 sq. ft.
3031 Monroe Blvd, Ogden, UT 84403
MLS# 2141154Listed by: REALTYPATH LLC (SOUTH VALLEY)  $665,000Pending4 beds 3 baths3,310 sq. ft.
1443 E Washakie Cir S, Ogden, UT 84403
MLS# 2141166Listed by: REAL BROKER, LLC- New
 $585,000Active4 beds 3 baths3,763 sq. ft.
1402 E Capitol St S, Ogden, UT 84401
MLS# 2141059Listed by: EXP REALTY, LLC - New
 $339,900Active3 beds 3 baths1,529 sq. ft.
432 W 1100 S, Ogden, UT 84404
MLS# 2140988Listed by: KW SOUTH VALLEY KELLER WILLIAMS - New
 $320,000Active3 beds 1 baths1,000 sq. ft.
1097 W Goodyear N, Ogden, UT 84404
MLS# 2140982Listed by: EQUITY REAL ESTATE (SELECT) - New
 $389,990Active4 beds 3 baths1,869 sq. ft.
1442 S 410 E #134, Ogden, UT 84404
MLS# 2140969Listed by: D.R. HORTON, INC  $475,000Pending4 beds 2 baths2,128 sq. ft.
1550 E 34 St S, Ogden, UT 84403
MLS# 2140842Listed by: REAL BROKER, LLC- Open Sat, 11am to 1:30pmNew
 $269,000Active2 beds 2 baths1,024 sq. ft.
1565 E 775 S #16, Ogden, UT 84404
MLS# 2140764Listed by: REAL BROKER, LLC - New
 $330,000Active4 beds 2 baths2,146 sq. ft.
902 E 1140 S #17, Ogden, UT 84404
MLS# 2140741Listed by: KW SUCCESS KELLER WILLIAMS REALTY - New
 $449,900Active6 beds 3 baths2,184 sq. ft.
1108 E 5th St, Ogden, UT 84404
MLS# 2140722Listed by: ASPEN RIDGE REAL ESTATE LLC  $409,900Pending3 beds 2 baths1,600 sq. ft.
1346 E Lake St S, Ogden, UT 84401
MLS# 2140625Listed by: RE/MAX CROSSROADS- New
 $360,000Active3 beds 2 baths1,631 sq. ft.
715 S 350 E #2, Ogden, UT 84401
MLS# 2140593Listed by: EXCEL REALTY INC.  $350,000Active5 beds 2 baths1,650 sq. ft.
966 30th St, Ogden, UT 84403
MLS# 2135812Listed by: EQUITY REAL ESTATE (SELECT) $348,000Pending3 beds 3 baths1,671 sq. ft.
326 E 750 S #9, Ogden, UT 84401
MLS# 2140517Listed by: EXCEL REALTY INC.- New
 $342,500Active3 beds 3 baths1,704 sq. ft.
313 E 750 S #11, Ogden, UT 84401
MLS# 2140477Listed by: EXCEL REALTY INC. - Open Sat, 11am to 1pmNew
 $363,000Active2 beds 1 baths1,786 sq. ft.
2575 Jackson Ave, Ogden, UT 84401
MLS# 2140471Listed by: REALTYPATH LLC (SUMMIT) - New
 $375,000Active3 beds 2 baths1,323 sq. ft.
1243 Grant Ave, Ogden, UT 84404
MLS# 2140439Listed by: KW SUCCESS KELLER WILLIAMS REALTY (LAYTON) - New
 $400,000Active3 beds 3 baths1,510 sq. ft.
404 Meadowbrook Dr., Ogden, UT 84404
MLS# 2140436Listed by: EQUITY REAL ESTATE (SELECT) - New
 $285,000Active2 beds 1 baths1,416 sq. ft.
426 Grant Ave, Ogden, UT 84404
MLS# 2140356Listed by: UPSIDE REAL ESTATE - New
 $265,000Active3 beds 1 baths940 sq. ft.
3856 S Grandview Dr E, Ogden, UT 84403
MLS# 2140289Listed by: EQUITY REAL ESTATE (SOLID) - Open Sat, 12 to 2pmNew
 $290,000Active3 beds 1 baths1,157 sq. ft.
658 23rd St #1, Ogden, UT 84401
MLS# 2140253Listed by: REAL BROKER, LLC - New
 $691,000Active5 beds 2 baths1,952 sq. ft.
600 S Lincoln Ave #REAR, Ogden, UT 84404
MLS# 2140195Listed by: REAL ESTATE UNLIMITED - New
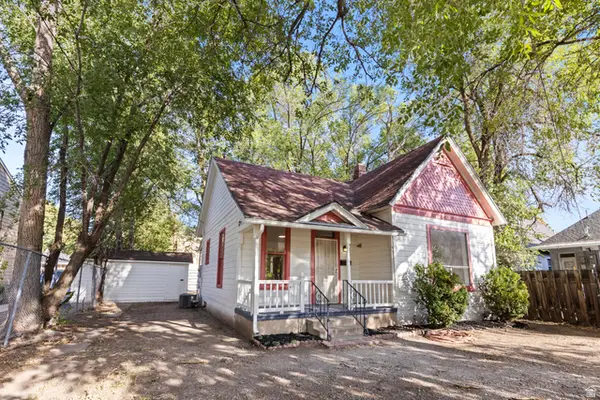
 $385,000Active3 beds 2 baths1,266 sq. ft.
1309 S 1040 E, Ogden, UT 84404
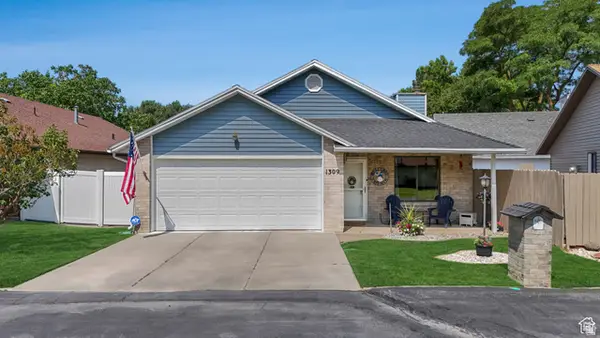
MLS# 2140210Listed by: PORTER ONE REALTY LLC  $480,000Active5 beds 2 baths3,612 sq. ft.
827 E 26th St, Ogden, UT 84401
MLS# 2140148Listed by: REALTYPATH LLC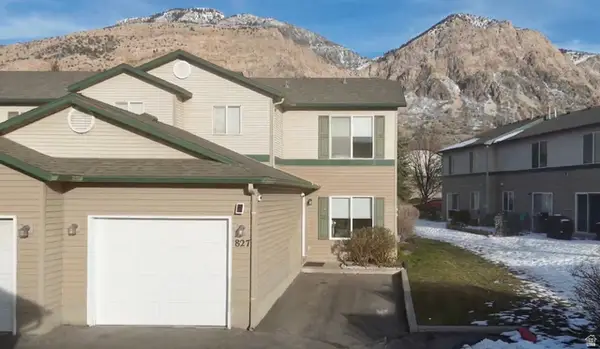 $300,000Active2 beds 2 baths1,317 sq. ft.
827 E 760 N, Ogden, UT 84404
MLS# 2140112Listed by: STONEFLY REAL ESTATE LLC $385,000Pending3 beds 2 baths1,744 sq. ft.
925 36th St, Ogden, UT 84403
MLS# 2140091Listed by: RIDGELINE REALTY- Open Sat, 11am to 1pm
 $512,000Active3 beds 3 baths1,552 sq. ft.
3194 N 3450 W, Plain City, UT 84404
MLS# 2140075Listed by: EQUITY REAL ESTATE (SELECT) - Open Sat, 12 to 2pm
 $409,000Active4 beds 2 baths2,010 sq. ft.
3142 S Ogden Ave E, Ogden, UT 84401
MLS# 2140056Listed by: EQUITY REAL ESTATE  $1,790,000Active5 beds 4 baths8,295 sq. ft.
5304 S Skyline Pkwy, Ogden, UT 84403
MLS# 2140048Listed by: EQUITY REAL ESTATE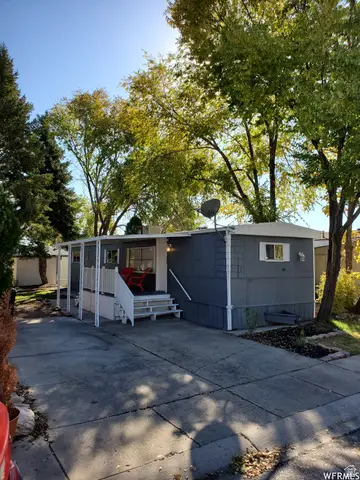 $30,000Active2 beds 1 baths900 sq. ft.
461 E 960 N, Ogden, UT 84404
MLS# 2139940Listed by: RE/MAX ASSOCIATES $325,000Pending2 beds 1 baths1,280 sq. ft.
3254 Quincy Ave, Ogden, UT 84403
MLS# 2139951Listed by: GOLDEN SPIKE REALTY $29,500Active1 beds 1 baths600 sq. ft.
200 Harrisville Rd #21, Ogden, UT 84404
MLS# 2139868Listed by: KW UTAH REALTORS KELLER WILLIAMS (BRICKYARD) $419,000Active3 beds 3 baths1,798 sq. ft.
3326 W 3715 S, West Haven, UT 84401
MLS# 2139830Listed by: REAL BROKER, LLC $60,000Active3 beds 2 baths1,000 sq. ft.
900 Century Dr #7, Ogden, UT 84404
MLS# 2139754Listed by: EXP REALTY, LLC $385,000Active2 beds 2 baths2,656 sq. ft.
572 N Van Buren Ave, Ogden, UT 84404
MLS# 2139766Listed by: REAL BROKER, LLC $232,000Pending2 beds 1 baths720 sq. ft.
3913 Jackson Ave, South Ogden, UT 84403
MLS# 2139662Listed by: REAL BROKER, LLC $184,999Active1 beds 1 baths544 sq. ft.
1175 Canyon Rd #77, Ogden, UT 84404
MLS# 2139728Listed by: REAL BROKER, LLC $350,000Active4 beds 2 baths1,668 sq. ft.
3925 S Evelyn Rd E, Ogden, UT 84403
MLS# 2139711Listed by: EXP REALTY, LLC $370,000Pending3 beds 2 baths1,160 sq. ft.
870 S Sunflower Dr W, Ogden, UT 84404
MLS# 2139654Listed by: GOLDEN SPIKE REALTY $158,000Active1 beds 1 baths576 sq. ft.
1175 Canyon Rd #A21, Ogden, UT 84404
MLS# 2139638Listed by: FROERER REAL ESTATE AND PROPERTY MANAGEMENT LLC $412,000Active4 beds 2 baths1,768 sq. ft.
2337 S Custer Ave, Ogden, UT 84401
MLS# 2139562Listed by: CITYHOME COLLECTIVE $350,000Active3 beds 3 baths1,670 sq. ft.
1695 E 1425 S, Ogden, UT 84404
MLS# 2139545Listed by: BRIX REAL ESTATE $384,900Active3 beds 3 baths1,533 sq. ft.
3959 S 3485 W, West Haven, UT 84401
MLS# 2139453Listed by: BESST REALTY GROUP LLC $360,000Active4 beds 1 baths1,824 sq. ft.
845 Binford St, Ogden, UT 84401
MLS# 2139368Listed by: RE/MAX ASSOCIATES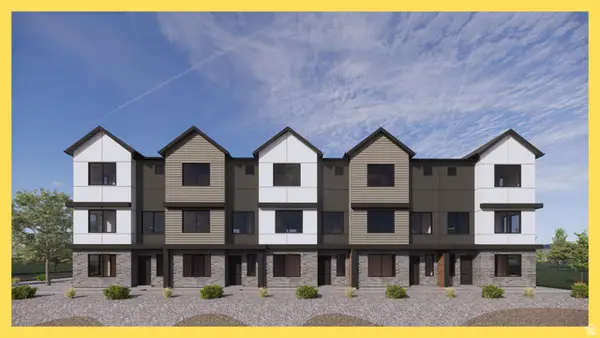 $379,990Active4 beds 3 baths1,857 sq. ft.
1446 S 410 St E #135, Ogden, UT 84404
MLS# 2139380Listed by: D.R. HORTON, INC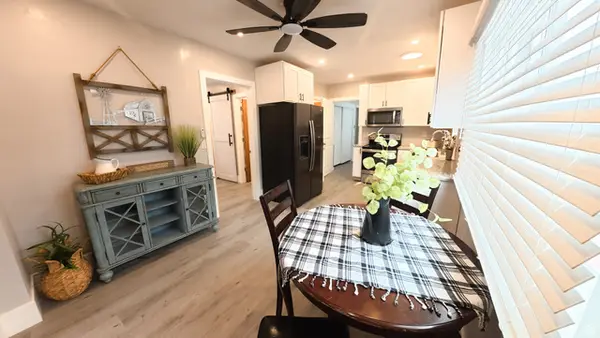 $368,000Active2 beds 1 baths1,230 sq. ft.
425 Canyon Rd, Ogden, UT 84404
MLS# 2139387Listed by: INTERMOUNTAIN PROPERTIES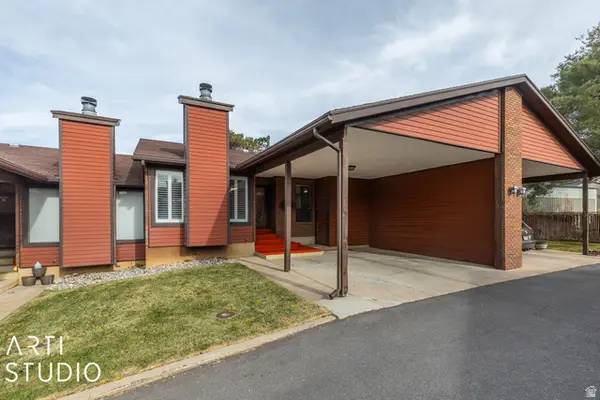 $324,900Active3 beds 2 baths2,254 sq. ft.
1314 E 1990 S #24, Ogden, UT 84401
MLS# 2139363Listed by: ERA BROKERS CONSOLIDATED (OGDEN)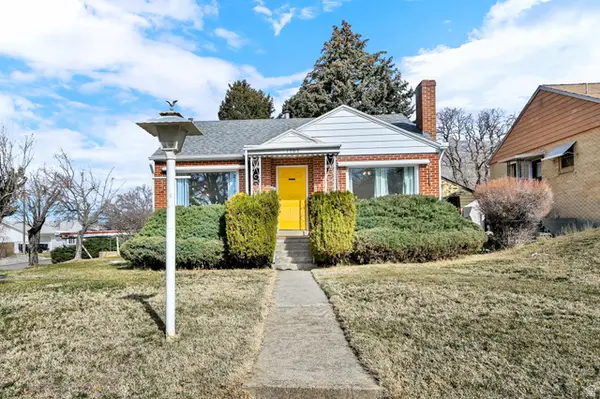 $460,000Active3 beds 2 baths1,890 sq. ft.
1702 Capitol St, Ogden, UT 84401
MLS# 2139302Listed by: KW SUCCESS KELLER WILLIAMS REALTY (LAYTON) $415,000Active3 beds 2 baths1,450 sq. ft.
1670 Swan St, Ogden, UT 84401
MLS# 2139257Listed by: BERKSHIRE HATHAWAY HOMESERVICES UTAH PROPERTIES (SO OGDEN) $259,900Active2 beds 2 baths1,080 sq. ft.
1266 S 950 E, Ogden, UT 84404
MLS# 2133288Listed by: LA QUINTA REALTY LLC $379,900Pending3 beds 2 baths1,102 sq. ft.
2150 S Fillmore Ave E, Ogden, UT 84401
MLS# 2139164Listed by: COLDWELL BANKER REALTY (SOUTH OGDEN) $275,000Pending4 beds 2 baths1,988 sq. ft.
3085 Quincy Ave, Ogden, UT 84403
MLS# 2139128Listed by: KW UTAH REALTORS KELLER WILLIAMS (BRICKYARD) $250,000Active2 beds 1 baths1,350 sq. ft.
904 39th St, Ogden, UT 84403
MLS# 2139156Listed by: BRICK REALTY CO, LLC $369,900Active3 beds 3 baths1,516 sq. ft.
1430 Cobblestone Ln, Ogden, UT 84404
MLS# 2139071Listed by: COLDWELL BANKER REALTY (SOUTH OGDEN) $769,900Pending5 beds 3 baths3,814 sq. ft.
1812 E Beus Dr, Ogden, UT 84403
MLS# 2138893Listed by: RE/MAX CROSSROADS $339,900Active2 beds 1 baths1,087 sq. ft.
105 W North St N, Ogden, UT 84404
MLS# 2138904Listed by: CASTLECREEK REAL ESTATE $260,000Pending2 beds 2 baths1,080 sq. ft.
935 E 1250 S, Ogden, UT 84404
MLS# 2138874Listed by: REAL BROKER, LLC $524,900Pending3 beds 3 baths1,537 sq. ft.
3452 W 3275 N, Plain City, UT 84404
MLS# 2135107Listed by: BESST REALTY GROUP LLC $339,900Pending3 beds 3 baths1,529 sq. ft.
423 W 1025 S, Ogden, UT 84404
MLS# 2138836Listed by: KW SOUTH VALLEY KELLER WILLIAMS $399,000Active5 beds 2 baths1,718 sq. ft.
1284 E 22nd St S, Ogden, UT 84401
MLS# 2138759Listed by: MS2 & ASSOCIATES LLC $569,000Active4 beds 3 baths2,385 sq. ft.
4335 W 3490 S, West Haven, UT 84401
MLS# 2138722Listed by: KW SUCCESS KELLER WILLIAMS REALTY $450,000Active4 beds 2 baths1,840 sq. ft.
1757 E Cahoon St, Ogden, UT 84401
MLS# 2138723Listed by: PRESIDIO REAL ESTATE $420,000Active4 beds 2 baths1,936 sq. ft.
541 E Cook St, Ogden, UT 84404
MLS# 2138680Listed by: REALTYPATH LLC $429,990Active4 beds 2 baths1,610 sq. ft.
973 21st St, Ogden, UT 84401
MLS# 2138652Listed by: MS2 & ASSOCIATES LLC $89,000Active3 beds 2 baths1,576 sq. ft.
1450 N Washington Blvd #2, Ogden, UT 84404
MLS# 2138648Listed by: KW SUCCESS KELLER WILLIAMS REALTY (LAYTON) $405,000Pending4 beds 2 baths1,430 sq. ft.
1042 N Gramercy Ave, Ogden, UT 84404
MLS# 2138608Listed by: REAL BROKER, LLC $319,900Pending2 beds 1 baths1,540 sq. ft.
802 Canyon Rd, Ogden, UT 84404
MLS# 2138529Listed by: ERA BROKERS CONSOLIDATED (OGDEN)- Open Sat, 1 to 3pm
 $419,900Active3 beds 2 baths1,570 sq. ft.
1502 25th St, Ogden, UT 84401
MLS# 2138545Listed by: INTERMOUNTAIN PROPERTIES  $634,900Active7 beds 4 baths3,332 sq. ft.
527 28th St, Ogden, UT 84403
MLS# 2138554Listed by: REAL BROKER, LLC $349,900Active3 beds 3 baths1,529 sq. ft.
419 W 1025 S, Ogden, UT 84404
MLS# 2138567Listed by: KW SOUTH VALLEY KELLER WILLIAMS- Open Sat, 11am to 1pm
 $519,900Active4 beds 2 baths2,046 sq. ft.
403 Highland Dr, Ogden, UT 84405
MLS# 2138572Listed by: ICONIC: REALTY NETWORK, LLP  $53,500Pending3 beds 2 baths1,716 sq. ft.
536 E 1050 N #105, Ogden, UT 84404
MLS# 2138401Listed by: EQUITY REAL ESTATE (SELECT)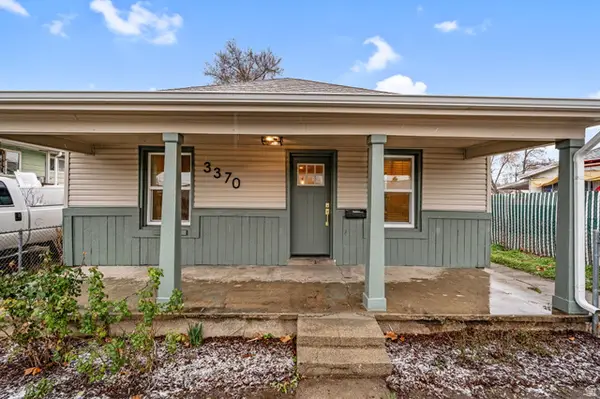 $325,000Active3 beds 2 baths1,062 sq. ft.
3370 Lincoln Ave, Ogden, UT 84401
MLS# 2138429Listed by: REALTY ONE GROUP SIGNATURE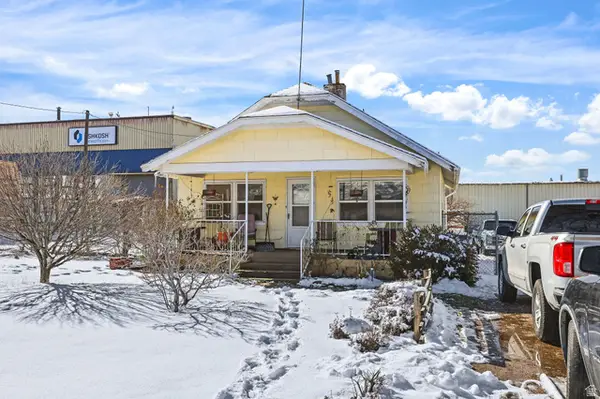 $650,000Active4 beds 1 baths1,768 sq. ft.
2985 Pennsylvania Ave, Ogden, UT 84401
MLS# 2138446Listed by: EQUITY REAL ESTATE $399,900Active3 beds 1 baths1,776 sq. ft.
1224 24th St, Ogden, UT 84401
MLS# 2138359Listed by: CENTURY 21 EVEREST $450,000Active3 beds 3 baths1,690 sq. ft.
1014 Creekside Dr, Ogden, UT 84404
MLS# 2138337Listed by: MANSELL REAL ESTATE INC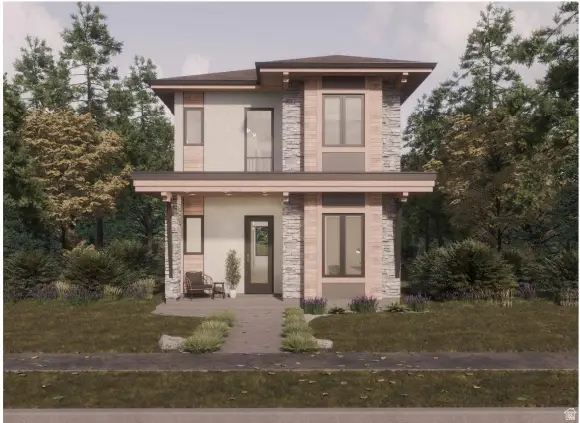 $130,000Active0.14 Acres
2671 S Monroe Blvd E, Ogden, UT 84401
MLS# 2137970Listed by: REALTYPATH LLC (SOUTH VALLEY)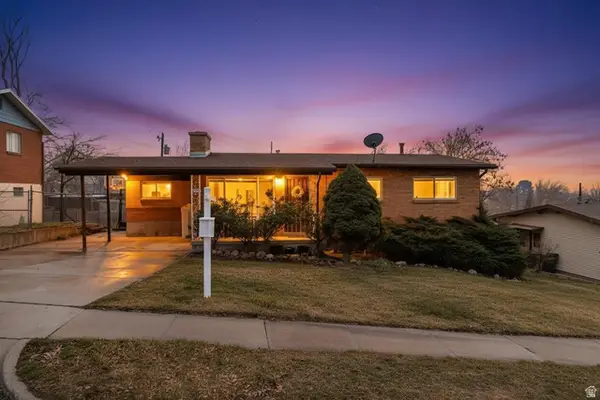 $390,000Pending4 beds 3 baths2,016 sq. ft.
1453 E Lewis Dr. S, Ogden, UT 84404
MLS# 2137941Listed by: PRESIDIO REAL ESTATE (RIVER HEIGHTS)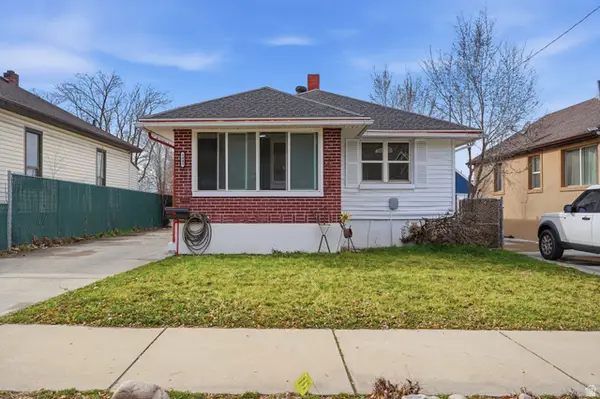 $334,999Active2 beds 1 baths936 sq. ft.
3445 Adams Ave, Ogden, UT 84403
MLS# 2137917Listed by: COLDWELL BANKER REALTY (SOUTH OGDEN)- $420,000Pending5 beds 1 baths1,872 sq. ft.
259 N Harrisville Rd, Ogden, UT 84404
MLS# 2137621Listed by: NORTHERN REALTY INC 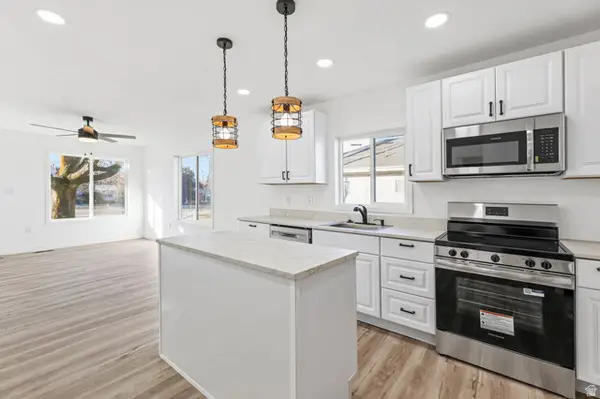 $319,000Active2 beds 1 baths910 sq. ft.
664 30th St, Ogden, UT 84403
MLS# 2137637Listed by: EQUITY REAL ESTATE (SOUTH VALLEY) $339,900Active3 beds 2 baths2,254 sq. ft.
1312 E 2025 S, Ogden, UT 84401
MLS# 2137674Listed by: BETTER HOMES AND GARDENS REAL ESTATE MOMENTUM (OGDEN) $565,000Active5 beds 3 baths3,836 sq. ft.
2524 Van Buren Ave, Ogden, UT 84401
MLS# 2137541Listed by: KW SUCCESS KELLER WILLIAMS REALTY $12,000Active2 beds 1 baths850 sq. ft.
900 Century Dr #60, Ogden, UT 84404
MLS# 2137513Listed by: JPAR SILVERPATH $350,000Pending3 beds 2 baths1,488 sq. ft.
2736 S Grants Ave W, Ogden, UT 84401
MLS# 2137517Listed by: SUN KEY REALTY LLC (SALT LAKE CITY) $325,000Pending3 beds 1 baths1,150 sq. ft.
2168 Adams Ave, Ogden, UT 84401
MLS# 2137518Listed by: ERA BROKERS CONSOLIDATED (OGDEN) $549,000Active4 beds 3 baths2,543 sq. ft.
994 Mountain Road, Ogden, UT 84404
MLS# 2137471Listed by: KW UNITE KELLER WILLIAMS LLC $581,571Active3 beds 2 baths1,849 sq. ft.
1775 S 3825 St W #216, Ogden, UT 84401
MLS# 2137366Listed by: MCARTHUR REALTY, LC $684,900Active5 beds 3 baths3,406 sq. ft.
1638 Country Hills Dr, Ogden, UT 84403
MLS# 2137357Listed by: ASPIRE REALTY GROUP $424,000Pending3 beds 3 baths1,775 sq. ft.
884 W 26th St S, Ogden, UT 84401
MLS# 2137320Listed by: REFINED REAL ESTATE LLC $424,000Pending3 beds 3 baths1,775 sq. ft.
895 W Lake St S, Ogden, UT 84401
MLS# 2137322Listed by: REFINED REAL ESTATE LLC $349,900Active5 beds 2 baths1,550 sq. ft.
622 E 21st St, Ogden, UT 84401
MLS# 2137198Listed by: RE/MAX COMMUNITY- VALLEY $400,000Pending3 beds 2 baths1,848 sq. ft.
1554 Capitol St, Ogden, UT 84401
MLS# 2137214Listed by: KW SUCCESS KELLER WILLIAMS REALTY $315,000Active3 beds 2 baths972 sq. ft.
862 W Lake St, Ogden, UT 84401
MLS# 2137119Listed by: ENCOMPASS REALTY GROUP LLC $379,900Active3 beds 2 baths1,840 sq. ft.
668 E 37th St, Ogden, UT 84403
MLS# 2137043Listed by: ICONIC: REALTY NETWORK, LLP $892,000Active4 beds 4 baths4,650 sq. ft.
1963 Cherokee Cir, Ogden, UT 84403
MLS# 2137050Listed by: MANSELL REAL ESTATE INC (DAVIS/WEBER) $394,000Active3 beds 3 baths1,772 sq. ft.
293 E 1500 N, Harrisville, UT 84404
MLS# 2137039Listed by: BESST REALTY GROUP LLC $575,000Active5 beds 3 baths2,572 sq. ft.
1070 40th St, Ogden, UT 84403
MLS# 2136635Listed by: PATHWAY PROPERTIES, LLC $335,000Pending2 beds 2 baths1,380 sq. ft.
573 26 St, Ogden, UT 84401
MLS# 2136966Listed by: EXP REALTY, LLC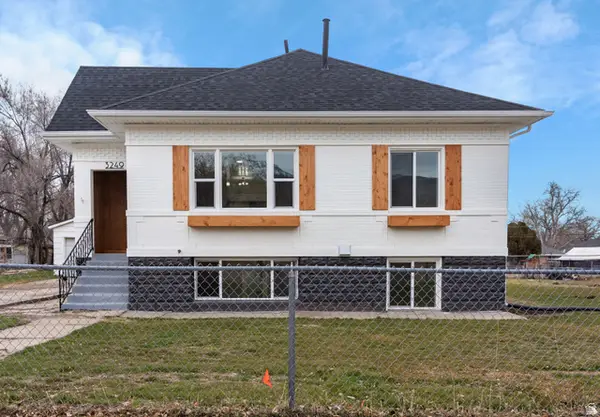 $450,000Pending5 beds 2 baths2,158 sq. ft.
3249 Jefferson Ave, Ogden, UT 84403
MLS# 2136969Listed by: REALTYPATH LLC (EXECUTIVES) $275,000Active4 beds 3 baths1,620 sq. ft.
1554 S Monroe #B-1, Ogden, UT 84404
MLS# 2136799Listed by: EQUITY REAL ESTATE $160,000Active0.32 Acres
188 N Harrison Blvd #2, Ogden, UT 84404
MLS# 2136767Listed by: OMADA REAL ESTATE $250,000Active3 beds 2 baths1,237 sq. ft.
749 30th St, Ogden, UT 84403
MLS# 2136746Listed by: REALTYPATH LLC (PRO) $145,000Active0.2 Acres
186 N Harrison Blvd #1, Ogden, UT 84404
MLS# 2136761Listed by: OMADA REAL ESTATE $425,000Active5 beds 2 baths2,210 sq. ft.
2864 Fowler Ave, Ogden, UT 84403
MLS# 2136697Listed by: UTAH HOME CENTRAL- $575,000Active5 beds 3 baths2,572 sq. ft.
1040 40th St, Ogden, UT 84403
MLS# 2136635Listed by: PATHWAY PROPERTIES, LLC  $700,000Active6 beds 3 baths3,760 sq. ft.
1436 Swan St, Ogden, UT 84401
MLS# 2136615Listed by: PATHWAY PROPERTIES, LLC $434,990Active4 beds 3 baths2,073 sq. ft.
306 E 1275 N #110, Harrisville, UT 84404
MLS# 2136619Listed by: D.R. HORTON, INC $260,000Active-- beds 2 baths1,024 sq. ft.
1565 E 775 S #7, Ogden, UT 84404
MLS# 2136532Listed by: PATHWAY PROPERTIES, LLC- New
 $475,000Active5 beds 3 baths2,561 sq. ft.
415 Jackson Ave, Ogden, UT 84404
MLS# 2140647Listed by: HOMEGROWN REALTY LLC  $358,999Active4 beds 2 baths2,016 sq. ft.
268 E 17th, Ogden, UT 84404
MLS# 2136398Listed by: HIVE REALTY GROUP PLLC- Open Sat, 1 to 3pm
 $430,000Active3 beds 2 baths1,570 sq. ft.
1549 E Binford St S, Ogden, UT 84401
MLS# 2136166Listed by: EXIT REALTY ADVANTAGE  $237,500Pending1 beds 1 baths871 sq. ft.
1255 E Valley Dr #2, Ogden, UT 84401
MLS# 2136140Listed by: ALL THINGS REAL ESTATE LLC $374,990Active3 beds 3 baths1,586 sq. ft.
302 E 1275 N #109, Harrisville, UT 84404
MLS# 2136029Listed by: D.R. HORTON, INC $310,000Pending1 beds 1 baths806 sq. ft.
263 N Harrisville Rd, Ogden, UT 84404
MLS# 2136000Listed by: NORTHERN REALTY INC $434,900Active4 beds 3 baths2,450 sq. ft.
848 Franklin St, Ogden, UT 84403
MLS# 2135980Listed by: JUPIDOOR LLC $400,000Active3 beds 2 baths1,350 sq. ft.
1265 Capitol St, Ogden, UT 84401
MLS# 2135914Listed by: REAL BROKER, LLC $628,000Active4 beds 3 baths2,486 sq. ft.
3106 W 3150 N, Plain City, UT 84404
MLS# 2135786Listed by: ALL AMERICAN REAL ESTATE, LLC $365,000Active4 beds 3 baths2,431 sq. ft.
680 Kershaw St S, Ogden, UT 84403
MLS# 2135699Listed by: LA QUINTA REALTY LLC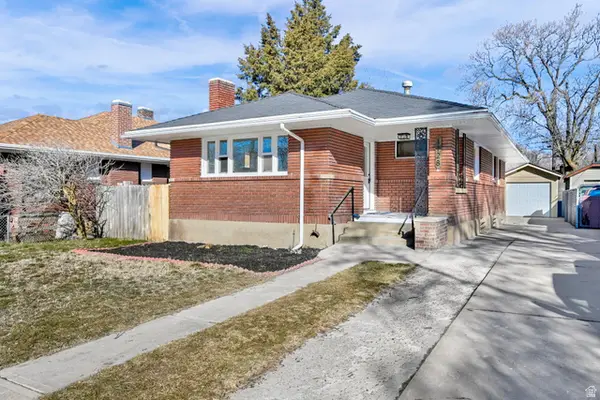 $419,900Active4 beds 2 baths1,887 sq. ft.
1128 E 23rd St, Ogden, UT 84401
MLS# 2135537Listed by: RE/MAX ASSOCIATES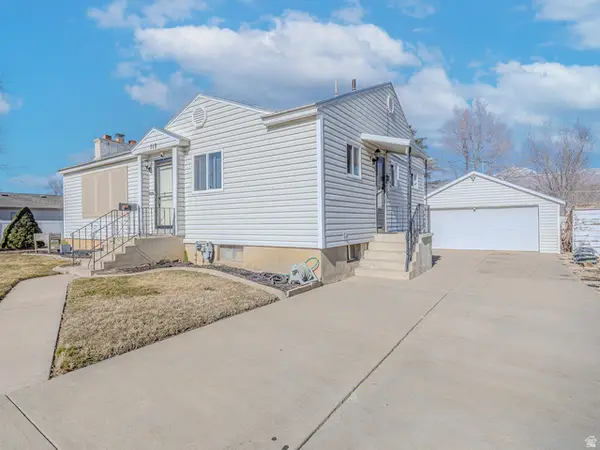 $389,500Active4 beds 2 baths2,684 sq. ft.
718 E 9th St S, Ogden, UT 84404
MLS# 2135479Listed by: EQUITY REAL ESTATE (SELECT)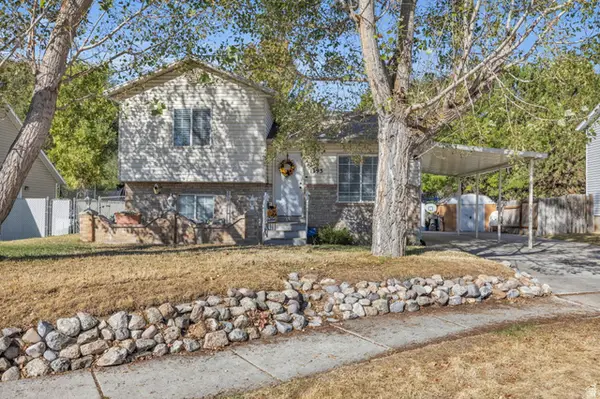 $394,000Pending3 beds 2 baths1,216 sq. ft.
1393 N 975 W, Ogden, UT 84404
MLS# 2135459Listed by: REAL BROKER, LLC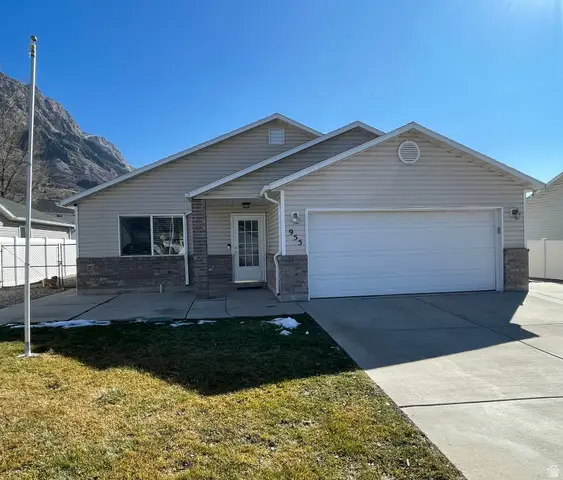 $419,000Pending3 beds 2 baths1,486 sq. ft.
955 E 825 N, Ogden, UT 84404
MLS# 2135435Listed by: REAL BROKER, LLC $400,000Pending4 beds 2 baths1,990 sq. ft.
1640 E 21st St, Ogden, UT 84401
MLS# 2125694Listed by: HIVE REALTY GROUP PLLC $285,000Active4 beds 2 baths1,346 sq. ft.
1424 Jefferson Ave, Ogden, UT 84404
MLS# 2135350Listed by: KW UTAH REALTORS KELLER WILLIAMS $410,000Active3 beds 2 baths1,712 sq. ft.
644 E 32nd St, Ogden, UT 84403
MLS# 2135204Listed by: IN DEPTH REALTY $799,900Pending5 beds 4 baths4,456 sq. ft.
1786 Ross Dr, Ogden, UT 84403
MLS# 2135151Listed by: BRICK REALTY CO, LLC $384,900Active3 beds 3 baths1,635 sq. ft.
355 N Liberty Cove Dr, Harrisville, UT 84404
MLS# 2129037Listed by: CASTLECREEK REAL ESTATE $319,900Active2 beds 2 baths1,556 sq. ft.
542 29th St, Ogden, UT 84403
MLS# 2135088Listed by: RE/MAX COMMUNITY- VALLEY $335,000Active3 beds 3 baths2,328 sq. ft.
4079 S 895 E #67, Ogden, UT 84403
MLS# 2135094Listed by: JPAR SILVERPATH $370,000Active3 beds 1 baths1,131 sq. ft.
3287 Van Buren Ave, Ogden, UT 84403
MLS# 2135062Listed by: ASCENT REAL ESTATE GROUP LLC $399,000Active3 beds 2 baths1,311 sq. ft.
2916 S Brinker Ave E, Ogden, UT 84403
MLS# 2134916Listed by: EQUITY REAL ESTATE (SOUTH VALLEY) $1,500,000Active0.92 Acres
705 23rd St, Ogden, UT 84401
MLS# 2134860Listed by: INVESTMENT REALTY ADVISORS LLC $600,000Active6 beds 3 baths3,434 sq. ft.
3120 Tyler Ave, Ogden, UT 84403
MLS# 2137826Listed by: ICONIC: REALTY NETWORK, LLP $649,900Active3 beds 3 baths3,442 sq. ft.
1788 E Seven Oaks Lane Ln, Ogden, UT 84403
MLS# 2134835Listed by: RIDGELINE REALTY $323,000Active4 beds 1 baths1,904 sq. ft.
895 Sullivan Rd, Ogden, UT 84403
MLS# 2134799Listed by: EQUITY REAL ESTATE (SELECT) $55,000Active3 beds 2 baths948 sq. ft.
1450 N Washington Blvd #110, Ogden, UT 84404
MLS# 2134649Listed by: UTAH REAL ESTATE PC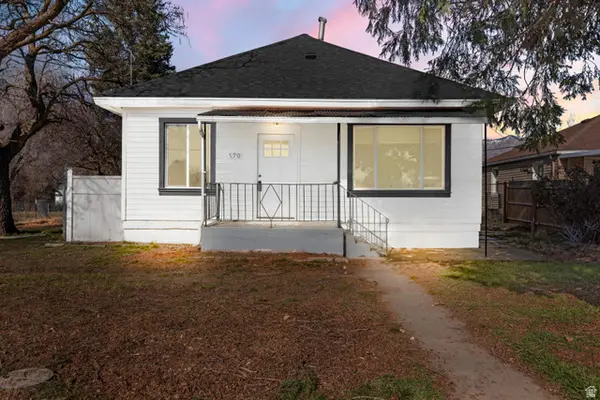 $329,000Pending3 beds 1 baths1,764 sq. ft.
570 2nd St, Ogden, UT 84404
MLS# 2134574Listed by: REALTYPATH LLC (EXECUTIVES)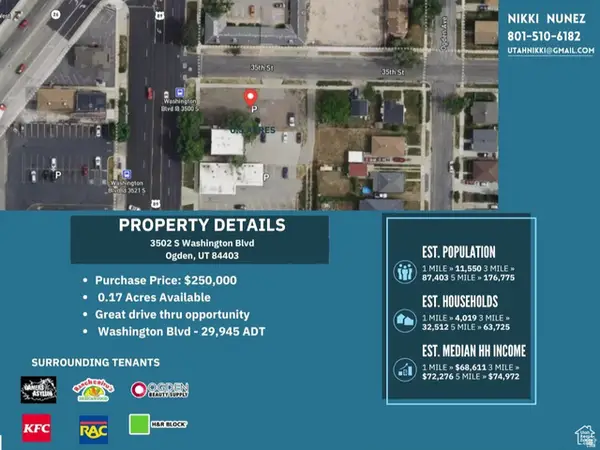 $99,000Active0.17 Acres
3502 S Washington Blvd, Ogden, UT 84403
MLS# 2134313Listed by: BERKSHIRE HATHAWAY HOMESERVICES UTAH PROPERTIES (SALT LAKE)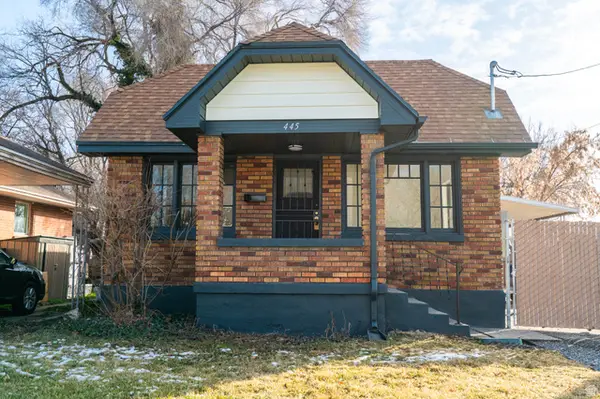 $349,900Pending4 beds 1 baths1,748 sq. ft.
445 E 17th St, Ogden, UT 84404
MLS# 2134263Listed by: EQUITY REAL ESTATE (SELECT)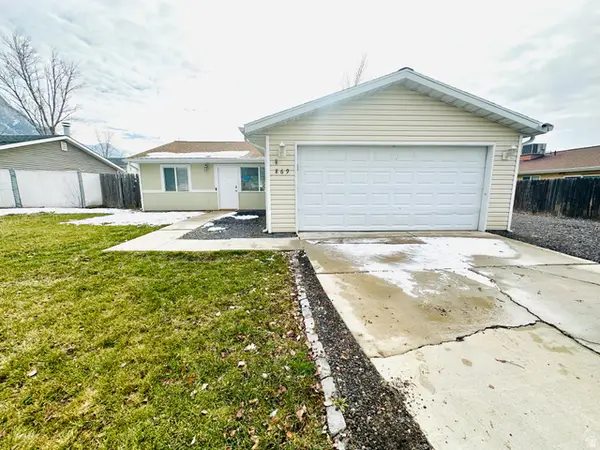 $430,000Active3 beds 2 baths1,134 sq. ft.
869 E 1325 N, Ogden, UT 84404
MLS# 2134144Listed by: X FACTOR REAL ESTATE, LLC $414,990Active4 beds 3 baths1,869 sq. ft.
433 E 1415 St S #116, Ogden, UT 84404
MLS# 2134041Listed by: D.R. HORTON, INC $369,990Pending4 beds 3 baths1,857 sq. ft.
455 14th St #109, Ogden, UT 84404
MLS# 2134055Listed by: D.R. HORTON, INC $299,900Pending2 beds 1 baths1,325 sq. ft.
2844 Eccles Ave, Ogden, UT 84403
MLS# 2134140Listed by: EQUITY REAL ESTATE (SOLID) $410,000Active3 beds 4 baths1,988 sq. ft.
1281 16th St, Ogden, UT 84404
MLS# 2134018Listed by: SUMMIT SOTHEBY'S INTERNATIONAL REALTY $300,000Pending2 beds 1 baths889 sq. ft.
4689 S 275 W, Ogden, UT 84405
MLS# 2133970Listed by: RE/MAX ASSOCIATES $2,399,900Active20 beds 16 baths5,320 sq. ft.
1165 Edgewood Dr, Ogden, UT 84403
MLS# 2133935Listed by: KW UTAH REALTORS KELLER WILLIAMS $478,000Active4 beds 2 baths2,760 sq. ft.
114 Doxey St, Ogden, UT 84401
MLS# 2133937Listed by: UTAH'S WISE CHOICE REAL ESTATE $845,000Active5 beds 3 baths4,166 sq. ft.
5538 S Elderberry Ct, Ogden, UT 84403
MLS# 2133809Listed by: COLDWELL BANKER REALTY (DAVIS COUNTY) $560,000Active5 beds 3 baths3,008 sq. ft.
4102 Edgehill Dr, Ogden, UT 84403
MLS# 2133841Listed by: RE/MAX PEAKS- Open Sat, 11am to 1pm
 $540,000Active4 beds 2 baths2,194 sq. ft.
2890 S Wheelock Ave, Ogden, UT 84403
MLS# 2133795Listed by: HOMEWORKS PROPERTY LAB, LLC  $325,000Active3 beds 2 baths1,152 sq. ft.
756 3rd St, Ogden, UT 84404
MLS# 2133434Listed by: GOLDEN SPIKE REALTY $600,000Active7 beds 3 baths4,550 sq. ft.
527 24 St, Ogden, UT 84401
MLS# 2133322Listed by: UTAH REAL ESTATE PC $835,000Active6 beds 4 baths4,806 sq. ft.
4499 Fillmore Ave, Ogden, UT 84403
MLS# 2133346Listed by: HG MANOR REAL ESTATE (RESIDENTIAL) $239,999Pending2 beds 1 baths960 sq. ft.
1305 Monroe Blvd #2, Ogden, UT 84404
MLS# 2133297Listed by: REAL BROKER, LLC $414,900Pending5 beds 3 baths2,378 sq. ft.
612 35th St, Ogden, UT 84403
MLS# 2133280Listed by: HIVE PROPERTY SOLUTIONS $539,000Active4 beds 2 baths1,816 sq. ft.
1470 E 32nd S, Ogden, UT 84403
MLS# 2133264Listed by: COLDWELL BANKER REALTY (SOUTH OGDEN) $399,000Pending5 beds 3 baths2,735 sq. ft.
621 E 7th St N, Ogden, UT 84404
MLS# 2133272Listed by: RE/MAX ASSOCIATES $514,900Pending6 beds 3 baths3,070 sq. ft.
1004 E 36th St S, Ogden, UT 84403
MLS# 2129235Listed by: EQUITY REAL ESTATE $549,900Pending5 beds 2 baths2,356 sq. ft.
1528 E Sunview Dr S, Ogden, UT 84404
MLS# 2133192Listed by: BRICK REALTY CO, LLC $849,000Active2 beds 2 baths4,619 sq. ft.
1295 Sunset Ct, Ogden, UT 84403
MLS# 2123366Listed by: ERA BROKERS CONSOLIDATED (OGDEN) $357,000Active3 beds 2 baths1,530 sq. ft.
2654 Iowa Ave, Ogden, UT 84401
MLS# 2133152Listed by: EQUITY REAL ESTATE (SELECT) $35,000Active2 beds 2 baths1,000 sq. ft.
1013 N 450 St E #60, Ogden, UT 84404
MLS# 2133112Listed by: H REAL ESTATE SERVICES $420,000Pending3 beds 2 baths2,184 sq. ft.
494 N Eccles Ave, Ogden, UT 84404
MLS# 2133086Listed by: MOUNTAIN LUXURY REAL ESTATE $515,000Pending4 beds 3 baths2,236 sq. ft.
1079 E 4525 S, Ogden, UT 84403
MLS# 2132978Listed by: REAL BROKER, LLC $378,900Pending2 beds 1 baths920 sq. ft.
1434 N Liberty Ave, Ogden, UT 84404
MLS# 2132968Listed by: RE/MAX COMMUNITY- VALLEY $565,000Pending6 beds 2 baths3,704 sq. ft.
3248 S Van Buren Ave. E, Ogden, UT 84403
MLS# 2132882Listed by: HORIZON REALTY L.L.C. $325,000Active3 beds 2 baths1,152 sq. ft.
758 3rd St, Ogden, UT 84404
MLS# 2132911Listed by: GOLDEN SPIKE REALTY $399,899Active5 beds 3 baths1,560 sq. ft.
820 S Wildflower Cir, Ogden, UT 84404
MLS# 2132836Listed by: WU ENTER REAL ESTATE, PLLC $540,000Active6 beds 4 baths2,576 sq. ft.
143 N Pingree Ave, Ogden, UT 84404
MLS# 2132592Listed by: BERKSHIRE HATHAWAY HOMESERVICES UTAH PROPERTIES (SO OGDEN) $290,000Pending3 beds 1 baths1,674 sq. ft.
706 S Polk E, Ogden, UT 84404
MLS# 2132629Listed by: GORDON REAL ESTATE GROUP LLC. $615,000Pending3 beds 3 baths2,398 sq. ft.
3091 N 3075 W, Plain City, UT 84404
MLS# 2132556Listed by: KW SUCCESS KELLER WILLIAMS REALTY (NORTH OGDEN) $900,000Pending4 beds 3 baths5,020 sq. ft.
1921 Mohawk Ln, Ogden, UT 84403
MLS# 2132509Listed by: EXP REALTY, LLC $399,000Pending4 beds 2 baths1,732 sq. ft.
2222 Polk Ave, Ogden, UT 84401
MLS# 2132390Listed by: NEW PLACE REALTY, INC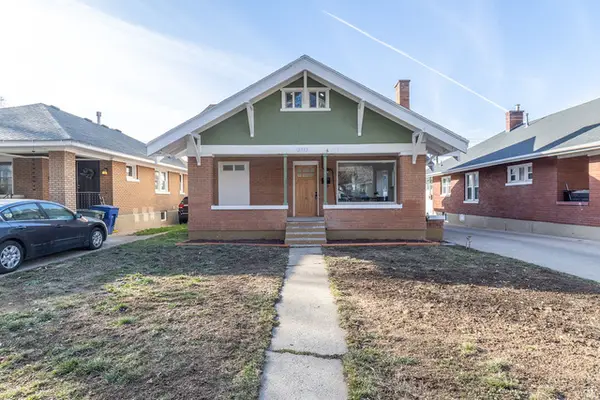 $509,900Active6 beds 3 baths2,377 sq. ft.
2541 Brinker Ave, Ogden, UT 84401
MLS# 2132455Listed by: EQUITY REAL ESTATE (BEAR RIVER) $430,000Pending5 beds 2 baths1,576 sq. ft.
1369 N Lewis Peak Dr, Ogden, UT 84404
MLS# 2132313Listed by: RE/MAX ASSOCIATES $315,000Pending4 beds 3 baths2,090 sq. ft.
3951 S 875 E #25, Ogden, UT 84403
MLS# 2132269Listed by: MOUNTAINLAND REALTY, INC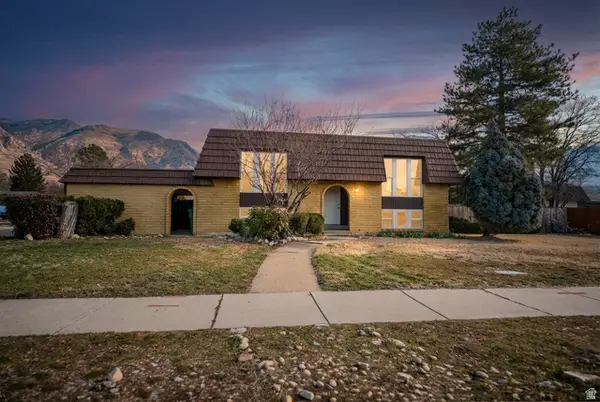 $484,999Active4 beds 2 baths2,118 sq. ft.
1534 S Tyler Ave E, Ogden, UT 84404
MLS# 2132247Listed by: JORDAN REAL ESTATE LLC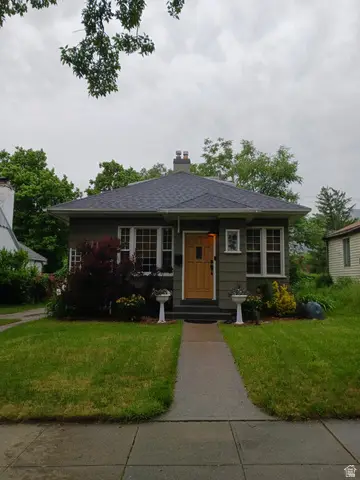 $415,000Active3 beds 1 baths1,535 sq. ft.
1380 24th St, Ogden, UT 84401
MLS# 2132192Listed by: KW PARK CITY KELLER WILLIAMS REAL ESTATE (HEBER VALLEY BRANCH)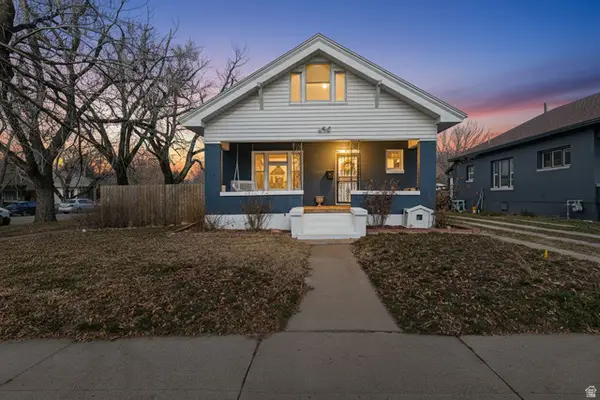 $420,000Active3 beds 2 baths2,060 sq. ft.
902 27th St, Ogden, UT 84403
MLS# 2132173Listed by: WINDERMERE REAL ESTATE (LAYTON BRANCH) $299,000Pending3 beds 1 baths1,020 sq. ft.
656 E 1050 N, Ogden, UT 84404
MLS# 2132153Listed by: RE/MAX ASSOCIATES $150,000Active2 beds 1 baths640 sq. ft.
202 S Douglas St, Ogden, UT 84404
MLS# 2131958Listed by: FATHOM REALTY (OREM) $404,990Pending4 beds 3 baths1,857 sq. ft.
443 E 1415 S #118, Ogden, UT 84404
MLS# 2131862Listed by: D.R. HORTON, INC $319,900Active3 beds 1 baths840 sq. ft.
344 E 13th St S, Ogden, UT 84404
MLS# 2131873Listed by: EQUITY REAL ESTATE (SOLID) $398,000Pending3 beds 2 baths1,131 sq. ft.
584 Eccles Ave, Ogden, UT 84404
MLS# 2131778Listed by: EQUITY REAL ESTATE $479,900Active4 beds 3 baths2,226 sq. ft.
157 N Keogh Ln W, Ogden, UT 84404
MLS# 2131602Listed by: SIMPLE CHOICE REAL ESTATE $435,000Active4 beds 2 baths2,400 sq. ft.
322 Harrison Blvd, Ogden, UT 84404
MLS# 2131588Listed by: SKY REALTY $121,900Active3 beds 2 baths1,650 sq. ft.
1450 N Washington Blvd #151, Ogden, UT 84404
MLS# 2131455Listed by: REAL BROKER, LLC $359,000Active4 beds 2 baths1,572 sq. ft.
247 S Franklin, Ogden, UT 84401
MLS# 2131382Listed by: REALTYPATH LLC (SUMMIT) $339,900Pending3 beds 3 baths1,614 sq. ft.
325 E 750 S #14, Ogden, UT 84401
MLS# 2131285Listed by: EXCEL REALTY INC. $317,500Active3 beds 1 baths1,020 sq. ft.
976 N Jefferson, Ogden, UT 84404
MLS# 2131289Listed by: REAL BROKER, LLC $280,000Pending2 beds 1 baths1,375 sq. ft.
880 E 21st St, Ogden, UT 84401
MLS# 2131294Listed by: EXP REALTY, LLC $335,000Pending3 beds 1 baths1,356 sq. ft.
872 N Monroe Blvd, Ogden, UT 84404
MLS# 2131347Listed by: KW SUCCESS KELLER WILLIAMS REALTY $834,900Active5 beds 4 baths5,224 sq. ft.
1723 Ross Dr, Ogden, UT 84403
MLS# 2131250Listed by: JWH REAL ESTATE $280,000Pending3 beds 1 baths1,292 sq. ft.
477 N Doxey, Ogden, UT 84403
MLS# 2131251Listed by: REAL BROKER, LLC $550,000Active4 beds 3 baths2,084 sq. ft.
3213 S 2400 W, West Haven, UT 84401
MLS# 2131133Listed by: UTAH EXECUTIVE REAL ESTATE LC $460,000Active4 beds 2 baths1,694 sq. ft.
1466 N Lewis Peak Dr, Ogden, UT 84404
MLS# 2131153Listed by: REALTY ONE GROUP SIGNATURE (SOUTH DAVIS) $359,900Pending3 beds 1 baths1,066 sq. ft.
2160 S Fillmore Ave E, Ogden, UT 84401
MLS# 2131032Listed by: BRICK REALTY CO, LLC $379,900Active2 beds 3 baths1,392 sq. ft.
1956 S Grant Ave E, Ogden, UT 84401
MLS# 2131077Listed by: RE/MAX ASSOCIATES $325,000Active3 beds 3 baths2,140 sq. ft.
876 E 1025 S #49, Ogden, UT 84404
MLS# 2131102Listed by: BESST REALTY GROUP LLC (BRIGHAM CITY) $239,900Active2 beds 1 baths820 sq. ft.
3878 S Grandview E, Ogden, UT 84403
MLS# 2131106Listed by: EQUITY REAL ESTATE (SOLID) $460,000Pending4 beds 3 baths2,214 sq. ft.
142 S Eccles Ave, Ogden, UT 84404
MLS# 2131122Listed by: GOLDEN SPIKE REALTY $505,000Active5 beds 3 baths2,747 sq. ft.
1103 E Oak St, Ogden, UT 84401
MLS# 2130942Listed by: REAL BROKER, LLC $399,500Active4 beds 2 baths2,640 sq. ft.
902 24th St, Ogden, UT 84401
MLS# 2130992Listed by: BLACK SIGN REAL ESTATE LLC $760,000Pending5 beds 3 baths3,883 sq. ft.
2714 N 3200 W, Plain City, UT 84404
MLS# 2130889Listed by: BERKSHIRE HATHAWAY HOMESERVICES UTAH PROPERTIES (SO OGDEN) $315,000Active4 beds 1 baths1,123 sq. ft.
259 E 30 St, Ogden, UT 84401
MLS# 2130894Listed by: KW SUCCESS KELLER WILLIAMS REALTY $426,900Active4 beds 2 baths2,002 sq. ft.
1116 S Liberty Ave, Ogden, UT 84404
MLS# 2130896Listed by: MOUNTAINLAND REALTY, INC $33,985Active2 beds 2 baths980 sq. ft.
900 Century Dr #130, Ogden, UT 84404
MLS# 2130869Listed by: EQUITY REAL ESTATE (SELECT) $384,900Active3 beds 3 baths1,635 sq. ft.
370 N Liberty Cove Dr #5, Ogden, UT 84404
MLS# 2119612Listed by: CASTLECREEK REAL ESTATE $514,870Active3 beds 3 baths2,048 sq. ft.
3747 W 1760 St S #110, West Haven, UT 84401
MLS# 2130841Listed by: MCARTHUR REALTY, LC $350,000Active1 beds 1 baths765 sq. ft.
195 E 25th S #5, Ogden, UT 84401
MLS# 2130209Listed by: BRICK REALTY CO, LLC $349,000Active4 beds 3 baths1,778 sq. ft.
122 Doxey St, Ogden, UT 84401
MLS# 2130157Listed by: CENTURY 21 EVEREST (CENTERVILLE) $387,990Pending4 beds 3 baths1,857 sq. ft.
439 E 1415 S #117, Ogden, UT 84404
MLS# 2130148Listed by: D.R. HORTON, INC $299,900Pending2 beds 2 baths1,317 sq. ft.
872 E 760 N, Ogden, UT 84404
MLS# 2130122Listed by: BOX REALTY, LLC $349,900Active3 beds 2 baths2,380 sq. ft.
3040 Harrison Blvd, Ogden, UT 84403
MLS# 2130099Listed by: EQUITY REAL ESTATE (SELECT) $349,900Pending4 beds 2 baths1,456 sq. ft.
891 Sunflower Dr, Ogden, UT 84404
MLS# 2130046Listed by: ICONIC: REALTY NETWORK, LLP $399,000Pending3 beds 2 baths1,331 sq. ft.
1491 N Fowler Ave, Ogden, UT 84404
MLS# 2130020Listed by: TRILLIONAIRE REALTY $499,900Active3 beds 2 baths2,312 sq. ft.
197 2nd St W, Ogden, UT 84404
MLS# 2129917Listed by: UTAH PRESTIGE REAL ESTATE, LLC $419,900Active4 beds 2 baths2,018 sq. ft.
2843 S Brinker, Ogden, UT 84403
MLS# 2129795Listed by: FROERER REAL ESTATE AND PROPERTY MANAGEMENT LLC $219,500Pending2 beds 1 baths1,302 sq. ft.
3237 Jefferson Ave, Ogden, UT 84403
MLS# 2129791Listed by: EQUITY REAL ESTATE (SELECT) $274,900Active2 beds 2 baths1,045 sq. ft.
130 7th #c304 St, Ogden, UT 84404
MLS# 2129741Listed by: ERA BROKERS CONSOLIDATED (OGDEN) $50,000Pending3 beds 2 baths954 sq. ft.
4375 Weber Dr #94, Ogden, UT 84405
MLS# 2129763Listed by: LPT REALTY, LLC $340,000Active3 beds 3 baths1,778 sq. ft.
445 W 950 S, Ogden, UT 84404
MLS# 2129634Listed by: KW SOUTH VALLEY KELLER WILLIAMS $359,900Active3 beds 3 baths1,778 sq. ft.
447 W 950 S, Ogden, UT 84404
MLS# 2129635Listed by: KW SOUTH VALLEY KELLER WILLIAMS $329,500Active2 beds 2 baths1,086 sq. ft.
525 3rd St, Ogden, UT 84404
MLS# 2129501Listed by: REAL BROKER, LLC $280,000Active3 beds 1 baths801 sq. ft.
2865 Pingree Ave, Ogden, UT 84401
MLS# 2129458Listed by: OPENDOOR BROKERAGE LLC $509,000Pending3 beds 2 baths2,669 sq. ft.
2577 Polk Ave, Ogden, UT 84401
MLS# 2129306Listed by: SUMMIT SOTHEBY'S INTERNATIONAL REALTY $240,000Pending2 beds 1 baths1,130 sq. ft.
1677 E 1450 S, Ogden, UT 84404
MLS# 2129308Listed by: UTAH EXECUTIVE REAL ESTATE LC $515,000Active3 beds 2 baths2,984 sq. ft.
367 Franklin E, Ogden, UT 84401
MLS# 2129316Listed by: EQUITY REAL ESTATE (SOUTH VALLEY) $325,000Pending3 beds 2 baths1,886 sq. ft.
3538 Adams Ave, Ogden, UT 84403
MLS# 2129329Listed by: KW SUCCESS KELLER WILLIAMS REALTY (LAYTON) $670,000Active7 beds 3 baths2,880 sq. ft.
133 E Binford St S, Ogden, UT 84403
MLS# 2129256Listed by: WINDERMERE REAL ESTATE (LAYTON BRANCH) $369,000Pending3 beds 1 baths1,134 sq. ft.
1104 23rd St, Ogden, UT 84401
MLS# 2129187Listed by: ICONIC: REALTY NETWORK, LLP $359,900Pending3 beds 2 baths1,720 sq. ft.
719 S 350 E #3, Ogden, UT 84401
MLS# 2129093Listed by: EXCEL REALTY INC. $949,000Pending3 beds 2 baths2,586 sq. ft.
4255 W 950 S, West Weber, UT 84401
MLS# 2129064Listed by: SUMMIT SOTHEBY'S INTERNATIONAL REALTY $339,699Active4 beds 2 baths1,562 sq. ft.
2853 S Lincoln Ave, Ogden, UT 84401
MLS# 2129029Listed by: EQUITY REAL ESTATE (RESULTS) $550,000Pending8 beds 4 baths3,008 sq. ft.
755 E Boughton, Ogden, UT 84403
MLS# 2129023Listed by: COLDWELL BANKER REALTY (SOUTH OGDEN) $550,000Pending4 beds 3 baths2,486 sq. ft.
4357 W 3550 S, West Haven, UT 84401
MLS# 2128942Listed by: REAL ESTATE ESSENTIALS $623,000Active4 beds 4 baths3,633 sq. ft.
2537 S Taylor Ave E, Ogden, UT 84401
MLS# 2128810Listed by: EQUITY REAL ESTATE $219,900Active3 beds 1 baths1,134 sq. ft.
870 W Ellis St, Ogden, UT 84401
MLS# 2128764Listed by: 4YOU REAL ESTATE, LLC $895,000Active0.79 Acres
344 E 31st St, Ogden, UT 84401
MLS# 2128745Listed by: ERA BROKERS CONSOLIDATED (OGDEN) $345,000Active3 beds 3 baths1,368 sq. ft.
1119 Healy St, Ogden, UT 84403
MLS# 2128728Listed by: COLDWELL BANKER REALTY (DAVIS COUNTY) $379,990Pending3 beds 3 baths1,586 sq. ft.
324 E 1275 N #118, Harrisville, UT 84404
MLS# 2128702Listed by: D.R. HORTON, INC $444,990Pending4 beds 3 baths2,073 sq. ft.
318 E 1275 N #115, Harrisville, UT 84404
MLS# 2128690Listed by: D.R. HORTON, INC $360,000Pending4 beds 2 baths1,560 sq. ft.
1502 Liberty Ave, Ogden, UT 84404
MLS# 2128648Listed by: JPAR SILVERPATH $369,900Active4 beds 2 baths1,660 sq. ft.
3022 Monroe Blvd, Ogden, UT 84401
MLS# 2128633Listed by: WISER REAL ESTATE, LLC $444,990Pending4 beds 3 baths2,019 sq. ft.
330 E 1275 N #121, Harrisville, UT 84404
MLS# 2128527Listed by: D.R. HORTON, INC $374,990Pending3 beds 3 baths1,586 sq. ft.
328 E 1275 N #120, Harrisville, UT 84404
MLS# 2128531Listed by: D.R. HORTON, INC $390,000Active2 beds 1 baths1,651 sq. ft.
1849 Van Buren Ave, Ogden, UT 84401
MLS# 2128513Listed by: REAL BROKER, LLC $320,000Pending3 beds 1 baths1,250 sq. ft.
1413 S Jefferson, Ogden, UT 84404
MLS# 2128444Listed by: REAL BROKER, LLC $318,000Pending3 beds 2 baths1,484 sq. ft.
652 1225 N, Ogden, UT 84404
MLS# 2128338Listed by: SUN KEY REALTY LLC $284,999Active3 beds 3 baths1,440 sq. ft.
483 E 475 N, Ogden, UT 84404
MLS# 2128319Listed by: KW SUCCESS KELLER WILLIAMS REALTY $457,500Pending4 beds 3 baths1,781 sq. ft.
992 E 1150 N, Ogden, UT 84404
MLS# 2128312Listed by: REAL ESTATE EXCHANGE, INC. $359,000Pending3 beds 1 baths1,054 sq. ft.
752 N Liberty Ave, Ogden, UT 84404
MLS# 2128316Listed by: EQUITY REAL ESTATE (SELECT) $350,000Pending5 beds 2 baths1,862 sq. ft.
526 E 650 N, Ogden, UT 84401
MLS# 2128273Listed by: REAL BROKER, LLC
Local realty services provided by:CENTURY 21 Bushnell
Neighborhoods near Ogden, UT
Zip codes near Ogden, UT
- 84014 homes for sale
- 84015 homes for sale
- 84025 homes for sale
- 84037 homes for sale
- 84040 homes for sale
- 84041 homes for sale
- 84050 homes for sale
- 84067 homes for sale
- 84075 homes for sale
- 84310 homes for sale
- 84315 homes for sale
- 84317 homes for sale
- 84324 homes for sale
- 84328 homes for sale
- 84340 homes for sale
- 84401 homes for sale
- 84403 homes for sale
- 84404 homes for sale
- 84405 homes for sale
- 84414 homes for sale
Popular searches near Ogden, UT
- Clearfield homes for sale
- Clinton homes for sale
- Eden homes for sale
- Farr West homes for sale
- Harrisville homes for sale
- Marriott-Slaterville homes for sale
- North Ogden homes for sale
- Plain City homes for sale
- Pleasant View homes for sale
- Riverdale homes for sale
- Roy homes for sale
- South Ogden homes for sale
- South Weber homes for sale
- Sunset homes for sale
- Taylor homes for sale
- Uintah homes for sale
- Washington Terrace homes for sale
- West Haven homes for sale
- West Point homes for sale
- West Weber homes for sale
Protect your home and budget from life's surprises with an Assurant Home Warranty, backed by a partner that supports you through every step of homeownership. Explore Plans.
©2026 Century 21 Real Estate LLC. All rights reserved. CENTURY 21®, the CENTURY 21 Logo and C21® are service marks owned by Century 21 Real Estate LLC. Century 21 Real Estate LLC fully supports the principles of the Fair Housing Act and the Equal Opportunity Act. Each office is independently owned and operated. Listing information is deemed reliable but not guaranteed accurate.