- Bloomingdale homes for sale
- Butler homes for sale
- Franklin Lakes homes for sale
- Haskell homes for sale
- Kinnelon homes for sale
- Lincoln Park homes for sale
- Macopin homes for sale
- Newfoundland homes for sale
- Oakland homes for sale
- Packanack Lake homes for sale
- Pequannock Township homes for sale
- Pequannock homes for sale
- Pines Lake homes for sale
- Pompton Lakes homes for sale
- Pompton Plains homes for sale
- Preakness homes for sale
- Riverdale homes for sale
- Towaco homes for sale
- Wanaque homes for sale
- Wayne homes for sale
Passaic County, NJ - homes for sale
300 of 2,052 results displayed
- New
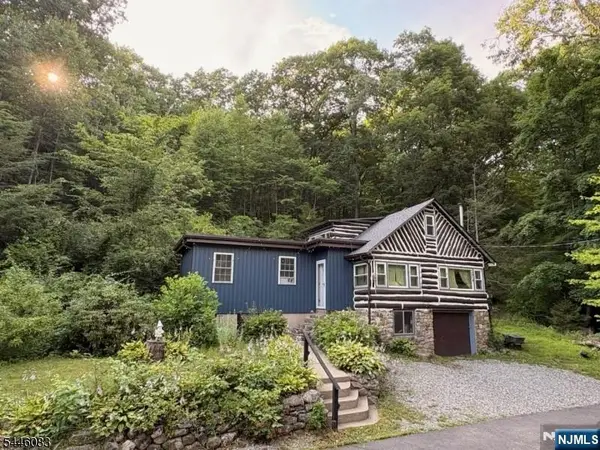 $339,900Active3 beds 1 baths
83 Terra Cotta Road, West Milford, NJ 07421
MLS# 26026142Listed by: WEICHERT REALTORS, WAYNE
- New
 $599,000Active3 beds 2 baths4,400 sq. ft.
27 Kenter Pl, Clifton City, NJ 07012
MLS# 4040116Listed by: REALTY ONE GROUP LEGEND - New
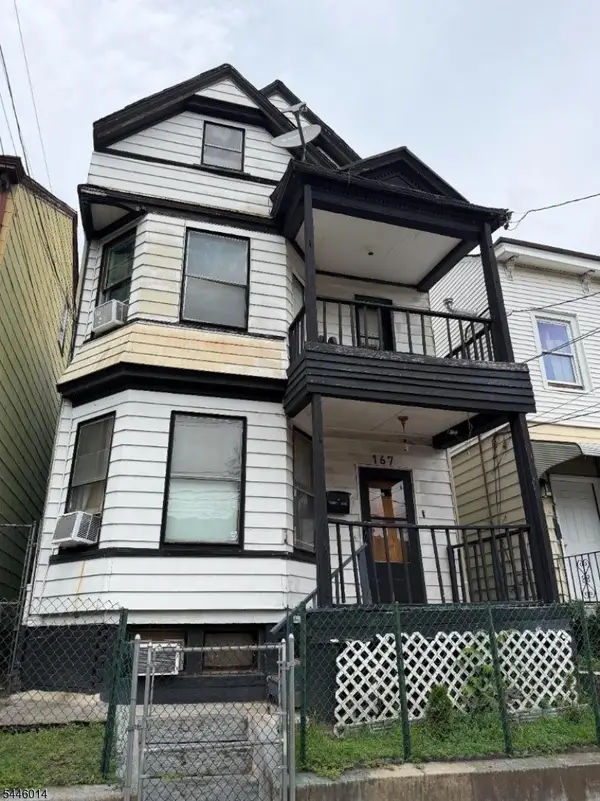
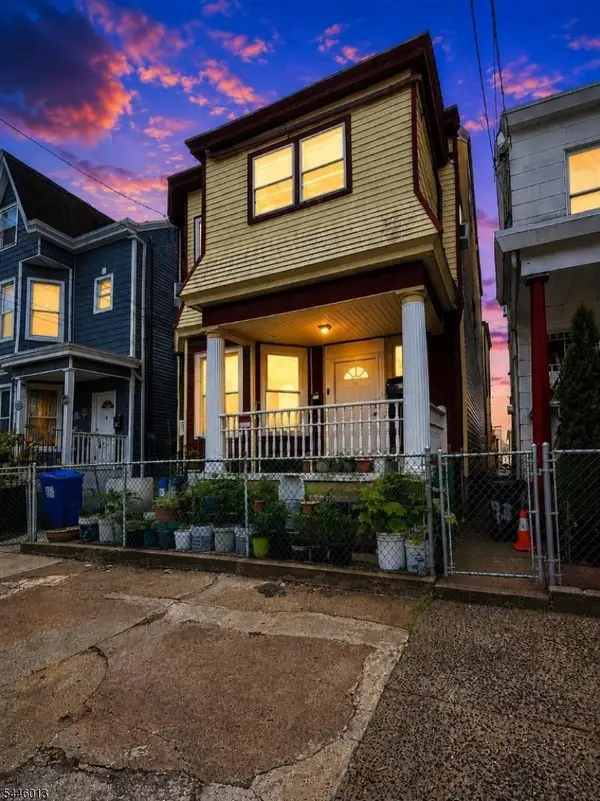 $589,999Active8 beds 4 baths
191 Kearney St, Paterson City, NJ 07522
MLS# 4040110Listed by: REALTY OF AMERICA - New
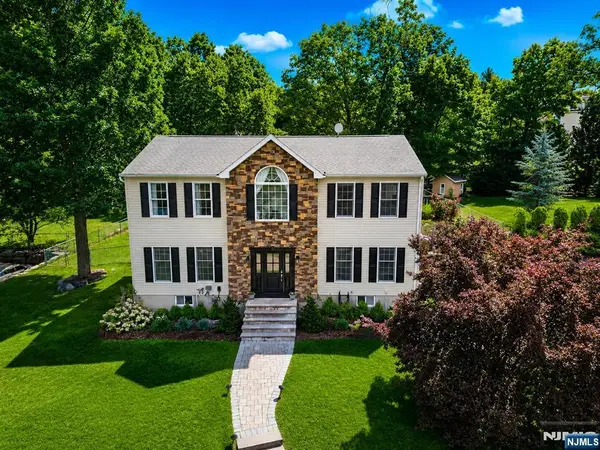 $789,900Active3 beds 3 baths
8 Cross Oak Lane, West Milford, NJ 07480
MLS# 26026098Listed by: COLDWELL BANKER, WAYNE - New
 $544,900Active4 beds 1 baths
166 E 3rd Street, Clifton, NJ 07011
MLS# 26025699Listed by: KELLER WILLIAMS PARK VIEWS - New
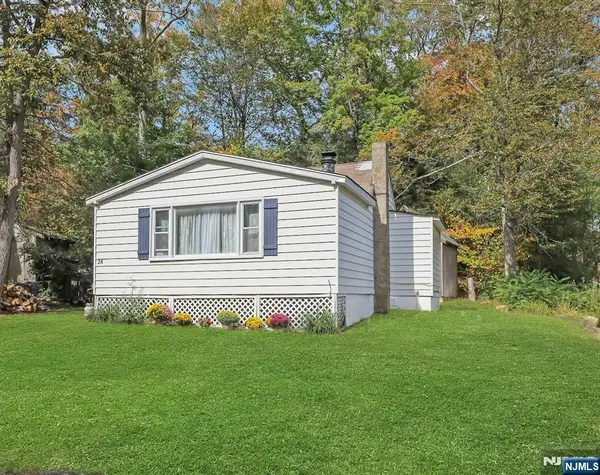
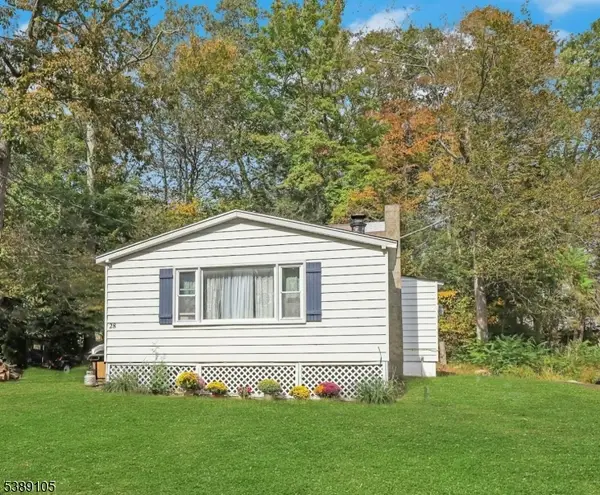 $299,000Active2 beds 1 baths
28 Risley Rd, West Milford Twp., NJ 07421
MLS# 4040070Listed by: COLDWELL BANKER REALTY - New
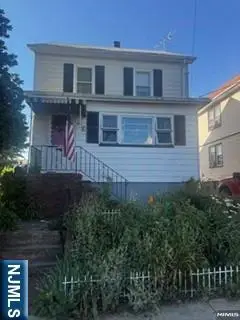
 $499,900Active7 beds 3 baths
167 Pearl St #2, Paterson City, NJ 07501
MLS# 4040071Listed by: CASA REAL PROPERTY GROUP LLC - New
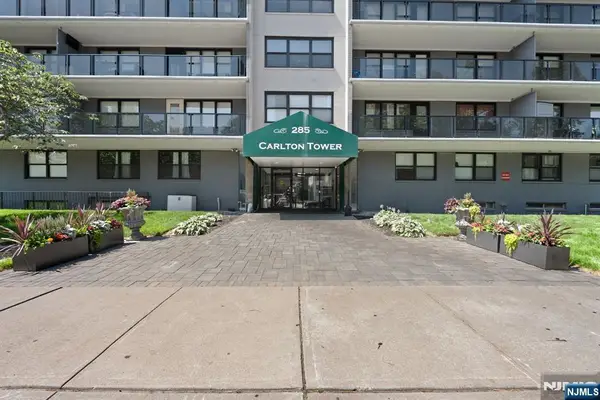 $160,000Active-- beds 1 baths
285 Aycrigg Avenue 15C, Passaic, NJ 07055
MLS# 26025954Listed by: SIGNATURE REALTY NJ LLC - New
 $650,000Active-- beds 2 baths
39 Struyk Avenue, Haledon, NJ 07508
MLS# 26026027Listed by: CORCORAN SAWYER SMITH - New
 $675,000Active-- beds 3 baths
22 Norwood Street, Haledon, NJ 07508
MLS# 26026052Listed by: REALTY ONE GROUP LEGEND - New
 $499,000Active4 beds 2 baths
31 Zeliff Avenue, Little Falls, NJ 07424
MLS# 26025539Listed by: THE AGENCY ONE ROCK-PARAMUS - New
 $795,000Active3 beds 2 baths
16 Adrian St, Pompton Lakes Boro, NJ 07442
MLS# 4040005Listed by: KELLER WILLIAMS PARK VIEWS - New
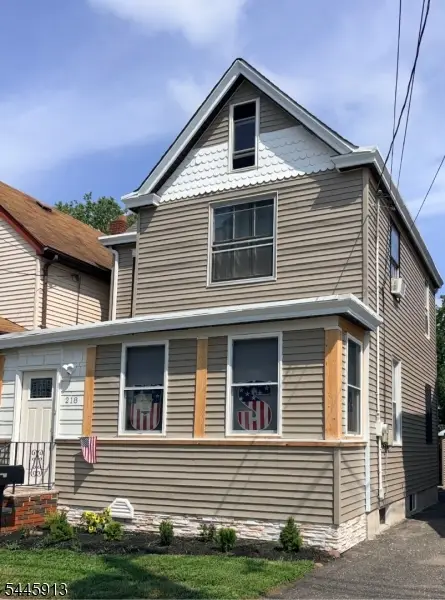 $499,000Active3 beds 2 baths
218 W 2nd St, Clifton City, NJ 07011
MLS# 4040027Listed by: NICHOLAS REAL ESTATE AGENCY - New
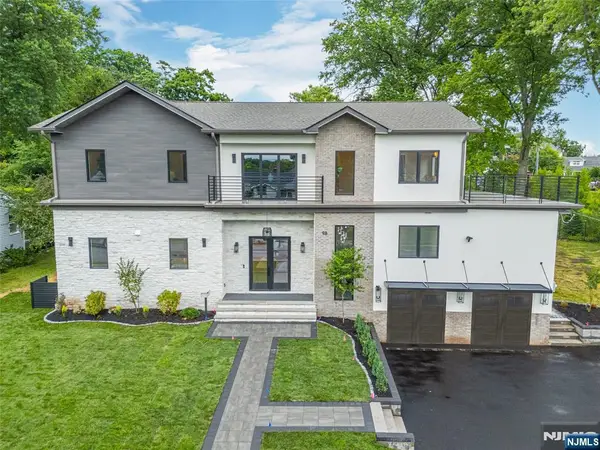 $2,600,000Active6 beds 5 baths
98 Haddenfield Road, Clifton, NJ 07013
MLS# 26025263Listed by: REAL - New
 $629,900Active4 beds 3 baths
141 Kearney Street, Paterson, NJ 07522
MLS# 26026042Listed by: EXP REALTY, LLC - New
 $599,000Active5 beds 2 baths
52 Lakeview Ave, Paterson City, NJ 07503
MLS# 4039947Listed by: NICHOLAS REAL ESTATE AGENCY - New
 $714,900Active4 beds 4 baths2,432 sq. ft.
6 East St, Wanaque Boro, NJ 07465
MLS# 4039991Listed by: BHGRE GREEN TEAM - New
 $650,000Active4 beds 2 baths
39 STRUYK AVE, Prospect Park, NJ 07508
MLS# 260013554Listed by: CORCORAN SAWYER SMITH - New
 $550,000Active2 beds 1 baths
44 Rumana Road, Wayne, NJ 07470
MLS# 26026012Listed by: HOWARD HANNA RAND REALTY - New
 $795,000Active3 beds 4 baths
1 Lewis Street, Haledon, NJ 07508
MLS# 26025839Listed by: RE/MAX 1ST ADVANTAGE - New
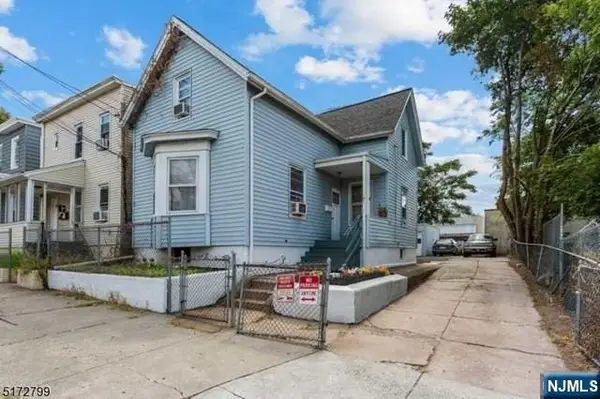
 $570,000Active3 beds 2 baths
163 Hamilton Ave, Clifton City, NJ 07011
MLS# 4039933Listed by: NICHOLAS REAL ESTATE AGENCY - New
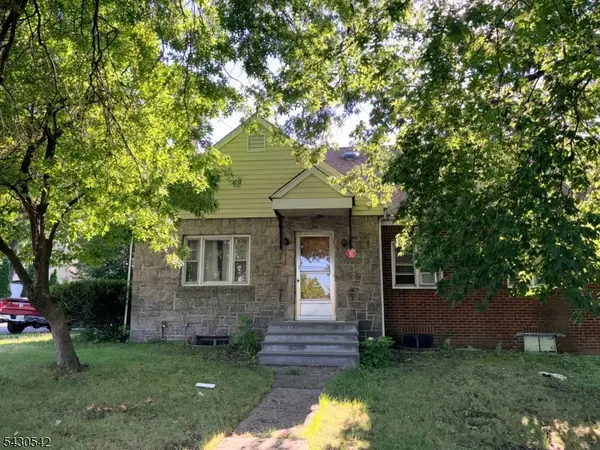
 $649,000Active8 beds 5 baths
242 ROSA PARKS BLVD, Paterson, NJ 07501
MLS# 260013522Listed by: ACCESS HOMES REALTY  $550,000Pending4 beds 3 baths
1 Foster Street, Clifton, NJ 07011
MLS# 26025956Listed by: LIM BANCES REALTY- New
 $325,000Active2 beds 2 baths
28 Iron Forge Sq #28, Pompton Lakes Boro, NJ 07442
MLS# 4039894Listed by: KELLER WILLIAMS PROSPERITY REALTY - New
 $775,000Active-- beds 2 baths
149 Speer Avenue, Clifton, NJ 07013
MLS# 26024438Listed by: CENTURY 21 VENTURE REAL ESTATE - New
 $875,000Active-- beds 3 baths
673 25th Street, Paterson, NJ 07504
MLS# 26024455Listed by: KELLER WILLIAMS PROSPERITY REALTY - New
 $499,000Active3 beds 4 baths
107 Rock Ledge Terrace 1, Haledon, NJ 07508
MLS# 26024955Listed by: KELLER WILLIAMS SUBURBAN REALTY - New
 $357,000Active1 beds 1 baths
43 Manchester, Wayne, NJ 07470
MLS# 26025812Listed by: REALTY EXECUTIVES EXCEPTIONAL REALTORS-WAYNE - New
 $529,999Active-- beds 3 baths
1 Park Place, Paterson, NJ 07524
MLS# 26025846Listed by: PRESTIGE PROPERTY GROUP - MONTCLAIR - New
 $6,495,000Active-- beds -- baths
60-62 Plum Street, Paterson, NJ 07503
MLS# 26025863Listed by: KELLER WILLIAMS TEAM REALTY - New
 $325,000Active2 beds 2 baths
114 Federal Hill Road, Pompton Lakes, NJ 07442
MLS# 26025873Listed by: PROMINENT PROPERTIES SOTHEBY'S INTERNATIONAL REALTY-RIDGEWOOD - New
 $577,777Active-- beds 3 baths
305 Pacific Street, Paterson, NJ 07503
MLS# 26025876Listed by: EXP REALTY, LLC - New
 $799,900Active-- beds 2 baths
302 Sherman Street, Passaic, NJ 07055
MLS# 26025880Listed by: REALTY ONE GROUP LEGEND, CLIFTON - New
 $399,999Active-- beds 2 baths
609 30th Street, Paterson, NJ 07513
MLS# 26025911Listed by: RE/MAX SELECT - FRANKLIN LAKES - New
 $549,900Active3 beds 1 baths
5 Doherty Dr East, Clifton City, NJ 07013
MLS# 4039828Listed by: CENTURY 21 THE CROSSING - New
 $99,999Active3 beds 1 baths
11 Setting Sun Trail, West Milford, NJ 07480
MLS# 26025914Listed by: REALMART REALTY, LLC - New
 $550,000Active3 beds 2 baths
11 Woodward Avenue, Bloomingdale, NJ 07403
MLS# 26021733Listed by: THE AGENCY ONE ROCK-HOHOKUS-RIDGEWOOD EAST - New
 $299,000Active2 beds 1 baths
28 Risley Road, West Milford, NJ 07421
MLS# 26025509Listed by: COLDWELL BANKER, UPPER MONTCLAIR - New
 $579,000Active3 beds 2 baths
41 Martin Avenue, Clifton, NJ 07012
MLS# 26022984Listed by: RE/MAX PROPERTIES PLUS - New
 $719,999Active4 beds 3 baths
334 Brook Avenue, Passaic, NJ 07055
MLS# 26025875Listed by: REAL - New
 $529,900Active4 beds 2 baths
62-64 Front Street, Paterson, NJ 07522
MLS# 26025878Listed by: KELLER WILLIAMS CITY VIEWS REALTY - New
 $529,900Active4 beds 2 baths
62 Front St, Paterson City, NJ 07522
MLS# 4039724Listed by: KELLER WILLIAMS CITY VIEWS REALTY - New
 $357,000Active1 beds 1 baths
43 Manchester Ct, Wayne Twp., NJ 07470
MLS# 4039725Listed by: REALTY EXECUTIVES EXCEPTIONAL - New
 $650,000Active4 beds 2 baths
56 Village Drive, Wayne, NJ 07470
MLS# 26023868Listed by: COLDWELL BANKER, WAYNE - New
 $600,000Active3 beds 2 baths
14 Hinchman Avenue, Wayne, NJ 07470
MLS# 26025845Listed by: HOWARD HANNA RAND REALTY - New
 $449,998Active3 beds 2 baths
45 Dey St, Paterson City, NJ 07503
MLS# 4039605Listed by: KELLER WILLIAMS PARK VIEWS - New
 $200,000Active2 beds 1 baths
60 Terra Cotta Rd, West Milford Twp., NJ 07480
MLS# 4039638Listed by: RE/MAX COUNTRY REALTY - New
 $668,500Active4 beds 3 baths
12 Wolfe Dr, Wanaque Boro, NJ 07465
MLS# 4039693Listed by: COLDWELL BANKER REALTY - New
 $399,000Active2 beds -- baths
81 Highview Avenue, Totowa, NJ 07512
MLS# 26025815Listed by: KELLER WILLIAMS TEAM REALTY - New
 $698,000Active4 beds 2 baths
59 Oakwood Drive, Wayne, NJ 07470
MLS# 26025826Listed by: COLDWELL BANKER, WAYNE - New
 $990,000Active5 beds 5 baths
16 Shephard Road, West Milford, NJ 07421
MLS# 26023266Listed by: KELLER WILLIAMS VALLEY REALTY - New
 $169,000Active2 beds 2 baths
3rd st 15, Wayne, NJ 07420
MLS# 26025744Listed by: WEICHERT REALTORS, KINNELON - New
 $850,000Active3 beds 2 baths
106 Demarest Road, Bloomingdale, NJ 07403
MLS# 26025756Listed by: COLDWELL BANKER, SPARTA - New
 $774,999Active4 beds 2 baths
319 Winifred Drive, Totowa, NJ 07512
MLS# 26025772Listed by: CENTURY 21 GEMINI REALTY, LLC - New
 $929,000Active4 beds 4 baths
31 Osceola Road, Wayne, NJ 07470
MLS# 26025799Listed by: COMPASS NEW JERSEY, LLC-RIDGEWOOD - New
 $549,999Active2 beds 3 baths
101 Rock Creek Dr, Clifton City, NJ 07001
MLS# 4039519Listed by: HOWARD HANNA RAND REALTY - New
 $539,900Active3 beds 3 baths
73 Bergen Ave, Clifton City, NJ 07011
MLS# 4039541Listed by: UNITED REAL ESTATE - New
 $365,000Active2 beds 2 baths
37 Amethyst Lane 251, Paterson, NJ 07501
MLS# 26022490Listed by: CENTURY 21 GOLD PROPERTIES REALTY, INC - New
 $695,000Active4 beds 3 baths
67 Gannet Court, Wayne, NJ 07470
MLS# 26022528Listed by: RUSSO REAL ESTATE - New
 $584,999Active-- beds 3 baths
8-10 N 3rd Street, Paterson, NJ 07522
MLS# 26025102Listed by: KELLER WILLIAMS VILLAGE SQUARE REALTY - New
 $599,000Active-- beds 2 baths
53-55 Henderson Street, Paterson, NJ 07501
MLS# 26025242Listed by: REALTY EMPIRE, LLC - New
 $389,000Active2 beds 2 baths
170 Lafayette Avenue 3H, Passaic, NJ 07055
MLS# 26025531Listed by: HOME SMART REALTY LLC - New
 $365,000Active1 beds 2 baths
9 New Bedford Road G, West Milford, NJ 07480
MLS# 26025561Listed by: WERNER REALTY - New
 $549,999Active2 beds 3 baths
101 Rock Creek Drive T218, Clifton, NJ 07014
MLS# 26025674Listed by: HOWARD HANNA RAND REALTY - New
 $599,900Active4 beds 2 baths
35 Lakeview Rd, Ringwood Boro, NJ 07456
MLS# 4039494Listed by: WEICHERT REALTORS - New
 $699,000Active6 beds 4 baths
183 Graham Ave, Paterson City, NJ 07508
MLS# 4039339Listed by: PREMIER HOMES - New
 $739,000Active3 beds 4 baths2,200 sq. ft.
107 Abbe Rd, Little Falls Twp., NJ 07424
MLS# 4039448Listed by: BHHS FOX & ROACH - New
 $160,000Active-- beds 1 baths
285 Aycrigg Ave, Passaic City, NJ 07055
MLS# 4039424Listed by: SIGNATURE REALTY NJ - New
 $1,275,000Active5 beds 6 baths
72 Heritage Drive, West Milford, NJ 07480
MLS# 26025675Listed by: RE/MAX TRADING PLACES LLC - HASBROUCK HEIGHTS - New
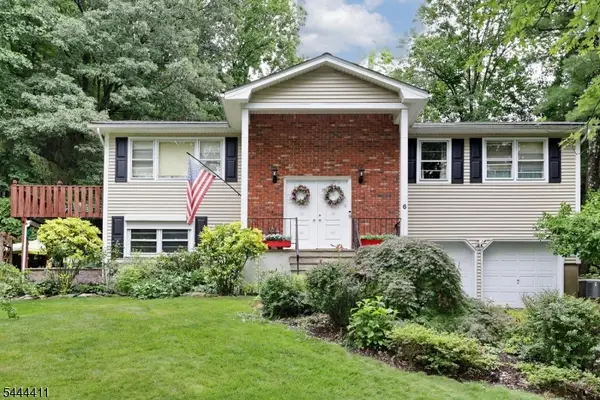 $599,900Active3 beds 3 baths
6 Cooper Dr, Wanaque Boro, NJ 07456
MLS# 4039364Listed by: BHGRE GREEN TEAM - New
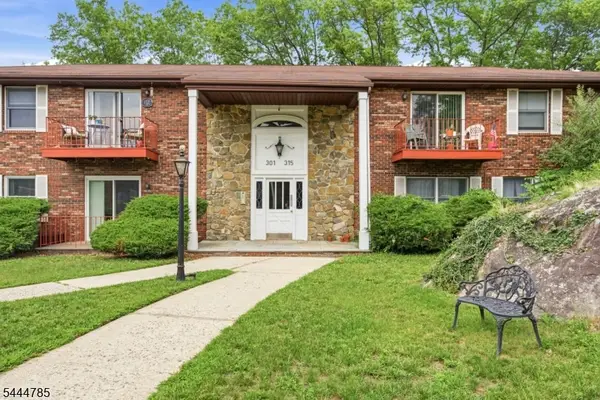 $369,000Active2 beds 2 baths968 sq. ft.
315 Ringwood Ave, Pompton Lakes Boro, NJ 07442
MLS# 4039378Listed by: COLDWELL BANKER REALTY - New
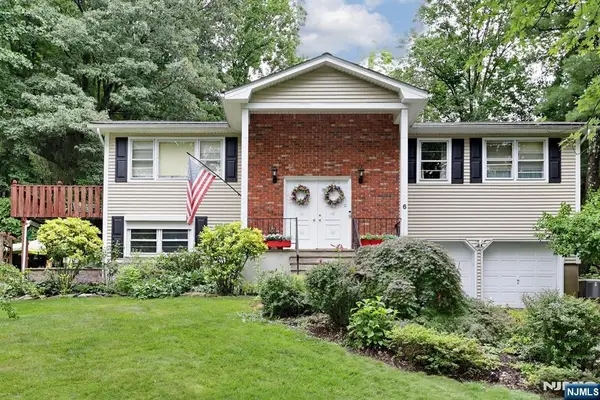 $599,900Active3 beds 3 baths
6 Cooper Drive, Wanaque, NJ 07465
MLS# 26025670Listed by: BETTER HOMES & GARDENS REAL ESTATE GREEN TEAM - New
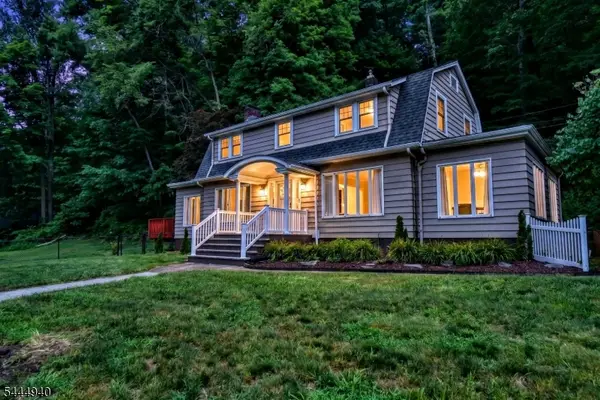 $620,000Active3 beds 2 baths
508 Pat Hamburg Tpke, West Milford Twp., NJ 07480
MLS# 4039338Listed by: TERRIE O'CONNOR REALTORS - New
 $524,900Active3 beds 3 baths
636 Paulison Ave, Clifton City, NJ 07011
MLS# 4039346Listed by: KELLER WILLIAMS CITY VIEWS REALTY - New
 $365,000Active2 beds 2 baths1,100 sq. ft.
37 Amethyst Ln, Paterson City, NJ 07501
MLS# 4039273Listed by: C-21 GOLD PROPERTIES REALTY - New
 $525,000Active3 beds 2 baths
564 Morsetown Rd, West Milford Twp., NJ 07480
MLS# 4039303Listed by: KELLER WILLIAMS INTEGRITY - New
 $592,000Active3 beds 3 baths
296 12th Place, Prospect Park, NJ 07508
MLS# 26024837Listed by: KELLER WILLIAMS REALTY WESTFIELD - New
 $679,900Active3 beds 3 baths
550 Berdan Avenue, Wayne, NJ 07470
MLS# 26025548Listed by: HOWARD HANNA RAND REALTY - New
 $699,000Active4 beds 1 baths
21 Crews Street, Totowa, NJ 07512
MLS# 26025564Listed by: CENTURY 21 GEMINI REALTY, LLC - New
 $505,000Active3 beds 3 baths2,300 sq. ft.
135 Richmond Rd, West Milford Twp., NJ 07480
MLS# 4039192Listed by: RE/MAX COUNTRY REALTY - New
 $1,392,000Active4 beds 3 baths
1050 W Pines Lake Drive, Wayne, NJ 07470
MLS# 26024785Listed by: COLDWELL BANKER, WAYNE - Open Sun, 12 to 2pmNew
 $549,999Active4 beds 3 baths
92 William Place, Totowa, NJ 07512
MLS# 26023161Listed by: ALEXANDER ANDERSON REAL ESTATE GROUP - New
 $885,000Active-- beds 3 baths
301 Burhans Avenue, Haledon, NJ 07508
MLS# 26025182Listed by: TERRIE O'CONNOR REALTORS-WYCKOFF - New
 $580,000Active2 beds 2 baths
7118 Warrens Way, Wanaque, NJ 07465
MLS# 26025322Listed by: RE/MAX SELECT - FRANKLIN LAKES - New
 $410,000Active2 beds 2 baths
51 Beacon Hill Road E, West Milford, NJ 07480
MLS# 26025510Listed by: WEICHERT REALTORS, WAYNE - New
 $389,000Active2 beds 1 baths
36 Furnace Ave, Wanaque Boro, NJ 07465
MLS# 4039147Listed by: COLDWELL BANKER REALTY - New
 $279,000Active2 beds 1 baths986 sq. ft.
7 Cooper Rd, West Milford Twp., NJ 07438
MLS# 4039157Listed by: REALTY EXECUTIVES EXCEPTIONAL - New
 $369,000Active2 beds 2 baths1,768 sq. ft.
8421 Warrens Way #421, Wanaque Boro, NJ 07465
MLS# 4039051Listed by: REALTY EXECUTIVES EXCEPTIONAL - New
 $599,500Active3 beds 2 baths
67 Marlboro Rd, Clifton City, NJ 07012
MLS# 4039069Listed by: COLDWELL BANKER REALTY - New
 $599,000Active3 beds 2 baths
94 Palmer Street, Passaic, NJ 07055
MLS# 26025424Listed by: MODERN REALTY GROUP - Open Sat, 1 to 4pmNew
 $1,190,000Active4 beds 4 baths
68 Carol Place, Wayne, NJ 07470
MLS# 26025372Listed by: KINGSTONE REALTY LLC - New
 $659,999Active4 beds 3 baths
77 1st Ave, Little Falls Twp., NJ 07424
MLS# 4038929Listed by: BHHS VAN DER WENDE PROPERTIES - New
 $580,000Active2 beds 2 baths2,119 sq. ft.
7118 Warrens Way #118, Wanaque Boro, NJ 07465
MLS# 4038944Listed by: RE/MAX SELECT - New
 $815,000Active7 beds 6 baths4,929 sq. ft.
105 Ricker Dr, Ringwood Boro, NJ 07456
MLS# 4038984Listed by: COLDWELL BANKER REALTY - Open Sat, 12:30 to 3pmNew
 $899,999Active6 beds 5 baths
19 Willie St, Haledon Boro, NJ 07508
MLS# 4039021Listed by: COLDWELL BANKER REALTY - New
 $699,000Active3 beds 2 baths
15 Kingwood Drive, Little Falls, NJ 07424
MLS# 26025315Listed by: KELLER WILLIAMS REALTY - NJ METRO GROUP - New
 $575,000Active5 beds 3 baths
288 Totowa Ave, Paterson City, NJ 07502
MLS# 4038882Listed by: HOMESMART FIRST ADVANTAGE - New
 $449,000Active2 beds 1 baths
53 Lakeview Drive, West Milford, NJ 07480
MLS# 26025044Listed by: COLDWELL BANKER, WAYNE - New
 $749,000Active5 beds 4 baths
15 Putnam Place, Clifton, NJ 07011
MLS# 26025301Listed by: GILD REALTY - New
 $475,000Active2 beds 3 baths
74 Mountainside Drive, Pompton Lakes, NJ 07442
MLS# 26024127Listed by: KELLER WILLIAMS PROSPERITY REALTY - Open Thu, 5 to 7pmNew
 $839,000Active3 beds 3 baths
62 Hickory Hill Boulevard 2001, Totowa, NJ 07512
MLS# 26024239Listed by: THE AGENCY ONE ROCK-MAHWAH - New
 $399,900Active2 beds 2 baths
1113 Warren 113, Wanaque, NJ 07465
MLS# 26024529Listed by: REALTY EXECUTIVES EXCEPTIONAL REALTORS-WAYNE - New
 $599,000Active-- beds 3 baths
80 Wayne Avenue, Paterson, NJ 07522
MLS# 26024945Listed by: GILD REALTY - New
 $650,000Active-- beds 4 baths
662-664 29th Street, Paterson, NJ 07504
MLS# 26025118Listed by: ELEVATE REALTY - New
 $675,000Active4 beds 3 baths
10 Tice Road, West Milford, NJ 07421
MLS# 26025125Listed by: EXP REALTY, LLC - New
 $475,000Active2 beds 2 baths
262 Main 203, Little Falls, NJ 07424
MLS# 26025198Listed by: THE REALTY BOUTIQUE - New
 $650,000Active-- beds 4 baths
15 Elm Street, Paterson, NJ 07501
MLS# 26025235Listed by: REALTY EMPIRE, LLC - New
 $829,999Active-- beds 4 baths
9 Vreeland Avenue, Passaic, NJ 07055
MLS# 26025246Listed by: COLDWELL BANKER, CLIFTON - New
 $399,900Active2 beds 2 baths
1113 Warrens Way, Wanaque Boro, NJ 07465
MLS# 4038842Listed by: REALTY EXECUTIVES EXCEPTIONAL - New
 $699,999Active5 beds 2 baths
35 Passaic Avenue, Woodland Park, NJ 07424
MLS# 26025270Listed by: SIGNATURE REALTY NJ LLC - New
 $499,000Active3 beds 4 baths2,381 sq. ft.
107 Rock Ledge Ter, Haledon Boro, NJ 07508
MLS# 4038828Listed by: KELLER WILLIAMS SUBURBAN REALTY - New
 $280,000Active1 beds 1 baths
100 Pierson Miller Dr #22, Pompton Lakes Boro, NJ 07442
MLS# 4038801Listed by: KELLER WILLIAMS TEAM REALTY - New
 $1,900,000Active6 beds 6 baths
51 Herfort Road, Wayne, NJ 07470
MLS# 26025209Listed by: HOWARD HANNA RAND REALTY - New
 $499,900Active3 beds 3 baths
17 Birchwood Pass, West Milford, NJ 07480
MLS# 26025211Listed by: EXP REALTY, LLC - New
 $1,249,900Active5 beds 5 baths
15 Edison Street, Clifton, NJ 07013
MLS# 26025224Listed by: MERCHAN TEAM REAL ESTATE - New
 $699,900Active3 beds 3 baths2,456 sq. ft.
633 Totowa Rd, Totowa Boro, NJ 07512
MLS# 4038703Listed by: C-21 GOLD PROPERTIES REALTY - Open Mon, 5 to 7pmNew
 $699,000Active4 beds 2 baths
81 Huron Ave, Clifton City, NJ 07013
MLS# 4038705Listed by: GILD REALTY - New
 $499,900Active3 beds 2 baths
73 Raritan Ave, Paterson City, NJ 07503
MLS# 4038716Listed by: NICHOLAS REAL ESTATE AGENCY - New
 $869,900Active5 beds 3 baths
251 Speer Ave, Clifton City, NJ 07013
MLS# 4038720Listed by: SCHEIDEMANN AGENCY - New
 $364,000Active2 beds 2 baths1,100 sq. ft.
48 Quartz Ln, Paterson City, NJ 07501
MLS# 4038727Listed by: C-21 GOLD PROPERTIES REALTY - New
 $749,999Active4 beds 2 baths
61 Winifred Dr, Totowa Boro, NJ 07512
MLS# 4038738Listed by: REALTY OF AMERICA - New
 $649,000Active3 beds 2 baths
304 Washington Avenue, Clifton, NJ 07011
MLS# 26025139Listed by: GILD REALTY - New
 $499,900Active3 beds 2 baths
106 Starlight Road, West Milford, NJ 07480
MLS# 26025147Listed by: COLDWELL BANKER, SPARTA - Open Mon, 5 to 7pmNew
 $599,000Active3 beds 2 baths
389 Colfax Ave, Clifton City, NJ 07013
MLS# 4038601Listed by: GILD REALTY - New
 $325,000Active1 beds 1 baths
15 Van Wagoner Ave, Clifton City, NJ 07013
MLS# 4038619Listed by: COLDWELL BANKER REALTY - New
 $749,900Active4 beds 3 baths
121 Magee Rd, Ringwood Boro, NJ 07456
MLS# 4038650Listed by: BHGRE GREEN TEAM - New
 $829,999Active8 beds 4 baths
9 Vreeland Ave #4, Passaic City, NJ 07055
MLS# 4038688Listed by: COLDWELL BANKER REALTY - New
 $499,999Active3 beds 3 baths
95 E 7th Street, Clifton, NJ 07011
MLS# 26025120Listed by: EXP REALTY, LLC - New
 $499,000Active2 beds 3 baths
63 Princeton Street, Clifton, NJ 07014
MLS# 26021262Listed by: REALTY ONE GROUP SUNRISE - New
 $799,000Active4 beds 3 baths
721 Ringwood Avenue, Pompton Lakes, NJ 07442
MLS# 26025097Listed by: WEICHERT REALTORS, RIDGEWOOD - Open Mon, 5:30 to 7pmNew
 $549,000Active2 beds 1 baths
137 Day Street, Clifton, NJ 07011
MLS# 26025104Listed by: GILD REALTY - New
 $850,000Active5 beds 4 baths
64 Ricker Drive, Ringwood, NJ 07456
MLS# 26008651Listed by: EXP REALTY, LLC - New
 $299,000Active2 beds 2 baths
89 Tintle Avenue, West Milford, NJ 07480
MLS# 26025085Listed by: RE/MAX HOMETOWNE REALTY - Open Mon, 5 to 7pmNew
 $599,000Active3 beds 2 baths
101 John Street, Clifton, NJ 07013
MLS# 26025087Listed by: GILD REALTY - New
 $799,000Active5 beds 3 baths
896 Union Valley Road, West Milford, NJ 07480
MLS# 26025063Listed by: BERKSHIRE HATHAWAY HOME SERVICES FOX & ROACH REALTORS - LIVINGSTON - New
 $700,000Active4 beds 3 baths2,080 sq. ft.
19 Lawrence Rd, Wayne Twp., NJ 07470
MLS# 4038565Listed by: KELLER WILLIAMS PROSPERITY REALTY - New
 $499,000Active4 beds 2 baths
35 Spruce Rd, Pompton Lakes Boro, NJ 07442
MLS# 4038573Listed by: HOWARD HANNA RAND REALTY - New
 $449,900Active5 beds 2 baths
1029 E 19th St, Paterson City, NJ 07501
MLS# 4038551Listed by: CENTURY 21 THE CROSSING - New
 $799,000Active5 beds 3 baths1,716 sq. ft.
16 Offord St, Passaic City, NJ 07055
MLS# 4038516Listed by: COLDWELL BANKER REALTY - New
 $999,900Active6 beds 5 baths
52 Ashburn Road, Wayne, NJ 07470
MLS# 26024986Listed by: RE/MAX ELITE REALTY - New
 $159,000Active1 beds 1 baths
1311 Richmond Road, West Milford, NJ 07480
MLS# 26023234Listed by: THE BIXLER GROUP, LLC - New
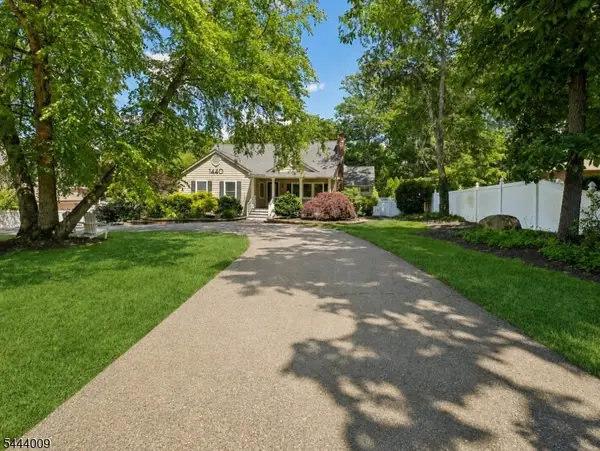 $1,049,000Active4 beds 3 baths
1440 Alps Rd, Wayne Twp., NJ 07470
MLS# 4038452Listed by: HALO REALTY PROPERTIES LLC - New
 $620,000Active2 beds 3 baths2,300 sq. ft.
46 Devonshire Dr, Clifton City, NJ 07013
MLS# 4038453Listed by: STREAMLINE - New
 $1,249,900Active5 beds 5 baths
15 Edison St, Clifton City, NJ 07013
MLS# 4038446Listed by: MERCHAN TEAM REALTY LLC. - New
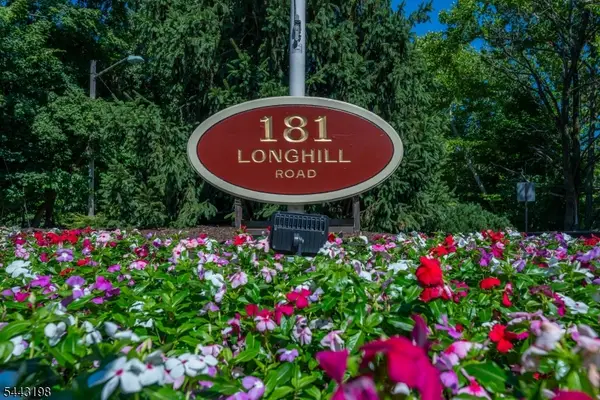 $399,000Active1 beds 2 baths
181 Long Hill Rd 5-5 #5, Little Falls Twp., NJ 07424
MLS# 4038447Listed by: BHHS VAN DER WENDE PROPERTIES - New
 $670,000Active4 beds 2 baths
165 5th Ave, Hawthorne Boro, NJ 07506
MLS# 4038436Listed by: SNAP N SHOP HOMES - New
 $670,000Active4 beds 2 baths
165 5th Avenue, Paterson, NJ 07524
MLS# 26024949Listed by: SNAP N SHOP HOMES - New
 $650,000Active3 beds 2 baths
59 Mitchell Avenue, Totowa, NJ 07512
MLS# 26024927Listed by: NENO-ROSA AGENCY - New
 $730,196Active2 beds 3 baths1,632 sq. ft.
18 Wellspring Court #612, Wayne Twp., NJ 07470
MLS# 4038394Listed by: LANDARAMA INC. - New
 $699,933Active2 beds 3 baths1,632 sq. ft.
8 Wellspring Court #614, Wayne Twp., NJ 07470
MLS# 4038395Listed by: LANDARAMA INC. - New
 $729,708Active2 beds 3 baths1,632 sq. ft.
16 Reservoir Court #712, Wayne Twp., NJ 07470
MLS# 4038396Listed by: LANDARAMA INC. - New
 $730,933Active2 beds 3 baths1,632 sq. ft.
8 Reservoir Court #714, Wayne Twp., NJ 07470
MLS# 4038397Listed by: LANDARAMA INC. - New
 $789,723Active2 beds 3 baths1,632 sq. ft.
4 Reservoir Court #715, Wayne Twp., NJ 07470
MLS# 4038398Listed by: LANDARAMA INC. - New
 $1,950,000Active5 beds 6 baths
720 Berdan Ave, Wayne Twp., NJ 07470
MLS# 4038403Listed by: UNITED REAL ESTATE - New
 $814,595Active3 beds 3 baths2,269 sq. ft.
10 Reservoir Court #723, Wayne Twp., NJ 07470
MLS# 4038408Listed by: LANDARAMA INC. - New
 $860,415Active3 beds 3 baths2,269 sq. ft.
2 Reservoir Court #725, Wayne Twp., NJ 07470
MLS# 4038409Listed by: LANDARAMA INC. - New
 $1,199,000Active3 beds 4 baths
114 Main Street, Little Falls, NJ 07424
MLS# 22620203Listed by: EXIT REALTY EAST COAST SHIRVANIAN - New
 $579,000Active4 beds 2 baths
373 Union Ave, Clifton City, NJ 07011
MLS# 4038382Listed by: COLDWELL BANKER REALTY - New
 $1,199,000Active3 beds 4 baths
114 E Main St, Little Falls Twp., NJ 07424
MLS# 4038386Listed by: EXIT REALTY EAST COAST SHIRVANIAN - New
 $450,000Active6 beds 2 baths
124 South St, Passaic City, NJ 07055
MLS# 4038325Listed by: COLDWELL BANKER REALTY - New
 $349,000Active2 beds 2 baths
2 Richmond Road 302, West Milford, NJ 07480
MLS# 26024796Listed by: KELLER WILLIAMS REALTY - New
 $359,000Active2 beds 1 baths
51 Hinchman Avenue 2A, Wayne, NJ 07470
MLS# 26024858Listed by: EXP REALTY, LLC - New
 $305,000Active1 beds 1 baths
32 Knox Terrace 1D, Wayne, NJ 07470
MLS# 26024861Listed by: EXP REALTY, LLC - New
 $625,000Active3 beds 3 baths
54 Harvest Way 605X, Little Falls, NJ 07424
MLS# 26024880Listed by: KELLER WILLIAMS VILLAGE SQUARE REALTY - New
 $669,900Active4 beds 4 baths
9 Wallace Lane, Woodland Park, NJ 07424
MLS# 26023157Listed by: REALTY EXECUTIVES EXCEPTIONAL REALTORS-LITTLE FALLS - New
 $650,000Active5 beds 2 baths
45 Leonard Ter, Wayne Twp., NJ 07470
MLS# 4038309Listed by: WEICHERT REALTORS CORP HQ - New
 $625,000Active3 beds 3 baths2,042 sq. ft.
54 Harvest Way, Little Falls Twp., NJ 07424
MLS# 4038300Listed by: KELLER WILLIAMS VILLAGE SQUARE - New
 $425,000Active3 beds 1 baths
33 Butler Street, Clifton, NJ 07011
MLS# 26024285Listed by: HOWARD HANNA RAND REALTY, LIVINGSTON - New
 $765,000Active2 beds 2 baths
77 E Lake Drive, Wayne, NJ 07470
MLS# 26024852Listed by: KELLER WILLIAMS PROSPERITY REALTY - New
 $549,000Active4 beds 2 baths
512 Lake Shore Dr, West Milford Twp., NJ 07421
MLS# 4038243Listed by: SIGNATURE REALTY NJ - New
 $474,900Active4 beds 2 baths
21 Louis Ave, West Milford Twp., NJ 07480
MLS# 4038201Listed by: KELLER WILLIAMS PROSPERITY REALTY - New
 $786,568Active2 beds 3 baths1,632 sq. ft.
22 Wellspring Court #611, Wayne Twp., NJ 07470
MLS# 4038191Listed by: LANDARAMA INC. - New
 $289,000Active2 beds 2 baths1,220 sq. ft.
-7215 Richmond Road, West Milford, NJ 07480
MLS# 2618155RListed by: EXP REALTY, LLC - New
 $475,000Active2 beds 2 baths
240 Cambridge Court, Clifton, NJ 07014
MLS# 26024631Listed by: EXP REALTY, LLC - New
 $459,900Active3 beds 1 baths
73 Bergen Avenue, Wanaque, NJ 07420
MLS# 26024765Listed by: KELLER WILLIAMS PROSPERITY REALTY - New
 $299,999Active2 beds 1 baths
82 Fairview Drive, West Milford, NJ 07421
MLS# 26024772Listed by: WERNER REALTY - New
 $895,000Active6 beds 4 baths3,342 sq. ft.
62 Andover Dr, Wayne Twp., NJ 07470
MLS# 4038142Listed by: KELLER WILLIAMS PROSPERITY REALTY  $499,000Active3 beds 2 baths
32 Marconi St, Clifton City, NJ 07013
MLS# 4038078Listed by: NICHOLAS REAL ESTATE AGENCY $629,000Active3 beds 2 baths
711 Bloomfield Avenue, Clifton, NJ 07012
MLS# 26024734Listed by: HOMESMART FIRST ADVANTAGE REALTY $685,000Pending4 beds 2 baths
105 Knapp Ave, Clifton City, NJ 07011
MLS# 4038029Listed by: GILD REALTY $725,000Active3 beds 3 baths1,900 sq. ft.
117 Wilmore Rd, Little Falls Twp., NJ 07424
MLS# 4038035Listed by: C-21 CEDARCREST REALTY $626,000Active4 beds 2 baths
81 Union Ave, Paterson City, NJ 07502
MLS# 4038040Listed by: COLDWELL BANKER REALTY $599,000Active3 beds 2 baths
720 Ringwood Avenue, Pompton Lakes, NJ 07442
MLS# 26024667Listed by: KELLER WILLIAMS PROSPERITY REALTY $489,999Active3 beds 2 baths
1 Welch Road, Ringwood, NJ 07456
MLS# 26024689Listed by: REALTY EXECUTIVES FIRST CLASS $375,000Active2 beds 1 baths900 sq. ft.
47 Hinchman Ave #2A, Wayne Twp., NJ 07470
MLS# 4037931Listed by: WEICHERT REALTORS $799,999Active4 beds 2 baths
18 Rosengren Ave, Totowa Boro, NJ 07512
MLS# 4037938Listed by: EXP REALTY, LLC $520,000Active3 beds 3 baths
54 Navajo Trl, West Milford Twp., NJ 07480
MLS# 4037897Listed by: EXP REALTY, LLC $399,000Active3 beds 2 baths
121 Townsend Road, Wanaque, NJ 07465
MLS# 26024597Listed by: COLDWELL BANKER, SPARTA $939,900Active-- beds -- baths
142 Passaic Street, Passaic, NJ 07055
MLS# 26022139Listed by: CENTURY 21 JR GOLD TEAM REALTY, LLC $850,000Active-- beds 2 baths
1025 Ringwood Avenue, Wanaque, NJ 07420
MLS# 26024321Listed by: KELLER WILLIAMS PROSPERITY REALTY- $855,500Active-- beds 4 baths
253 4th Street, Paterson, NJ 07522
MLS# 26024447Listed by: ESTATES PRIME REALTY  $279,888Active2 beds 1 baths
6104 Richmond Road, West Milford, NJ 07480
MLS# 26024449Listed by: KELLER WILLIAMS VILLAGE SQUARE REALTY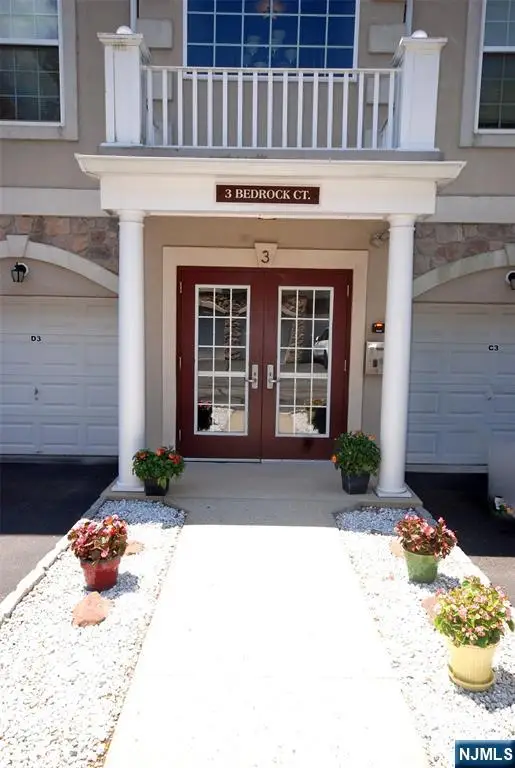 $599,000Pending2 beds 2 baths
3 Bedrock Court A3, Woodland Park, NJ 07424
MLS# 26024509Listed by: BERKSHIRE HATHAWAY HOME SERVICES VAN DER WENDE PROPERTIES $489,900Active2 beds 1 baths
110 3rd Avenue, Hawthorne, NJ 07506
MLS# 26024558Listed by: QUALITY HOMES REAL ESTATE $424,900Active2 beds 2 baths
38 Chanda Court D038, Clifton, NJ 07012
MLS# 26024560Listed by: KELLER WILLIAMS PROSPERITY REALTY $424,900Active2 beds 2 baths
38 Chanda Ct, Clifton City, NJ 07012
MLS# 4037866Listed by: KELLER WILLIAMS PROSPERITY REALTY $385,000Pending2 beds 1 baths
47 Hinchman Ave #2C, Wayne Twp., NJ 07470
MLS# 4037828Listed by: WEICHERT REALTORS $449,000Active4 beds 2 baths
344 Union Ave, Bloomingdale Boro, NJ 07403
MLS# 4037815Listed by: BHGRE GREEN TEAM $424,999Active3 beds 2 baths
69 N 4th St, Paterson City, NJ 07522
MLS# 4037799Listed by: REALTY OF AMERICA $875,000Active4 beds 3 baths
54 Church Lane, Wayne, NJ 07470
MLS# 26024485Listed by: HOWARD HANNA RAND REALTY $649,000Active2 beds 1 baths
3 Allaire Rd, West Milford Twp., NJ 07480
MLS# 4037682Listed by: RE/MAX COUNTRY REALTY $350,000Active3 beds 1 baths774 sq. ft.
191 Fayette Ave, Wayne Twp., NJ 07470
MLS# 4037709Listed by: KELLER WILLIAMS PROSPERITY REALTY $1,050,000Active1.77 Acres
839 Rifle Camp Rd, Woodland Park, NJ 07424
MLS# 4037713Listed by: COLDWELL BANKER REALTY $430,000Active3 beds 2 baths
71 E 36th St, Paterson City, NJ 07514
MLS# 4037718Listed by: NICHOLAS REAL ESTATE AGENCY $950,000Active9 beds 6 baths
152-154 Jasper St, Paterson City, NJ 07522
MLS# 4037721Listed by: REDFIN CORPORATION $499,000Active3 beds 2 baths
102 Dewey Avenue, Totowa, NJ 07512
MLS# 26023654Listed by: BERKSHIRE HATHAWAY HOME SERVICES ABBOTT REALTORS $899,000Active4 beds 4 baths
1779 Macopin Road, West Milford, NJ 07480
MLS# 26024328Listed by: KELLER WILLIAMS PROSPERITY REALTY $724,798Active3 beds 2 baths
48 Lake Drive, Wayne, NJ 07470
MLS# 26024459Listed by: UNITED REAL ESTATE $850,000Active4 beds 5 baths
71 Ringwood Ave, Pompton Lakes Boro, NJ 07442
MLS# 4037660Listed by: COLDWELL BANKER REALTY $565,000Active4 beds 3 baths
237 Sherwood Ave, Paterson City, NJ 07502
MLS# 4037656Listed by: KELLER WILLIAMS REALTY $679,900Active3 beds 2 baths
74 Race Track Dr, West Milford Twp., NJ 07480
MLS# 4037617Listed by: RE/MAX COUNTRY REALTY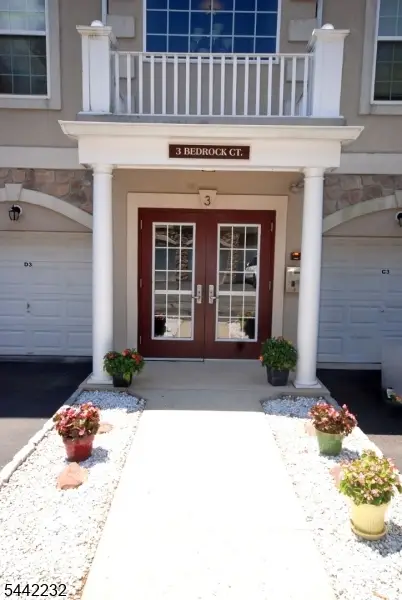 $599,000Pending2 beds 2 baths1,466 sq. ft.
3 Bedrock Ct A3, Woodland Park, NJ 07424
MLS# 4037598Listed by: BHHS VAN DER WENDE PROPERTIES $1,299,000Active5 beds 4 baths2,801 sq. ft.
11 Gates Pl, Wayne Twp., NJ 07470
MLS# 4037537Listed by: HOWARD HANNA RAND REALTY $525,000Active2 beds 3 baths
31 Lockley Ct, Wayne Twp., NJ 07470
MLS# 4037549Listed by: KELLER WILLIAMS PROSPERITY REALTY $1,100,000Active3 beds 3 baths
91 Minnisink Road, Totowa, NJ 07512
MLS# 26024304Listed by: REALTY EXECUTIVES EXCEPTIONAL REALTORS-POMPTON PLAINS $949,000Active-- beds 3 baths
54 Haverhill Avenue, Woodland Park, NJ 07424
MLS# 26023954Listed by: BERKSHIRE HATHAWAY HOME SERVICES FOX & ROACH REALTORS - MONTCLAIR $479,000Pending2 beds 2 baths
200 Cambridge Court G100, Clifton, NJ 07014
MLS# 26024188Listed by: COMPASS NEW JERSEY, LLC-MONTCLAIR $359,900Active2 beds 1 baths
1255A Valley Road 15, Wayne, NJ 07470
MLS# 26024195Listed by: HOWARD HANNA RAND REALTY $749,999Active-- beds 5 baths
363-365 Summer Street, Paterson, NJ 07501
MLS# 26024219Listed by: KELLER WILLIAMS PROSPERITY REALTY $789,000Active4 beds 3 baths
39 Robin Hood Way, Wayne, NJ 07470
MLS# 26024275Listed by: COLDWELL BANKER, WAYNE $399,000Active4 beds 2 baths
97 Sherman Street, Passaic, NJ 07055
MLS# 26024264Listed by: REALTY ONE GROUP LEGEND, CLIFTON $799,900Active6 beds 2 baths
15 Harrison Pl, Clifton City, NJ 07011
MLS# 4037472Listed by: EREALTY $554,900Active4 beds 2 baths
67 Greenbrook Dr, West Milford Twp., NJ 07480
MLS# 4037439Listed by: RE/MAX COUNTRY REALTY $449,998Active3 beds 2 baths
45 Dey Street, Paterson, NJ 07503
MLS# 26020067Listed by: KELLER WILLIAMS PARK VIEWS $660,000Active3 beds 2 baths
89 Knolls Rd, Bloomingdale Boro, NJ 07403
MLS# 4037426Listed by: STAY HOME REALTY LLC $479,000Pending2 beds 2 baths
200 Cambridge Ct #200, Clifton City, NJ 07014
MLS# 4037371Listed by: COMPASS NEW JERSEY LLC $568,000Active4 beds 2 baths
191 Brown Ave, Prospect Park Boro, NJ 07508
MLS# 4037380Listed by: HEIM REALTY,LLC $410,000Active2 beds 2 baths
4301 Warrens Way, Wanaque, NJ 07465
MLS# 26021057Listed by: WEICHERT REALTORS, RIDGEWOOD $325,000Active2 beds 2 baths
314 Federal Hill Road 314, Pompton Lakes, NJ 07442
MLS# 26023095Listed by: RE/MAX HOMETOWNE REALTY $649,900Active4 beds 4 baths
19 Cedar Wood Terrace, Woodland Park, NJ 07424
MLS# 26023758Listed by: THE AGENCY ONE ROCK-PARAMUS $559,900Active3 beds 2 baths
413 Paulison Avenue 2, Passaic, NJ 07055
MLS# 26023849Listed by: KELLER WILLIAMS CITY LIFE REALTY $210,000Active1 beds 1 baths
285 Aycrigg Avenue 22J, Passaic, NJ 07055
MLS# 26023864Listed by: COLDWELL BANKER, HILLSDALE $650,000Active-- beds 5 baths
108 E Main Street, Paterson, NJ 07522
MLS# 26024054Listed by: THE AGENCY ONE ROCK-FRANKLIN LAKES $670,000Active-- beds 2 baths
409 8th Street, Prospect Park, NJ 07508
MLS# 26024077Listed by: THE AGENCY ONE ROCK-FRANKLIN LAKES $499,950Active-- beds 3 baths
98-100 Lafayette Street, Paterson, NJ 07501
MLS# 26024143Listed by: COLDWELL BANKER, RIDGEWOOD $799,000Active-- beds 2 baths
157 5th Street, Paterson, NJ 07522
MLS# 26024147Listed by: UNITED REAL ESTATE $759,000Active-- beds 3 baths
360 Rutherford Boulevard, Clifton, NJ 07014
MLS# 26024177Listed by: EXP REALTY, LLC $749,999Active8 beds 5 baths
363 Summer St, Paterson City, NJ 07501
MLS# 4037352Listed by: KELLER WILLIAMS PROSPERITY REALTY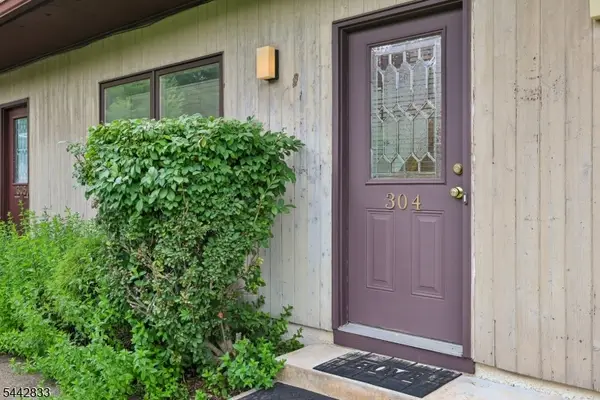 $339,900Pending1 beds 2 baths1,325 sq. ft.
281 Browertown Rd #304, Woodland Park, NJ 07424
MLS# 4037304Listed by: THE AGENCY ONE ROCK- $340,000Active2 beds 1 baths
34 8th Ave, Paterson City, NJ 07524
MLS# 4037307Listed by: GOYBURU REALTY, LLC 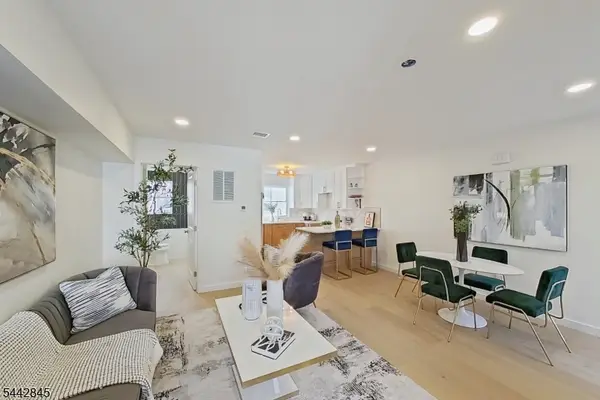 $559,900Active3 beds 2 baths
413 Paulison Ave #2, Passaic City, NJ 07055
MLS# 4037314Listed by: KELLER WILLIAMS CITY LIFE REALTY $549,910Pending4 beds 2 baths
101 Pinecrest Ter, Wayne Twp., NJ 07470
MLS# 4037321Listed by: KELLER WILLIAMS VALLEY REALTY $1,776,000Active4 beds 4 baths4,603 sq. ft.
4 Centennial Ct, Totowa Boro, NJ 07512
MLS# 4037280Listed by: PROMINENT PROPERTIES SIR $549,900Active3 beds 3 baths
299 Broadway, Paterson, NJ 07522
MLS# 26024131Listed by: CASA REAL PROPERTY GROUP LLC- $899,000Active0.29 Acres
493-497 Union Ave, Paterson City, NJ 07522
MLS# 4037267Listed by: NICHOLAS REAL ESTATE AGENCY 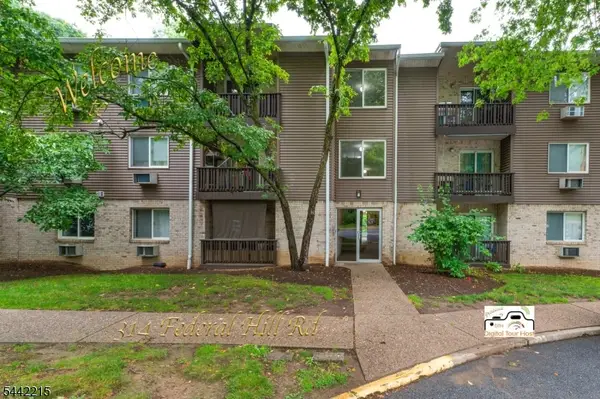 $325,000Active2 beds 2 baths
314 Federal Hill Rd Bldg C #314, Pompton Lakes Boro, NJ 07442
MLS# 4037212Listed by: RE/MAX HOMETOWNE REALTY $1,600,000Active0.4 Acres
111 Belmont Ave, Paterson City, NJ 07522
MLS# 4037181Listed by: COLDWELL BANKER REALTY $650,000Active6 beds 4 baths
106 E Main St, Paterson City, NJ 07522
MLS# 4037183Listed by: CHRISTIE'S INT. REAL ESTATE GROUP $849,000Active4 beds 2 baths
4 Howard Ave, Clifton City, NJ 07013
MLS# 4037187Listed by: EXP REALTY, LLC $949,000Active4 beds 3 baths
765 Pines Lake Drive, Wayne, NJ 07470
MLS# 26024061Listed by: HOWARD HANNA RAND REALTY $449,900Pending2 beds 2 baths
71 Reeve Avenue, Bloomingdale, NJ 07403
MLS# 26024065Listed by: COLDWELL BANKER, WAYNE $874,900Active-- beds 4 baths
139 Fairview, Prospect Park, NJ 07508
MLS# 26023901Listed by: EXP REALTY, LLC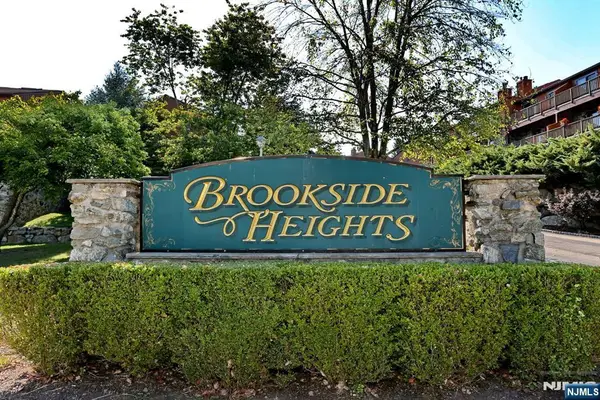 $449,000Active3 beds 3 baths
3 Brookside Heights 3i, Wanaque, NJ 07465
MLS# 26024037Listed by: RE/MAX INTEGRITY $679,000Pending4 beds 2 baths
134 Marion Ct, Pompton Lakes Boro, NJ 07442
MLS# 4037155Listed by: COLDWELL BANKER REALTY $749,999Active4 beds 2 baths
9 Joan Place, Clifton, NJ 07012
MLS# 26023912Listed by: RE/MAX ELITE REALTY $494,000Active3 beds 2 baths
33 Walter Drive, Bloomingdale, NJ 07403
MLS# 26024035Listed by: KELLER WILLIAMS PROSPERITY REALTY $849,999Active6 beds 5 baths
235 4th Ave, Paterson City, NJ 07514
MLS# 4037116Listed by: COLDWELL BANKER SUSANI REALTY $599,900Active4 beds 3 baths
832 Lafayette Ave, Hawthorne Boro, NJ 07506
MLS# 4037089Listed by: NICHOLAS REAL ESTATE AGENCY $299,000Active1 beds 1 baths908 sq. ft.
366-382 Trenton Ave #2F, Paterson City, NJ 07503
MLS# 4037095Listed by: THE HAMDAN GROUP $799,900Active4 beds 3 baths
336 1st Street, Clifton, NJ 07011
MLS# 26020906Listed by: HOWARD HANNA RAND REALTY $1,080,000Active4 beds 3 baths
45 Heritage Drive, West Milford, NJ 07480
MLS# 26024019Listed by: COMPASS NEW JERSEY, LLC-HOBOKEN $529,000Active4 beds 2 baths
72 Lake Drive, Wayne, NJ 07470
MLS# 26023995Listed by: COLDWELL BANKER, WAYNE $429,999Active4 beds 2 baths
171 20th Ave, Paterson City, NJ 07501
MLS# 4036991Listed by: REAL $799,000Pending3 beds 3 baths
393 Lakeview Ave, Ringwood Boro, NJ 07456
MLS# 4037026Listed by: KELLER WILLIAMS PROSPERITY REALTY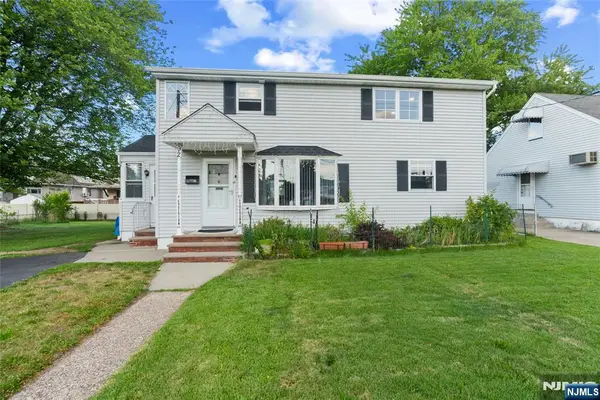 $639,998Active3 beds 2 baths
92 Anderson Avenue, Totowa, NJ 07512
MLS# 26023985Listed by: KELLER WILLIAMS PARK VIEWS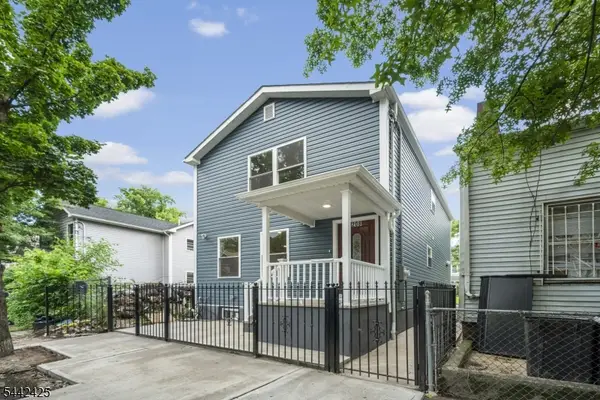 $499,000Active5 beds 4 baths
208 N 1st St, Paterson City, NJ 07522
MLS# 4036922Listed by: KELLER WILLIAMS CITY VIEWS REALTY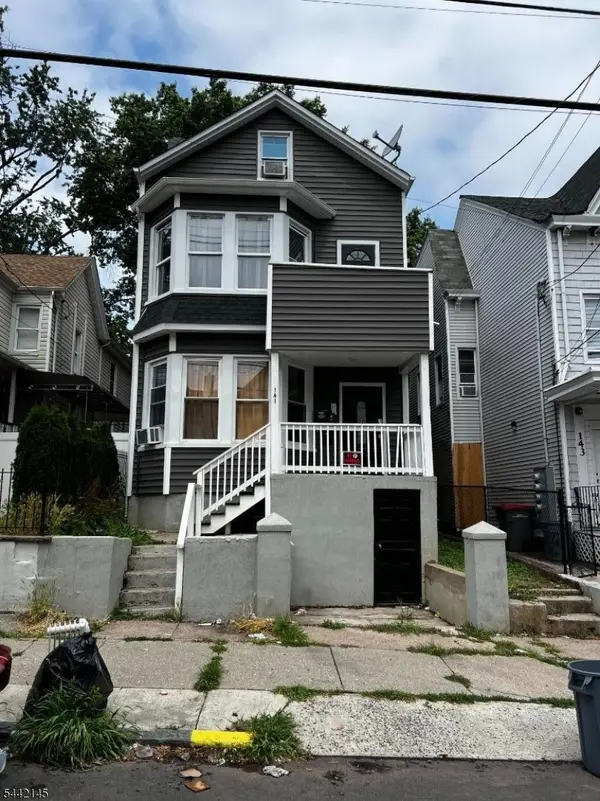 $649,000Active6 beds 3 baths
141 N 5th St, Paterson City, NJ 07522
MLS# 4036973Listed by: COLDWELL BANKER SUSANI REALTY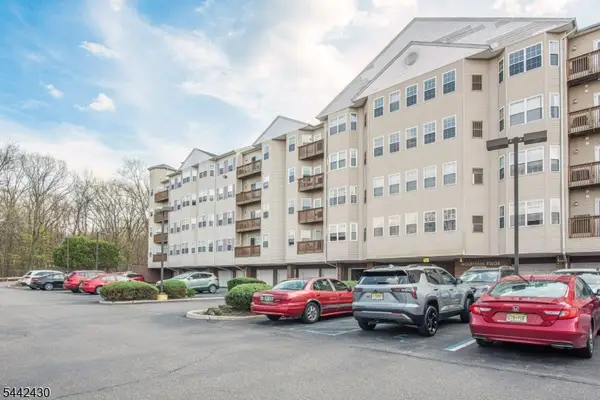 $298,800Active1 beds 1 baths
375 Rifle Camp Rd #202, Woodland Park, NJ 07424
MLS# 4036853Listed by: COLDWELL BANKER REALTY $639,000Pending4 beds 2 baths1,500 sq. ft.
170 Dawson Ave, Clifton City, NJ 07012
MLS# 4036863Listed by: KELLER WILLIAMS REALTY $515,000Pending4 beds 2 baths
75 Fichter St, Bloomingdale Boro, NJ 07403
MLS# 4036907Listed by: KELLER WILLIAMS PROSPERITY REALTY $649,900Active-- beds 4 baths
88-90 6th Street, Paterson, NJ 07522
MLS# 26012489Listed by: UNITED REAL ESTATE $359,000Active2 beds 2 baths
180 Lafayette Ave 4G, Passaic, NJ 07055
MLS# 26015925Listed by: KELLER WILLIAMS VILLAGE SQUARE REALTY $525,000Active2 beds 2 baths
6 Collura Lane, Clifton, NJ 07012
MLS# 26021420Listed by: PROMINENT PROPERTIES SOTHEBY'S INTERNATIONAL REALTY-RIDGEWOOD- $299,000Active0 Acres
21 Styles Terrace, Wayne, NJ 07470
MLS# 26023718Listed by: EXP REALTY, LLC  $749,900Active-- beds 2 baths
72 Minerva Avenue, Hawthorne, NJ 07506
MLS# 26023782Listed by: RE/MAX FIRST REALTY II $1,200,000Active5 beds 5 baths
78 Urban Club Road, Wayne, NJ 07470
MLS# 26023783Listed by: THE AGENCY ONE ROCK-PARAMUS $630,000Active3 beds 3 baths
8023 Brittany Drive, Wayne, NJ 07470
MLS# 26023815Listed by: WEICHERT REALTORS, RIDGEWOOD $699,000Active3 beds 3 baths
1 Dawson Ave, Passaic City, NJ 07055
MLS# 4036825Listed by: COLDWELL BANKER REALTY $1,250,000Pending4 beds 4 baths
57 Coventry Rd, Wayne Twp., NJ 07470
MLS# 4036832Listed by: KELLER WILLIAMS PROSPERITY REALTY $639,900Active3 beds 3 baths2,028 sq. ft.
72 Birch Ln, Wayne Twp., NJ 07470
MLS# 4036834Listed by: MISSION REALTY, LLC $479,999Active2 beds 1 baths
4 Salem Road, Paterson, NJ 07502
MLS# 26023569Listed by: UNITED REAL ESTATE $700,000Active3 beds 2 baths
139 Mohawk Trail, Wayne, NJ 07470
MLS# 26023659Listed by: FATHOM REALTY NJ LLC $549,000Active3 beds 2 baths
117-119 Richmond Avenue, Paterson, NJ 07502
MLS# 26023818Listed by: WERNER REALTY $425,000Active4 beds 2 baths
88 N 2nd Street, Paterson, NJ 07522
MLS# 26024469Listed by: RE/MAX 1ST ADVANTAGE $369,000Pending2 beds 1 baths
8 Woodland Rd, Ringwood Boro, NJ 07456
MLS# 4036744Listed by: SIGNATURE REALTY NJ $400,000Pending4 beds 2 baths
230-232 Sherwood Ave, Paterson City, NJ 07502
MLS# 4036756Listed by: KELLER WILLIAMS - NJ METRO GROUP $549,000Active3 beds 3 baths
117 Richmond Ave, Paterson City, NJ 07502
MLS# 4036769Listed by: WERNER REALTY $899,000Active3 beds 2 baths
226 Winifred Dr, Totowa Boro, NJ 07512
MLS# 4036700Listed by: LATTIMER REALTY $495,000Pending3 beds 2 baths
49 Parkway, Little Falls Twp., NJ 07424
MLS# 4036705Listed by: C-21 SEMIAO & ASSOCIATES $428,700Active3 beds 2 baths
810 Colfax Avenue, Pompton Lakes, NJ 07442
MLS# 26023802Listed by: CENTURY 21 GEMINI REALTY, LLC $698,000Pending3 beds 2 baths
49 Pancake Hollow Drive, Wayne, NJ 07470
MLS# 26023689Listed by: COLDWELL BANKER, WAYNE $599,000Active3 beds 2 baths
406 High Crest Dr, West Milford Twp., NJ 07480
MLS# 4036677Listed by: PROMINENT PROPERTIES SIR $599,000Pending2 beds 2 baths
475 Rifle Camp Rd, Woodland Park, NJ 07424
MLS# 4036683Listed by: REALTY OF AMERICA $949,900Active6 beds 4 baths
200 E 11th St #1,2, Clifton City, NJ 07424
MLS# 4023034Listed by: EMLAK REALTY LLC $599,000Active3 beds 2 baths
406 High Crest Drive, West Milford, NJ 07480
MLS# 26023382Listed by: PROMINENT PROPERTIES SOTHEBY'S INTERNATIONAL REALTY-RIDGEWOOD $689,000Active4 beds 2 baths
9 Walnut St, Little Falls Twp., NJ 07424
MLS# 4036523Listed by: REALTY EXECUTIVES EXCEPTIONAL $689,500Active3 beds 2 baths
152 Long Hill Rd, Little Falls Twp., NJ 07424
MLS# 4036525Listed by: BHHS VAN DER WENDE PROPERTIES $599,900Pending3 beds 2 baths
72 Smokey Ridge Rd, Ringwood Boro, NJ 07456
MLS# 4036543Listed by: BHGRE GREEN TEAM $875,000Pending4 beds 3 baths
18 Teak Road, Wayne, NJ 07470
MLS# 26022498Listed by: KELLER WILLIAMS VILLAGE SQUARE REALTY - WYCKOFF $329,900Active1 beds 1 baths
308 Brittany 308, Wayne, NJ 07470
MLS# 26022719Listed by: PREMIER PROPERTIES DAMIANO GROUP
Local realty services provided by:CENTURY 21 Concept 100, CENTURY 21 Sylvia Geist Agency, CENTURY 21 Alliance Realty, CENTURY 21 Venture Real Estate
The data relating to the real estate for sale on this web site comes in part from the Internet Data Exchange Program of the NJMLS. Real estate listings held by brokerage firms other than CENTURY 21 Concept 100 are marked with the Internet Data Exchange logo and information about them includes the name of the listing brokers. Some properties listed with the participating brokers do not appear on this website at the request of the seller. Listings of brokers that do not participate in Internet Data Exchange do not appear on this website.
All information deemed reliable but not guaranteed. Last date updated: July 11, 2026. Source: New Jersey Multiple Listing Service, Inc.
2026 New Jersey Multiple Listing Service, Inc. All rights reserved. NJ_MLS Member Broker: Eileen O'Driscoll
The data relating to real estate for sale on this website comes in part from the IDX Program of Garden State Multiple Listing Service, L.L.C. Real estate listings held by other brokerage firms are marked as IDX Listing. Information deemed reliable but not guaranteed. 2026 Garden State Multiple Listing Service, L.L.C. All rights reserved. Notice: The dissemination of listings on this website does not constitute the consent required by N.J.A.C. 11:5.6.1 (n) for the advertisement of listings exclusively for sale by another broker. Any such consent must be obtained in writing from the listing broker. This information is being provided for Consumers' personal, non-commercial use and may not be used for any purpose other than to identify prospective properties Consumers may be interested in purchasing. Date Last Updated July 12, 2026 NJ_GSMLS Member Broker: Robert Geist
The data relating to real estate for sale or rent on this website comes in part from the IDX program of the HCMLS. Real estate listings held by brokerage firms other than CENTURY 21 Alliance Realty are marked with the HCIDX mark and the information about them includes the name of the listing broker. The information provided by this website is for personal, non-commercial use of consumers and may not be used for any purpose other than to identify prospective properties consumers may be interested in purchasing or renting. NJ_HCMLS Member Broker: Douglas E Ramos
The data relating to real estate for sale on this web-site comes in part from the Internet Listing Display database of the CENTRAL JERSEY MULTIPLE LISTING SYSTEM, INC. Real estate listings held by brokerage firms other than this site-owner are marked with the ILD logo. The CENTRAL JERSEY MULTIPLE LISTING SYSTEM, INC does not warrant the accuracy, quality, reliability, suitability, completeness, usefulness or effectiveness of any information provided. The information being provided is for consumers' personal, non-commercial use and may not be used for any purpose other than to identify properties the consumer may be interested in purchasing or renting. Copyright 2026, CENTRAL JERSEY MULTIPLE LISTING SYSTEM, INC. All rights reserved”. The CENTRAL JERSEY MULTIPLE LISTING SYSTEM, INC retains all rights, title and interest in and to its trademarks, service marks and copyrighted material. NJ_MCMLS Member Broker: Fernando G Semiao
Popular searches near Passaic County, NJ
Popular neighborhoods near Passaic County, NJ
- 1st Ward, Paterson homes for sale
- 2nd Ward, Paterson homes for sale
- 3rd Ward, Paterson homes for sale
- 4th Ward, Paterson homes for sale
- 5th Ward, Paterson homes for sale
- 6th Ward, Paterson homes for sale
- Albion, Clifton homes for sale
- Change Bridge at Montville, Montville homes for sale
- Downtown Paterson, Paterson homes for sale
- Hillcrest, Paterson homes for sale
- Little Lima, Paterson homes for sale
- Manor Section, Paterson homes for sale
- Northside, Paterson homes for sale
- Peoples Park, Paterson homes for sale
- Riverside, Paterson homes for sale
- Sandy Hill, Paterson homes for sale
- South Paterson, Paterson homes for sale
- Stoney Road, Paterson homes for sale
- Totowa, Paterson homes for sale
- Wrigley Park, Paterson homes for sale
Zip codes near Passaic County, NJ
- 07035 homes for sale
- 07045 homes for sale
- 07082 homes for sale
- 07403 homes for sale
- 07405 homes for sale
- 07417 homes for sale
- 07420 homes for sale
- 07430 homes for sale
- 07435 homes for sale
- 07436 homes for sale
- 07440 homes for sale
- 07442 homes for sale
- 07444 homes for sale
- 07456 homes for sale
- 07457 homes for sale
- 07465 homes for sale
- 07470 homes for sale
- 07480 homes for sale
- 07481 homes for sale
- 07508 homes for sale
Protect your home and budget from life's surprises with an Assurant Home Warranty, backed by a partner that supports you through every step of homeownership. Explore Plans.
©2026 Century 21 Real Estate LLC. All rights reserved. CENTURY 21®, the CENTURY 21 Logo and C21® are service marks owned by Century 21 Real Estate LLC. Century 21 Real Estate LLC fully supports the principles of the Fair Housing Act and the Equal Opportunity Act. Each office is independently owned and operated. Listing information is deemed reliable but not guaranteed accurate.