- Beverly homes for sale
- Danvers homes for sale
- Lynn homes for sale
- Lynnfield homes for sale
- Marblehead homes for sale
- Melrose homes for sale
- Middleton homes for sale
- Nahant homes for sale
- North Reading homes for sale
- Peabody homes for sale
- Reading homes for sale
- Revere homes for sale
- Salem homes for sale
- Saugus homes for sale
- Stoneham homes for sale
- Swampscott homes for sale
- Topsfield town homes for sale
- Topsfield homes for sale
- Wakefield homes for sale
- Wenham homes for sale
01960, MA - homes for sale
61 of 61 results displayed
- New
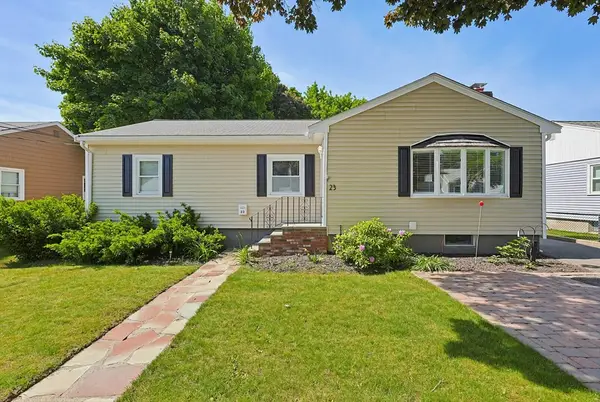
 $799,999Active4 beds 2 baths1,665 sq. ft.
29 Rockway Rd, Peabody, MA 01960
MLS# 73532933Listed by: Lokos Realty & Management - Open Sat, 12:30 to 1:30pmNew
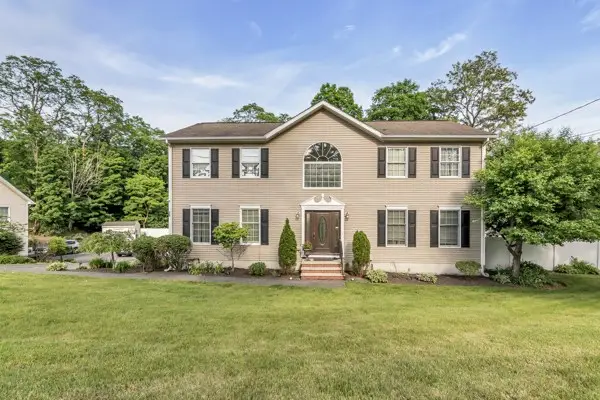
 $749,000Active4 beds 3 baths2,190 sq. ft.
395 Lowell Street, Peabody, MA 01960
MLS# 73532601Listed by: RE/MAX 360 - New
 $219,900Active1 beds 1 baths565 sq. ft.
96 Newbury #9B, Danvers, MA 01960
MLS# 73531852Listed by: eXp Realty - Open Sat, 11am to 1pmNew
 $525,000Active2 beds 2 baths1,160 sq. ft.
18 1/2 Dalton Ct #18 1/2, Peabody, MA 01960
MLS# 73531596Listed by: Redfin Corp. - Open Fri, 4:30 to 6:30pmNew
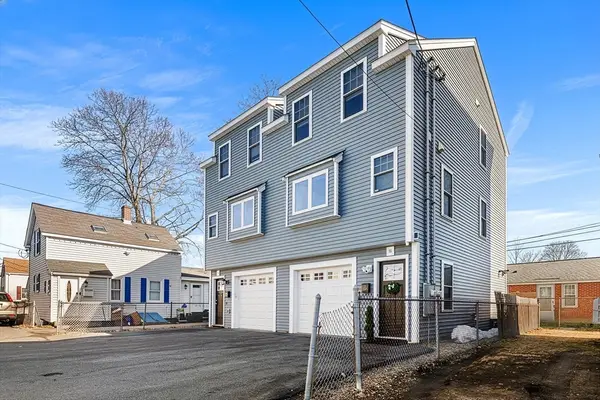
 $690,000Active3 beds 2 baths1,980 sq. ft.
23 Kosciusko St, Peabody, MA 01960
MLS# 73530819Listed by: Coldwell Banker Realty - Haverhill - Open Thu, 5:30 to 7:30pmNew
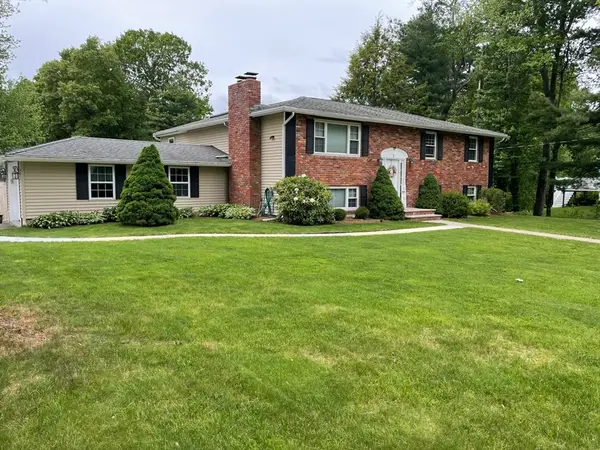
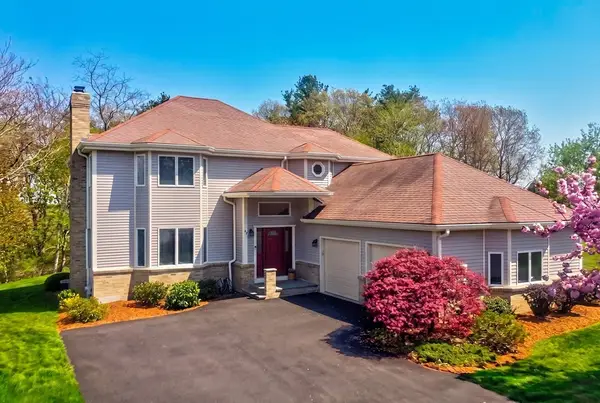
 $927,871Active4 beds 4 baths3,088 sq. ft.
30 Johnson St, Peabody, MA 01960
MLS# 73531409Listed by: Century 21 North East - Open Sat, 2 to 4pmNew
 $909,000Active4 beds 3 baths2,540 sq. ft.
3 Berkshire Rd, Peabody, MA 01960
MLS# 73531252Listed by: Simply Sell Realty - New
 $945,000Active8 beds 2 baths3,341 sq. ft.
33 Warren St, Peabody, MA 01960
MLS# 73530338Listed by: Keller Williams Realty Evolution - New
 $499,900Active2 beds 2 baths1,263 sq. ft.
1100 Salem St #75, Lynnfield, MA 01940
MLS# 73529997Listed by: J. Barrett & Company - New
 $199,900Active2 beds 1 baths830 sq. ft.
252 Newbury #58, Peabody, MA 01960
MLS# 73529963Listed by: Littlefield Real Estate - Open Sun, 1 to 2:30pmNew
 $699,000Active3 beds 2 baths2,008 sq. ft.
6 Antrim Rd, Peabody, MA 01960
MLS# 73529875Listed by: Coldwell Banker Realty - Lynnfield - New
 $384,999Active3 beds 1 baths910 sq. ft.
64 Foster St #305, Peabody, MA 01960
MLS# 73529687Listed by: Lyv Realty - New
 $699,900Active3 beds 2 baths1,608 sq. ft.
6 Buttonwood Lane, Peabody, MA 01960
MLS# 73529555Listed by: Citylight Homes LLC - New
 $599,999Active4 beds 1 baths1,152 sq. ft.
2 Johnson Ave, Peabody, MA 01960
MLS# 73529502Listed by: Prestige Homes Real Estate, LLC - New
 $589,900Active2 beds 3 baths1,804 sq. ft.
1603 Huckleberry Court #1603, Peabody, MA 01960
MLS# 73528810Listed by: Doyle Real Estate - Open Sat, 11am to 12:30pmNew
 $1,099,999Active4 beds 2 baths2,696 sq. ft.
81 Goodale St, Peabody, MA 01960
MLS# 73528811Listed by: Coldwell Banker Realty - Lynnfield - New
 $649,000Active4 beds 1 baths1,792 sq. ft.
8 Highland Street, Peabody, MA 01960
MLS# 73528659Listed by: Right Way Realty LLC - New
 $499,000Active2 beds 2 baths1,263 sq. ft.
1100 Salem St #79, Lynnfield, MA 01940
MLS# 73528066Listed by: Lamacchia Realty, Inc. - New
 $599,999Active2 beds 2 baths1,016 sq. ft.
4 Pine, Peabody, MA 01960
MLS# 73527906Listed by: NE Property Consultants - Open Wed, 4:30 to 6pmNew
 $624,900Active4 beds 1 baths1,501 sq. ft.
367 Lynnfield St, Peabody, MA 01960
MLS# 73527785Listed by: Cameron Real Estate Group  $1,199,000Active6 beds 3 baths3,819 sq. ft.
351 Lowell Street, Peabody, MA 01960
MLS# 73525705Listed by: Charlesgate Realty Group LLC $485,000Active2 beds 2 baths1,535 sq. ft.
12 Ledgewood Way #1, Peabody, MA 01960
MLS# 73525520Listed by: The Lincoln Group $649,900Active3 beds 2 baths1,740 sq. ft.
5 Milk St Ext, Peabody, MA 01960
MLS# 73525453Listed by: Lyv Realty $380,000Active1 beds 2 baths836 sq. ft.
45.5 Aborn St. #2, Peabody, MA 01960
MLS# 73525038Listed by: Conway - West Roxbury $475,000Active2 beds 2 baths1,197 sq. ft.
24 Harris St #A, Peabody, MA 01960
MLS# 73524978Listed by: LAER Realty Partners $699,000Active4 beds 2 baths1,711 sq. ft.
2 Herrick Road, Peabody, MA 01960
MLS# 73523824Listed by: eXp Realty LLC - Corporate Office- Open Sun, 1:30 to 3pm
 $825,000Active3 beds 4 baths2,405 sq. ft.
68 Prospect St #16, Peabody, MA 01960
MLS# 73523710Listed by: Century 21 North East  $519,900Active4 beds 1 baths1,326 sq. ft.
144 Tremont St, Peabody, MA 01960
MLS# 73523708Listed by: Casale-Skinner Realty $749,000Active3 beds 2 baths2,148 sq. ft.
29 Patricia Rd, Peabody, MA 01960
MLS# 73523580Listed by: Serhant $679,000Active3 beds 2 baths1,600 sq. ft.
23 Batchelder Ave, Peabody, MA 01960
MLS# 73521459Listed by: RE/MAX 360 $849,000Active3 beds 3 baths1,728 sq. ft.
8 Sparrow Ln, Peabody, MA 01960
MLS# 73521438Listed by: LAER Realty Partners $449,998Active2 beds 1 baths939 sq. ft.
19 Bourbon Street #89, Peabody, MA 01960
MLS# 73520508Listed by: Lamacchia Realty, Inc.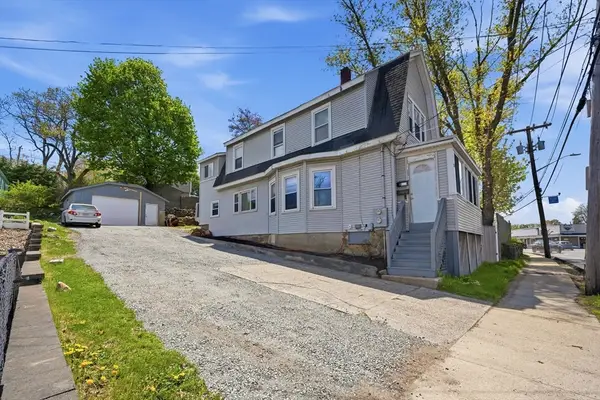 $735,000Active3 beds 2 baths1,523 sq. ft.
300 Lynn Street, Peabody, MA 01960
MLS# 73517704Listed by: Lamacchia Realty, Inc.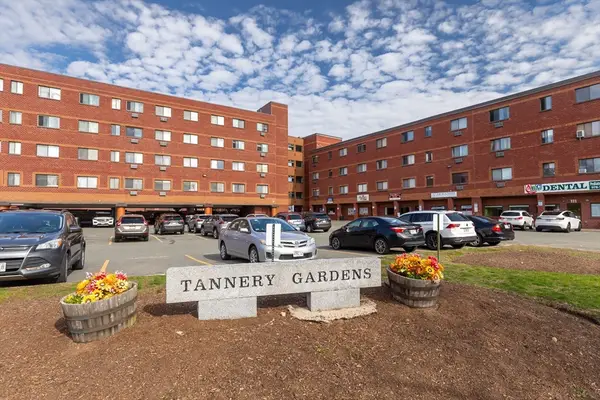 $369,000Active2 beds 1 baths953 sq. ft.
111 Foster #416, Peabody, MA 01960
MLS# 73517188Listed by: Red Square Real Estate LLC $649,900Active5 beds 3 baths2,104 sq. ft.
3 Southwick Rd, Peabody, MA 01960
MLS# 73515396Listed by: Toner Real Estate, LLC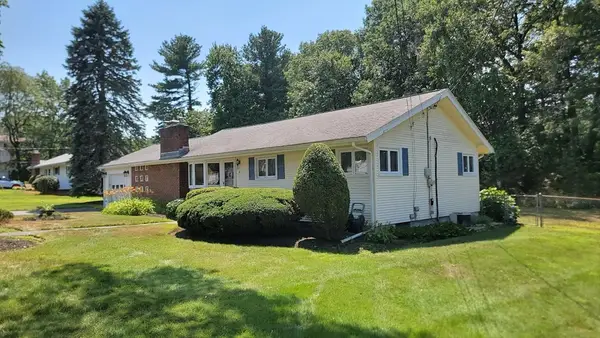 $849,000Active3 beds 2 baths2,170 sq. ft.
4 Anderson St, Peabody, MA 01960
MLS# 73514875Listed by: Your Home Realty $619,900Active2 beds 2 baths1,640 sq. ft.
4203 Woodbridge Rd #4203, Peabody, MA 01960
MLS# 73514759Listed by: J. Barrett & Company- Open Sun, 11:30am to 1pm
 $1,149,900Active4 beds 3 baths4,598 sq. ft.
43 Hampshire Road, Peabody, MA 01960
MLS# 73514069Listed by: William Raveis R.E. & Home Services  $499,000Active2 beds 2 baths1,445 sq. ft.
9 Ledgewood Way #29, Peabody, MA 01960
MLS# 73513134Listed by: Tache Real Estate, Inc. $248,000Active1 beds 1 baths640 sq. ft.
80 Foster Street #504, Peabody, MA 01960
MLS# 73512224Listed by: Lamacchia Realty, Inc. $1,285,000Active8 beds 6 baths4,617 sq. ft.
149 Washington St, Peabody, MA 01960
MLS# 73511500Listed by: Century 21 Mario Real Estate- Open Sat, 1 to 2:30pm
 $725,000Active4 beds 2 baths1,845 sq. ft.
43 Perley Ave,, Peabody, MA 01960
MLS# 73509435Listed by: Coldwell Banker Realty - Lynnfield  $625,000Active3 beds 3 baths2,140 sq. ft.
4904 Heatherwood Ln #4904, Peabody, MA 01960
MLS# 73509378Listed by: RE/MAX Partners Relocation $520,000Active2 beds 3 baths1,623 sq. ft.
112 Lowell St #11, Peabody, MA 01960
MLS# 73508940Listed by: Douglas Paul Real Estate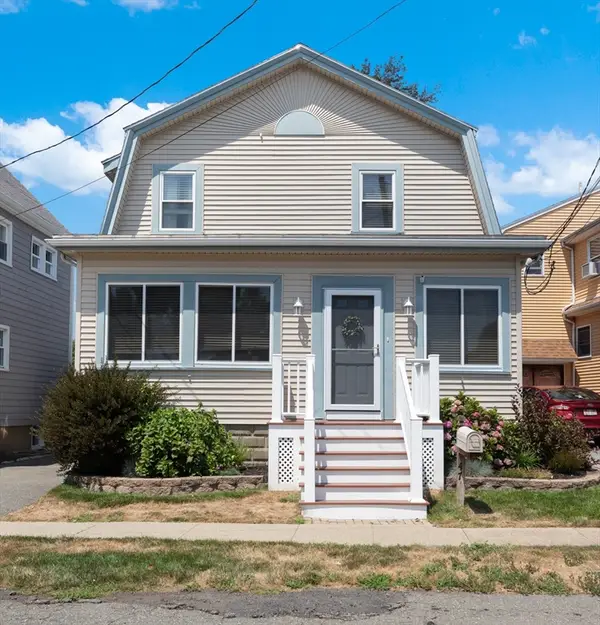 $849,900Active3 beds 4 baths2,184 sq. ft.
47 Emerson St. Ext., Peabody, MA 01960
MLS# 73505416Listed by: Churchill Properties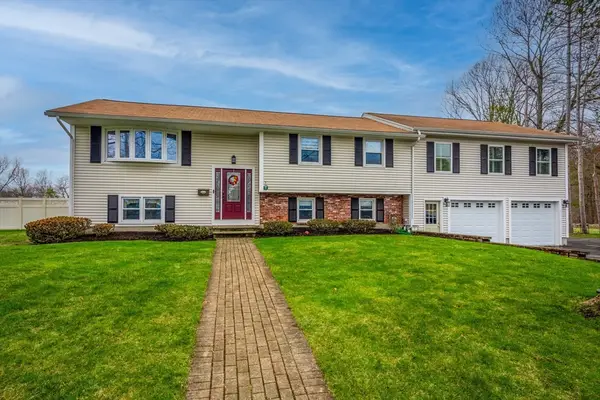 $1,075,000Active4 beds 3 baths3,700 sq. ft.
60 Catherine Drive, Peabody, MA 01960
MLS# 73504592Listed by: True North Realty $429,900Active2 beds 2 baths1,009 sq. ft.
2 Ledgewood Way #7, Peabody, MA 01960
MLS# 73503457Listed by: RE/MAX 360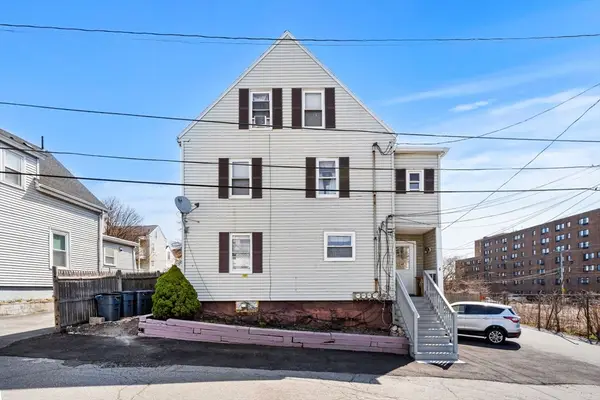 $799,000Active6 beds 3 baths2,544 sq. ft.
6 Munroe St, Peabody, MA 01960
MLS# 73501174Listed by: Access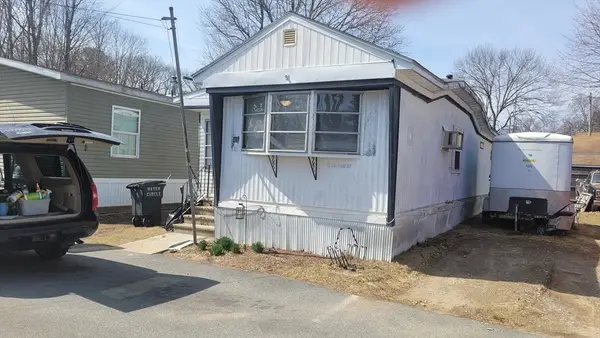 $149,900Active2 beds 1 baths740 sq. ft.
41 Pine Street #49, Peabody, MA 01960
MLS# 73493506Listed by: Littlefield Real Estate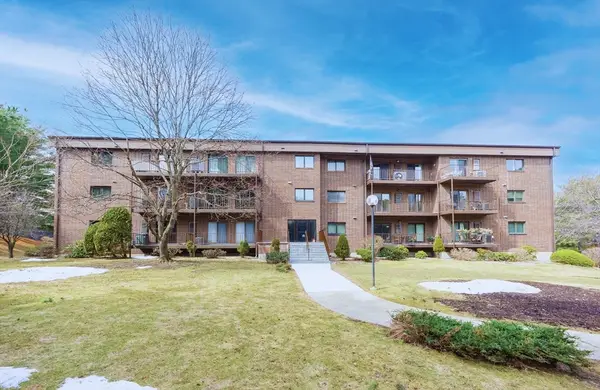 $425,000Active2 beds 2 baths1,326 sq. ft.
7 Ledgewood Way #8, Peabody, MA 01960
MLS# 73489550Listed by: Boston North Realty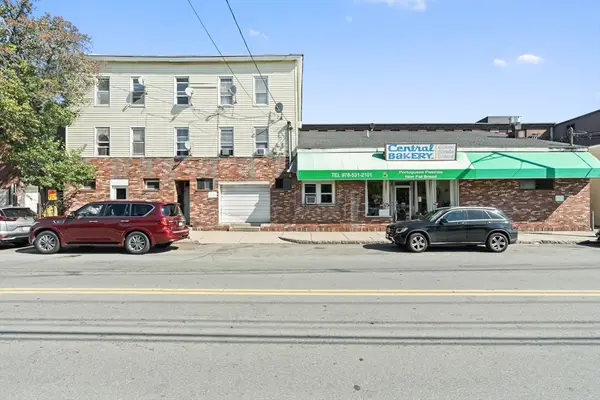 $2,750,000Active5 beds 5 baths10,231 sq. ft.
46-48 Walnut St, Peabody, MA 01960
MLS# 73487396Listed by: eXp Realty $45,000Active0.6 Acres
0 Church Street, LakeOdessa, MI 48849
MLS# 20261014264Listed by: EXCLUSIVE HOUSE OF REAL ESTATE
 $374,900Active4 beds 1 baths1,236 sq. ft.
20 Beacon Blvd, Peabody, MA 01960
MLS# 73483550Listed by: Better Homes and Gardens Real Estate - The Masiello Group $299,000Active1 beds 1 baths568 sq. ft.
64 Foster St #403, Peabody, MA 01960
MLS# 73483632Listed by: Madelyn Garcia Real Estate $520,000Active3 beds 2 baths1,410 sq. ft.
38-1/2 Ellsworth Rd, Peabody, MA 01960
MLS# 73481580Listed by: Broad Sound Real Estate, LLC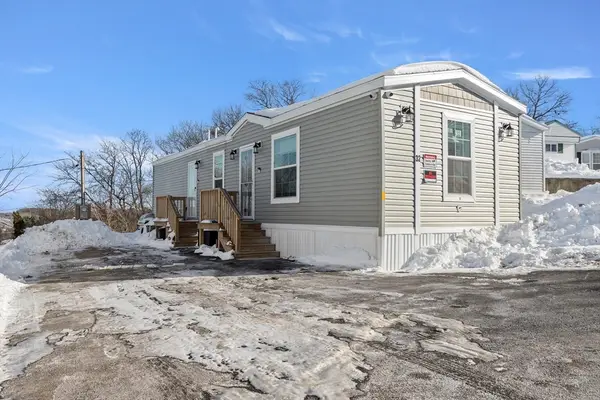 $240,000Active2 beds 1 baths728 sq. ft.
161 Newbury St #32, Peabody, MA 01960
MLS# 73474034Listed by: Conway - Dartmouth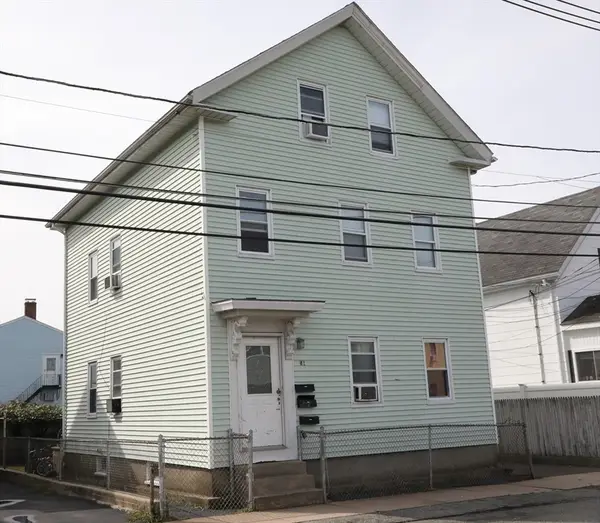 $899,000Active6 beds 3 baths2,064 sq. ft.
41 Northend St, Peabody, MA 01960
MLS# 73472241Listed by: Barry Realty Group $249,900Active2 beds 2 baths870 sq. ft.
165 Newbury #4, Peabody, MA 01960
MLS# 73448431Listed by: Littlefield Real Estate $849,000Active4 beds 2 baths1,850 sq. ft.
12 Mansfield St, Peabody, MA 01960
MLS# 73446599Listed by: OwnerEntry.com $549,900Active3 beds 1 baths1,016 sq. ft.
9 Daniel Ter, Peabody, MA 01960
MLS# 73204113Listed by: Martel Real Estate $659,900Active4 beds 2 baths1,856 sq. ft.
29 Styles Drive, Peabody, MA 01960
MLS# 73162468Listed by: Return Realty Group, Inc.
Local realty services provided by:CENTURY 21 The Real Estate Group, CENTURY 21 Curran & Oberski
Popular searches near 01960
Popular neighborhoods near 01960
- Bridge Street Neck, Salem homes for sale
- Central Business District, Salem homes for sale
- Chatham Street, Lynn homes for sale
- Downtown Beverly, Beverly homes for sale
- Fish Flake Hill, Beverly homes for sale
- Gallows Hill, Salem homes for sale
- Lakeside, Lynn homes for sale
- Lynn English, Lynn homes for sale
- Lynn Woods, Lynn homes for sale
- McIntire Historic District, Salem homes for sale
- North Salem, Salem homes for sale
- Peabody Town Center, Peabody homes for sale
- Proctor, Peabody homes for sale
- Rial Side, Beverly homes for sale
- South Peabody, Peabody homes for sale
- The Point, Salem homes for sale
- Vinnin Square, Salem homes for sale
- Waterfront District, Salem homes for sale
- West Peabody, Peabody homes for sale
- West Salem, Salem homes for sale
Counties near Peabody, 01960
- Barnstable County homes for sale
- Belknap County homes for sale
- Bristol County homes for sale
- Bristol County homes for sale
- Cheshire County homes for sale
- Essex County homes for sale
- Hillsborough County homes for sale
- Kent County homes for sale
- Merrimack County homes for sale
- Middlesex County homes for sale
- Newport County homes for sale
- Norfolk County homes for sale
- Plymouth County homes for sale
- Providence County homes for sale
- Rockingham County homes for sale
- Strafford County homes for sale
- Suffolk County homes for sale
- Windham County homes for sale
- Worcester County homes for sale
- York County homes for sale
Protect your home and budget from life's surprises with an Assurant Home Warranty, backed by a partner that supports you through every step of homeownership. Explore Plans.
©2026 Century 21 Real Estate LLC. All rights reserved. CENTURY 21®, the CENTURY 21 Logo and C21® are service marks owned by Century 21 Real Estate LLC. Century 21 Real Estate LLC fully supports the principles of the Fair Housing Act and the Equal Opportunity Act. Each office is independently owned and operated. Listing information is deemed reliable but not guaranteed accurate.