- Eastside, Sioux City properties for sale
- Leeds, Sioux City properties for sale
- Midtown, Sioux City properties for sale
- Morningside Central, Sioux City properties for sale
- Morningside North, Sioux City properties for sale
- Morningside South, Sioux City properties for sale
- Northside Central, Sioux City properties for sale
- Northside North, Sioux City properties for sale
- RIV, Sioux City properties for sale
- Sergeant Bluff, Sergeant Bluff properties for sale
- Westside Central, Sioux City properties for sale
- Westside South, Sioux City properties for sale
Peterson, IA - homes for sale
2 of 2 results displayed
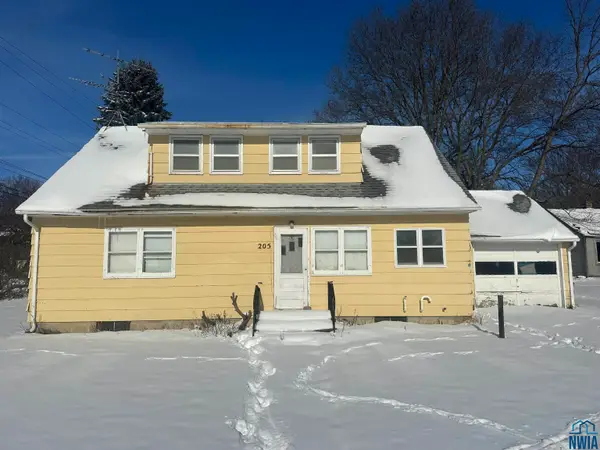 $53,000Active3 beds 2 baths1,723 sq. ft.
205 E 3rd St., Peterson, IA 51047
MLS# 831144Listed by: GUSTAFSON REALTY $79,999Active3 beds 1 baths1,248 sq. ft.
112 Pine St., Peterson, IA 51047
MLS# 251361Listed by: INTEGRITY REAL ESTATE
Local realty services provided by:CENTURY 21 ProLink
Neighborhoods near Peterson, IA
Zip codes near Peterson, IA
- 50554 properties for sale
- 50568 properties for sale
- 50588 properties for sale
- 51003 properties for sale
- 51005 properties for sale
- 51012 properties for sale
- 51025 properties for sale
- 51033 properties for sale
- 51046 properties for sale
- 51050 properties for sale
- 51201 properties for sale
- 51245 properties for sale
- 51248 properties for sale
- 51301 properties for sale
- 51331 properties for sale
- 51338 properties for sale
- 51346 properties for sale
- 51347 properties for sale
- 51351 properties for sale
- 51358 properties for sale
Popular searches near Peterson, IA
- Aurelia properties for sale
- Barnes properties for sale
- Cherokee properties for sale
- Cherokee township properties for sale
- Everly properties for sale
- Hartley properties for sale
- Hartley Township properties for sale
- Hayes properties for sale
- Lakeside properties for sale
- Linn Grove properties for sale
- Lone Tree properties for sale
- Paullina properties for sale
- Pitcher properties for sale
- Primghar properties for sale
- Riverton properties for sale
- Sanborn properties for sale
- Spencer properties for sale
- Storm Lake properties for sale
- Swan Lake properties for sale
- Union properties for sale
©2025 Century 21 Real Estate LLC. All rights reserved. CENTURY 21®, the CENTURY 21 Logo and C21® are service marks owned by Century 21 Real Estate LLC. Century 21 Real Estate LLC fully supports the principles of the Fair Housing Act and the Equal Opportunity Act. Each office is independently owned and operated. Listing information is deemed reliable but not guaranteed accurate.
©2025 Century 21 Real Estate LLC. All rights reserved. CENTURY 21®, the CENTURY 21 Logo and C21® are service marks owned by Century 21 Real Estate LLC. Century 21 Real Estate LLC fully supports the principles of the Fair Housing Act and the Equal Opportunity Act. Each office is independently owned and operated. Listing information is deemed reliable but not guaranteed accurate.