- Bowman homes for sale
- Darysaw homes for sale
- Jefferson homes for sale
- Kingsland homes for sale
- Miller homes for sale
- Niven homes for sale
- Pine Bluff homes for sale
- Plum Bayou homes for sale
- Rison homes for sale
- Rison township homes for sale
- Rowell homes for sale
- Spring homes for sale
- Star City homes for sale
- Sulphur Springs homes for sale
- Talladega homes for sale
- Vaugine homes for sale
- Washington homes for sale
- Washington homes for sale
- White Hall homes for sale
- Whiteville homes for sale
71603, AR - homes for sale
227 of 227 results displayed
- New
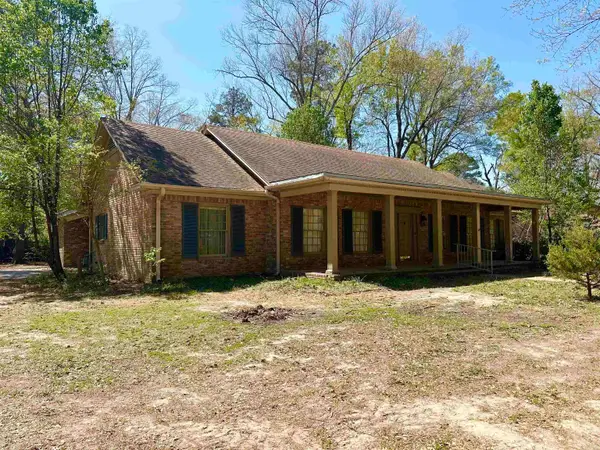
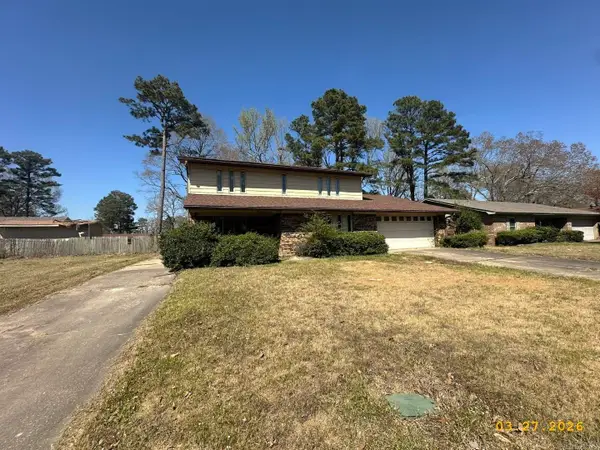 $85,000Active4 beds 3 baths2,313 sq. ft.
3111 W 36th Avenue, Pine Bluff, AR 71603
MLS# 26011915Listed by: CRYE-LEIKE REALTORS FINANCIAL CENTRE BRANCH - New
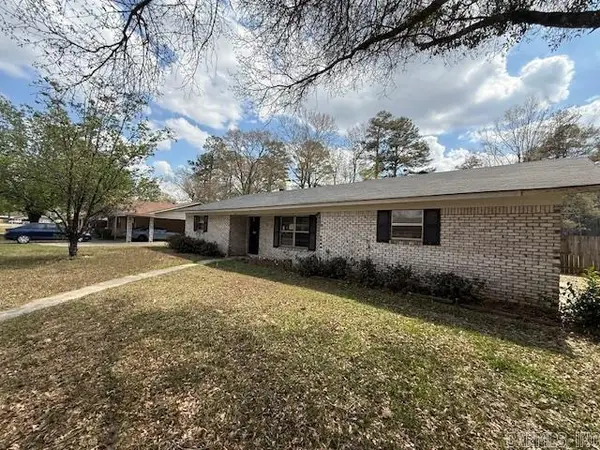
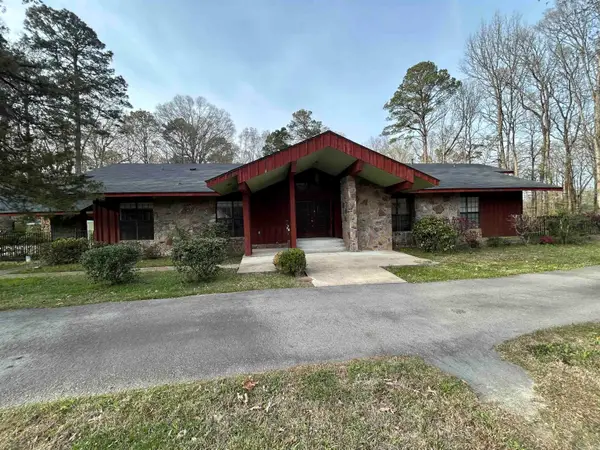
 $178,000Active3 beds 2 baths1,957 sq. ft.
5923 Davis Drive, Pine Bluff, AR 71603
MLS# 26011871Listed by: FATHOM REALTY CENTRAL - New
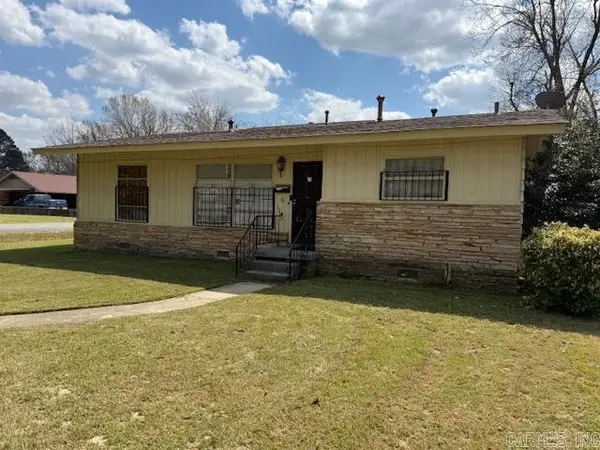
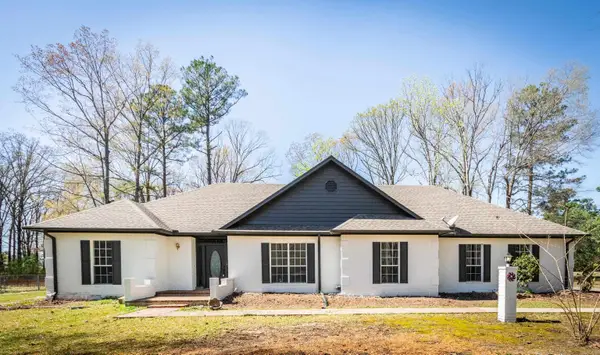
 $104,900Active3 beds 2 baths1,552 sq. ft.
4112 W 30th Avenue, Pine Bluff, AR 71603
MLS# 26011804Listed by: ACTION REALTY - New
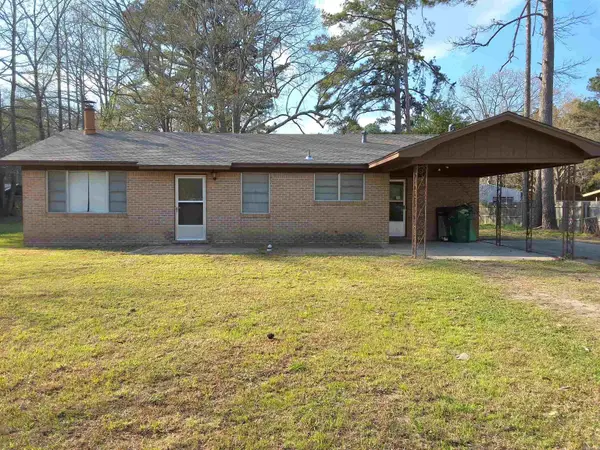
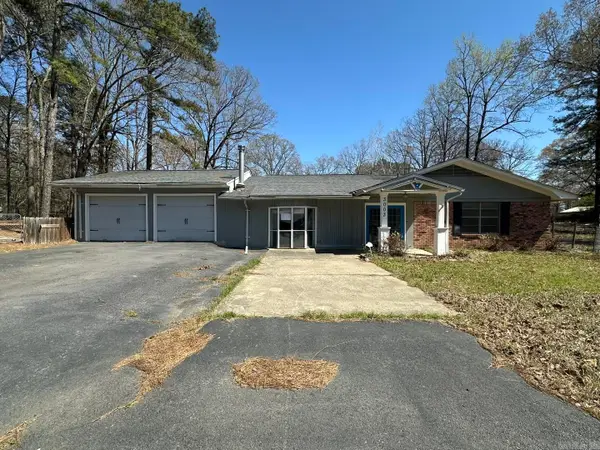
 $90,000Active4 beds 2 baths1,924 sq. ft.
1200 W 31st Avenue, Pine Bluff, AR 71603
MLS# 26011740Listed by: ACTION REALTY - New
 $110,000Active2 beds 1 baths1,239 sq. ft.
7226 Highway 79, Pine Bluff, AR 71603
MLS# 26011765Listed by: KELLER WILLIAMS REALTY - New
 $55,500Active12.01 Acres
Shannon & Oakwood, Pine Bluff, AR 71603
MLS# 26011439Listed by: LPT REALTY NLR - New
 $164,900Active3 beds 2 baths1,831 sq. ft.
3202 Kay Don Road, Pine Bluff, AR 71603
MLS# 26011339Listed by: LUNSFORD & ASSOCIATES REALTY CO. - New
 $219,500Active3 beds 2 baths1,910 sq. ft.
3114 Bugle Drive, Pine Bluff, AR 71603
MLS# 26011165Listed by: SOUTHERN HOMES REALTY - WHITE HALL - New
 $60,000Active3 beds 2 baths1,152 sq. ft.
8221 Shannon Road, Pine Bluff, AR 71603
MLS# 26011076Listed by: MCGRAW REALTORS - LITTLE ROCK - New
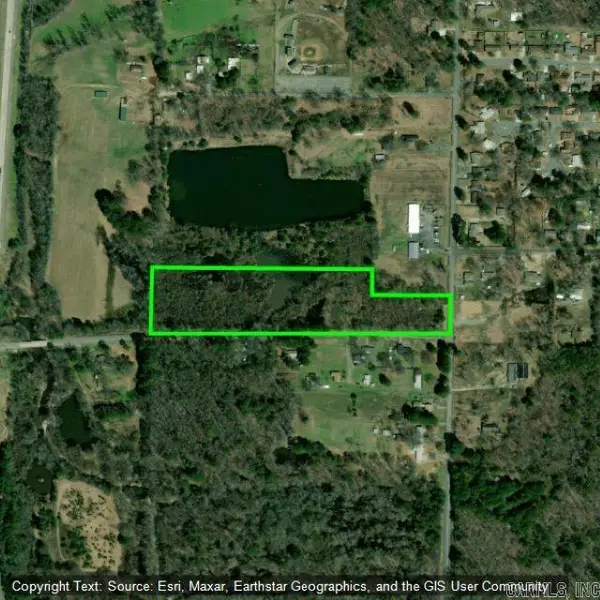
 $65,000Active8.78 Acres
000 Brown Cemetery Road, Pine Bluff, AR 71603
MLS# 26011067Listed by: LUNSFORD & ASSOCIATES REALTY CO. - New
 $209,900Active3 beds 2 baths3,460 sq. ft.
14 Jefferson Place, Pine Bluff, AR 71603
MLS# 26011062Listed by: LISA ATTWOOD REALTY - New
 $330,000Active4 beds 3 baths3,398 sq. ft.
309 Ritchwood Drive, Pine Bluff, AR 71603
MLS# 26011017Listed by: JEFFREY NEAL REALTY - New
 $350,000Active3 beds 3 baths2,543 sq. ft.
8700 Old Warren Road, Pine Bluff, AR 71603
MLS# 26010791Listed by: TRUMAN BALL REAL ESTATE - New
 $90,000Active4 beds 2 baths1,732 sq. ft.
3003 Mary Drive, Pine Bluff, AR 71603
MLS# 26010722Listed by: CRYE-LEIKE REALTORS FINANCIAL CENTRE BRANCH - New
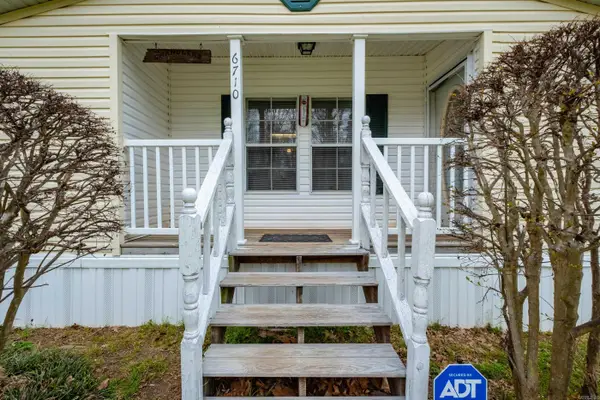 $145,000Active3 beds 2 baths1,960 sq. ft.
6700 and 6710 Forrest Oak Drive, Pine Bluff, AR 71603
MLS# 26010661Listed by: ENGEL & VOLKERS - New
 $116,000Active3 beds 2 baths1,527 sq. ft.
3106 W 36th Avenue, Pine Bluff, AR 71603
MLS# 26010562Listed by: CRYE-LEIKE REALTORS FINANCIAL CENTRE BRANCH  $138,000Active2 beds 2 baths1,921 sq. ft.
4501 S Cherry Street, Pine Bluff, AR 71603
MLS# 26010277Listed by: RE/MAX PLATINUM $305,000Active3 beds 2 baths2,407 sq. ft.
10 Southern Pines, Pine Bluff, AR 71603
MLS# 26009952Listed by: LISA ATTWOOD REALTY $235,000Active3 beds 2 baths1,991 sq. ft.
6701 Country Lane, Pine Bluff, AR 71603
MLS# 26009918Listed by: LUNSFORD & ASSOCIATES REALTY CO. $365,000Active3 beds 2 baths3,840 sq. ft.
Address Withheld By Seller, Pine Bluff, AR 71603
MLS# 26009860Listed by: MCKIEVER LAND COMPANY LLC $229,900Active3 beds 2 baths1,680 sq. ft.
4508 Payton Road, Pine Bluff, AR 71603
MLS# 26009616Listed by: SOUTHERN HOMES REALTY - WHITE HALL $850,000Active-- beds -- baths2,109 sq. ft.
3307/3309 S Palm Street, Pine Bluff, AR 71601
MLS# 26009604Listed by: HOPE & COMPANY REALTY $850,000Active-- beds -- baths2,109 sq. ft.
3311/3313 S Palm Street, Pine Bluff, AR 71601
MLS# 26009606Listed by: HOPE & COMPANY REALTY $850,000Active-- beds -- baths2,109 sq. ft.
4310/4312 W Burnett Street, Pine Bluff, AR 71601
MLS# 26009608Listed by: HOPE & COMPANY REALTY $850,000Active-- beds -- baths2,109 sq. ft.
4314/4316 W Burnett Street, Pine Bluff, AR 71601
MLS# 26009609Listed by: HOPE & COMPANY REALTY $110,000Active3 beds 2 baths1,350 sq. ft.
3805 Scenic Drive, Pine Bluff, AR 71603
MLS# 26009414Listed by: LUNSFORD & ASSOCIATES REALTY CO. $20,000Active4.25 Acres
000 Middle Warren Rd, Pine Bluff, AR 71603
MLS# 26009372Listed by: RE/MAX ENCORE $474,900Active5 beds 5 baths5,020 sq. ft.
39 Longmeadow, Pine Bluff, AR 71603
MLS# 26009110Listed by: LUNSFORD & ASSOCIATES REALTY CO. $350,000Active3 beds 3 baths2,712 sq. ft.
Address Withheld By Seller, Pine Bluff, AR 71603
MLS# 26009103Listed by: FATHOM REALTY CENTRAL $59,900Active3 beds 2 baths1,417 sq. ft.
1512 W 23rd Avenue, Pine Bluff, AR 71603
MLS# 26009066Listed by: LUNSFORD & ASSOCIATES REALTY CO. $253,000Active28.2 Acres
6824 Nevins Road, Pine Bluff, AR 71603
MLS# 26009068Listed by: PREMIER REAL ESTATE SERVICES $27,900Active6.8 Acres
6114 Kilcrease, Pine Bluff, AR 71603
MLS# 26008930Listed by: LUNSFORD & ASSOCIATES REALTY CO. $145,000Active3 beds 2 baths1,303 sq. ft.
4010 W 17th Avenue, Pine Bluff, AR 71603
MLS# 26008758Listed by: CBRPM GROUP $169,000Active4 beds 2 baths1,668 sq. ft.
3504 Shamrock, Pine Bluff, AR 71603
MLS# 26008447Listed by: LPT REALTY $110,000Active3 beds 2 baths1,848 sq. ft.
7610 Hyla Drive, Pine Bluff, AR 71603
MLS# 26008403Listed by: RE/MAX PLATINUM $11,000Active2 beds 1 baths1,401 sq. ft.
4011 W 11th, Pine Bluff, AR 71601
MLS# 26008224Listed by: BLUE COLLAR REAL ESTATE $45,000Active4.45 Acres
Address Withheld By Seller, Pine Bluff, AR 71603
MLS# 26008229Listed by: BLUE COLLAR REAL ESTATE $117,000Active3 beds 2 baths912 sq. ft.
8033 Sulphur Springs Rd., Pine Bluff, AR 71603
MLS# 26008142Listed by: LISA ATTWOOD REALTY $60,000Active3 beds 2 baths1,221 sq. ft.
1302 Boston, Pine Bluff, AR 71603
MLS# 26008124Listed by: LUNSFORD & ASSOCIATES REALTY CO. $199,900Active3 beds 3 baths2,997 sq. ft.
1605 W 35th Avenue, Pine Bluff, AR 71603
MLS# 26008110Listed by: LUNSFORD & ASSOCIATES REALTY CO. $85,000Active3 beds 2 baths1,922 sq. ft.
Address Withheld By Seller, Pine Bluff, AR 71603
MLS# 26008041Listed by: RE/MAX ENCORE $80,000Active3 beds 2 baths1,296 sq. ft.
Address Withheld By Seller, Pine Bluff, AR 71603
MLS# 26007816Listed by: RE/MAX ENCORE $139,900Active3 beds 2 baths1,377 sq. ft.
Address Withheld By Seller, Pine Bluff, AR 71603
MLS# 26007792Listed by: MILES-NEWSOME & ASSOCIATES REALTY, INC. $115,000Active55 Acres
9543 Huntley Trl, Pine Bluff, AR 71603
MLS# 26007804Listed by: LISA ATTWOOD REALTY $179,000Active3 beds 2 baths2,015 sq. ft.
3904 Royal Forest Drive, Pine Bluff, AR 71603
MLS# 26007767Listed by: MILES-NEWSOME & ASSOCIATES REALTY, INC. $124,900Active4 beds 3 baths3,425 sq. ft.
2403 W 40th Ave, Pine Bluff, AR 71603
MLS# 26007611Listed by: EXP REALTY $115,000Active3 beds 2 baths1,480 sq. ft.
5709 Sulphur Springs Rd., Pine Bluff, AR 71603
MLS# 26007414Listed by: LISA ATTWOOD REALTY $299,000Active3 beds 2 baths1,280 sq. ft.
9607 9603 Huntley Trail, Pine Bluff, AR 71603
MLS# 26007207Listed by: LISA ATTWOOD REALTY $39,000Active2 beds 2 baths1,316 sq. ft.
1700 & 1702 W 15th Avenue, Pine Bluff, AR 71603
MLS# 26007231Listed by: ACTION REALTY $57,500Active3 beds 1 baths1,437 sq. ft.
202 W 27, Pine Bluff, AR 71603
MLS# 26006936Listed by: SOUTHERN HOMES REALTY - WHITE HALL $70,000Active2 beds 1 baths850 sq. ft.
3100 Jonquil Street, Pine Bluff, AR 71603
MLS# 26006765Listed by: RE/MAX PLATINUM $174,900Active4 beds 3 baths2,192 sq. ft.
2105 Monticello Court, Pine Bluff, AR 71603
MLS# 26006410Listed by: MID SOUTH REALTY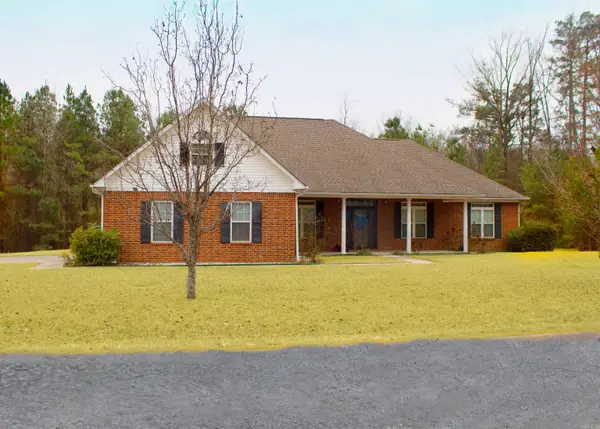 $350,000Active3 beds 3 baths2,554 sq. ft.
210 Sherry Lane, Pine Bluff, AR 71603
MLS# 26006175Listed by: BROKERS GUILD REAL ESTATE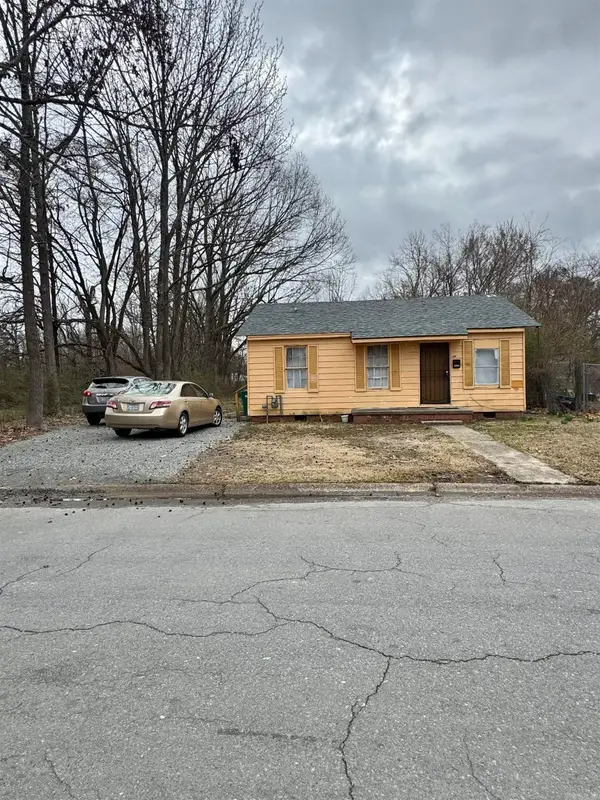 $39,500Active3 beds 1 baths1,209 sq. ft.
1815 E Circle Drive, Pine Bluff, AR 71603
MLS# 26006169Listed by: LISA ATTWOOD REALTY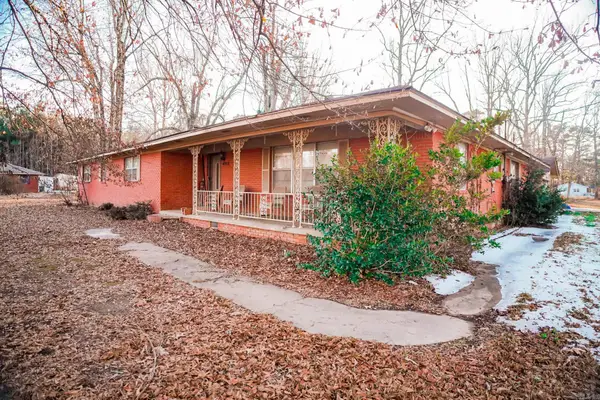 $205,000Active4 beds 3 baths2,992 sq. ft.
4202 Ryburn Road, Pine Bluff, AR 71603
MLS# 26006044Listed by: LPT REALTY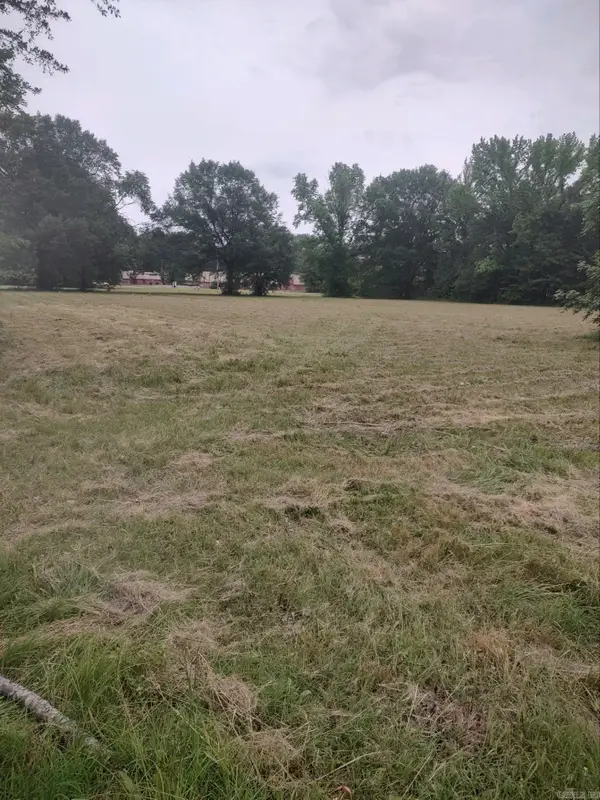 $45,000Active4 Acres
9999 W 34, Pine Bluff, AR 71603
MLS# 26006053Listed by: LUNSFORD & ASSOCIATES REALTY CO. $234,500Active4 beds 2 baths2,160 sq. ft.
6 Cromwell Cove, Pine Bluff, AR 71603
MLS# 26006023Listed by: LISA ATTWOOD REALTY $65,000Active3 beds 1 baths1,026 sq. ft.
3203 Orchid Drive, Pine Bluff, AR 71603
MLS# 26005735Listed by: THE PROPERTY SHOP OF AR, INC. $75,000Active3 beds 2 baths1,134 sq. ft.
5309 Leawood, Pine Bluff, AR 71603
MLS# 26005732Listed by: THE PROPERTY SHOP OF AR, INC. $176,000Active48.93 Acres
Lot 48 Highway 79 S, Pine Bluff, AR 71603
MLS# 26005491Listed by: LPT REALTY SALINE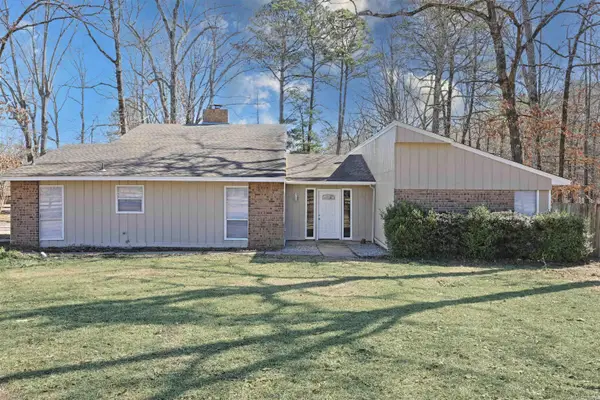 $264,000Active3 beds 2 baths2,072 sq. ft.
6601 Twin Oaks, Pine Bluff, AR 71603
MLS# 26005611Listed by: LUNSFORD & ASSOCIATES REALTY CO.- $240,000Active4 beds 3 baths2,460 sq. ft.
8128 Cross Road, Pine Bluff, AR 71603
MLS# 26005446Listed by: LUNSFORD & ASSOCIATES REALTY CO. 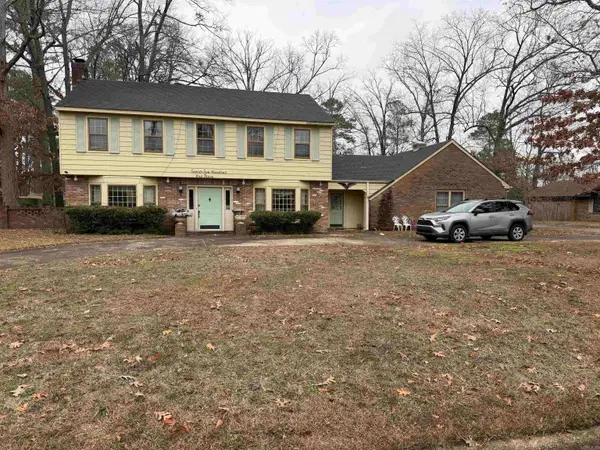 $262,020Active5 beds 4 baths2,766 sq. ft.
2203 Cherry Ridge, Pine Bluff, AR 71603
MLS# 26005243Listed by: LISA ATTWOOD REALTY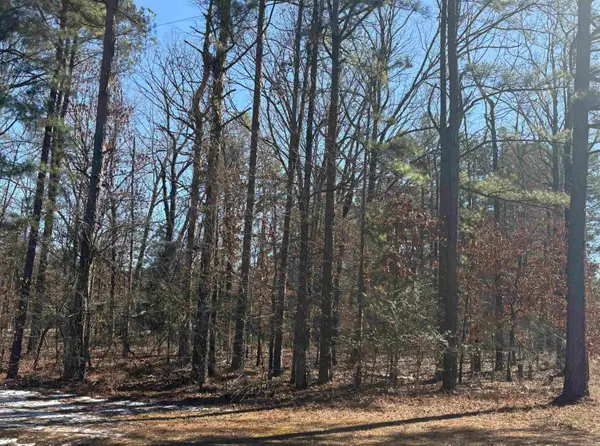 $26,500Active5 Acres
0 Kilcrease Road, Pine Bluff, AR 71603
MLS# 26005190Listed by: JENICA CLEMENT PROPERTIES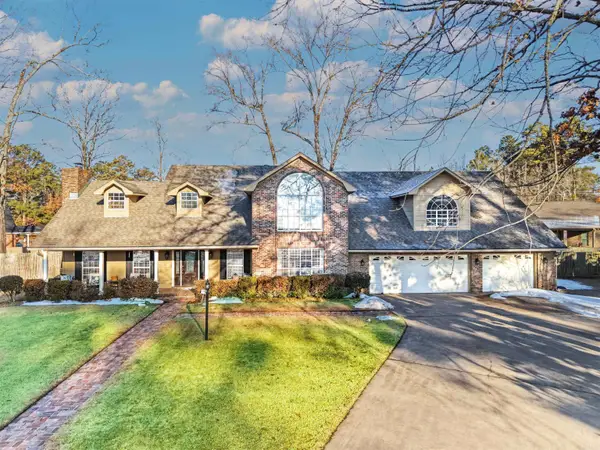 $399,900Active5 beds 5 baths3,687 sq. ft.
5 Par Lane, Pine Bluff, AR 71603
MLS# 26005111Listed by: SOUTHERN HOMES REALTY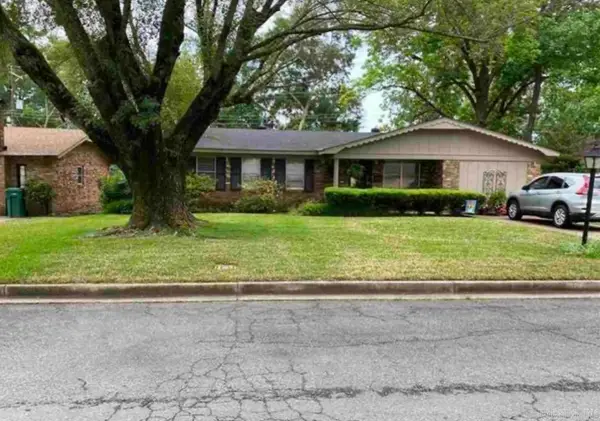 $125,000Active4 beds 2 baths1,549 sq. ft.
1404 Arrowhead Place, Pine Bluff, AR 71603
MLS# 26004993Listed by: JEFFREY NEAL REALTY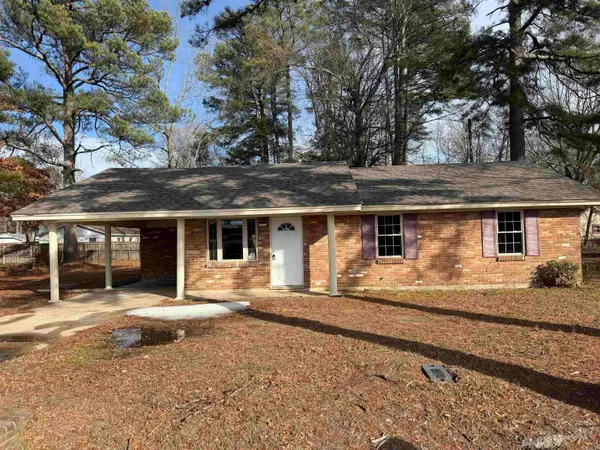 $139,000Active3 beds 2 baths1,239 sq. ft.
3119 S Catalpa, Pine Bluff, AR 71603
MLS# 26004918Listed by: LISA ATTWOOD REALTY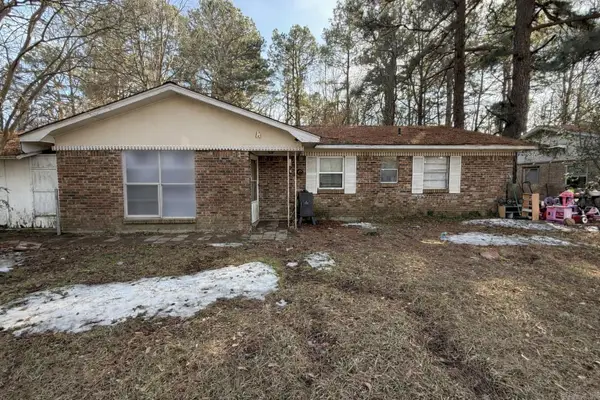 $75,000Active4 beds 2 baths1,224 sq. ft.
Address Withheld By Seller, Pine Bluff, AR 71603
MLS# 26004730Listed by: RE/MAX ENCORE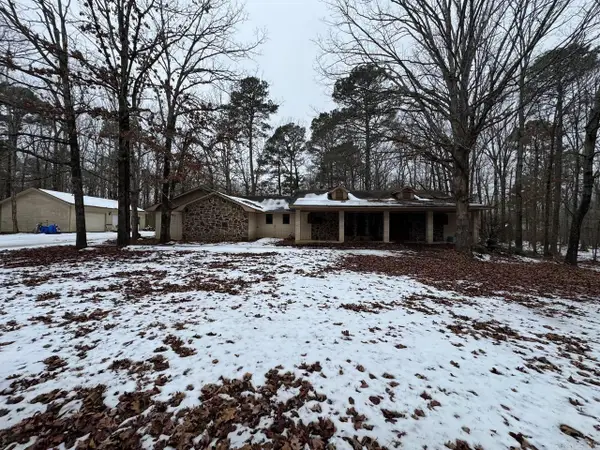 $89,900Active3 beds 2 baths1,847 sq. ft.
6408 Country Lane, Pine Bluff, AR 71603
MLS# 26004565Listed by: RE/MAX ENCORE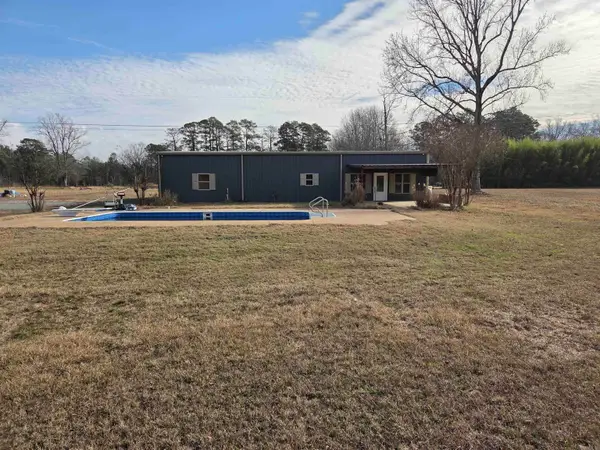 $299,000Active2 beds 2 baths2,580 sq. ft.
Address Withheld By Seller, Pine Bluff, AR 71603
MLS# 26004180Listed by: MCKIMMEY ASSOCIATES REALTORS NLR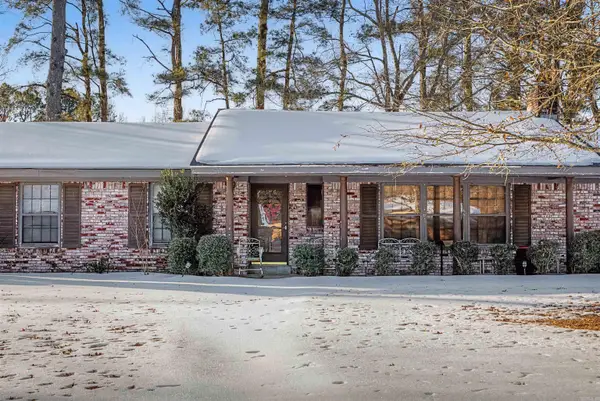 $139,500Active3 beds 2 baths1,642 sq. ft.
4410 Town Country Ln., Pine Bluff, AR 71603
MLS# 26004056Listed by: BLUE INK REAL ESTATE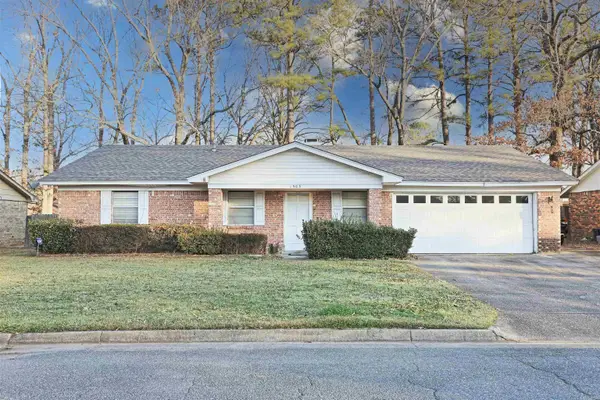 $164,000Active3 beds 2 baths1,642 sq. ft.
1503 Silver Fox, Pine Bluff, AR 71603
MLS# 26003962Listed by: LUNSFORD & ASSOCIATES REALTY CO. $184,750Active2 beds 2 baths2,328 sq. ft.
14 Westridge, Pine Bluff, AR 71603
MLS# 26003649Listed by: LUNSFORD & ASSOCIATES REALTY CO. $127,900Active3 beds 2 baths1,464 sq. ft.
4317 Garland Court, Pine Bluff, AR 71603
MLS# 26003647Listed by: NASH REALTY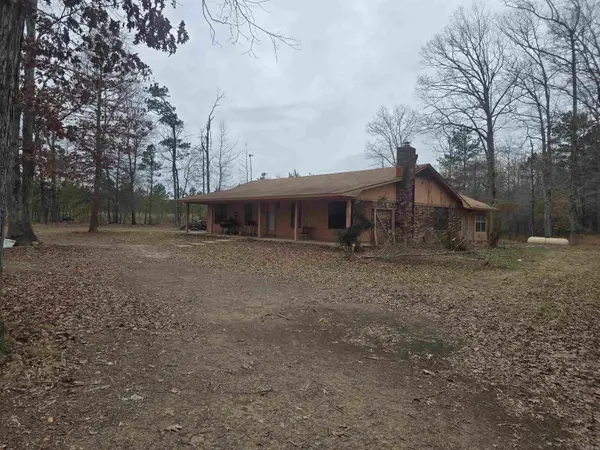 $160,000Active3 beds 2 baths1,705 sq. ft.
5900 Ramick Road, Pine Bluff, AR 71603
MLS# 26003607Listed by: RE/MAX PLATINUM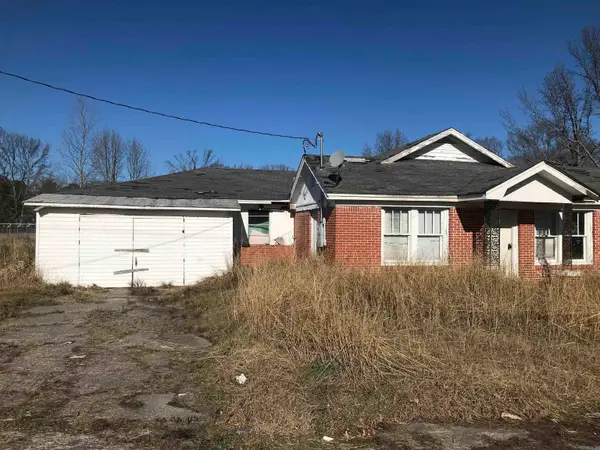 $30,000Active2 beds 1 baths1,704 sq. ft.
2412 S Camden Road, Pine Bluff, AR 71603
MLS# 26003081Listed by: HARRIS & HARRIS REALTY GROUP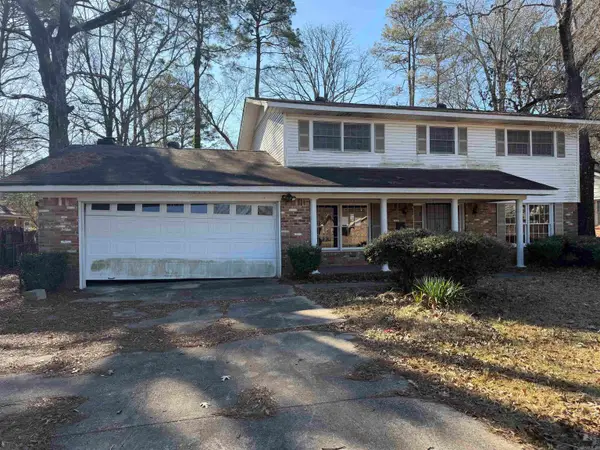 $85,000Active3 beds 3 baths2,483 sq. ft.
600 W 34th Ave, Pine Bluff, AR 71603
MLS# 26003010Listed by: RE/MAX ENCORE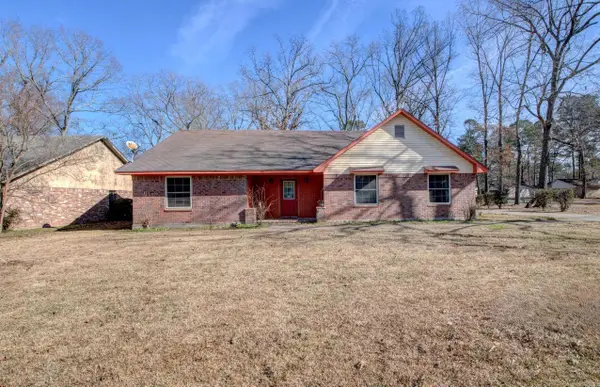 $180,000Active3 beds 2 baths2,146 sq. ft.
6009 S Cedar Street, Pine Bluff, AR 71603
MLS# 26002971Listed by: KELLER WILLIAMS REALTY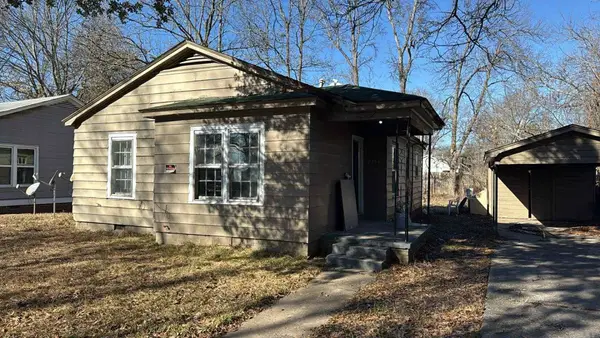 $25,000Active2 beds 1 baths866 sq. ft.
2305 W 25th Avenue, Pine Bluff, AR 71603
MLS# 26002845Listed by: RE/MAX PLATINUM $17,000Active3 beds 1 baths1,176 sq. ft.
1501 W 28th Avenue, Pine Bluff, AR 71603
MLS# 26002832Listed by: RE/MAX PLATINUM $16,000Active3 beds 1 baths1,071 sq. ft.
1604 W 30th Avenue, Pine Bluff, AR 71603
MLS# 26002835Listed by: RE/MAX PLATINUM $23,000Active2 beds 1 baths1,326 sq. ft.
1700 W 25th Street, Pine Bluff, AR 71603
MLS# 26002651Listed by: MCKIMMEY ASSOCIATES REALTORS NLR $245,000Active3 beds 2 baths2,629 sq. ft.
3 Hampton Place, Pine Bluff, AR 71603
MLS# 26002404Listed by: LUNSFORD & ASSOCIATES REALTY CO.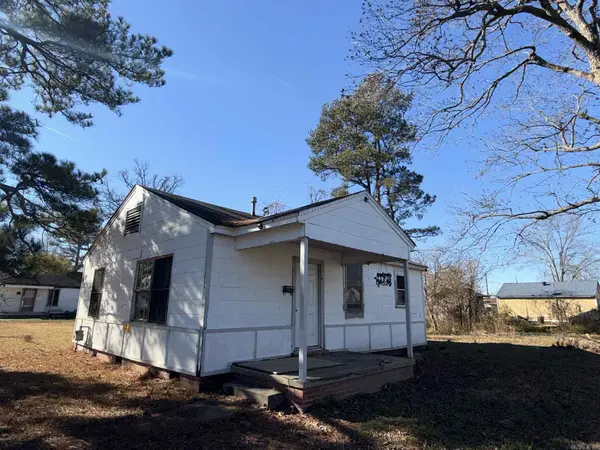 $14,000Active2 beds 1 baths810 sq. ft.
1734 E Circle Drive, Pine Bluff, AR 71603
MLS# 26002412Listed by: RE/MAX PLATINUM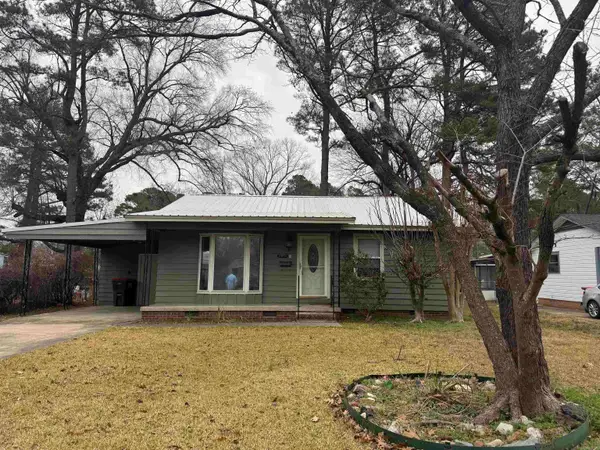 $89,900Active3 beds 1 baths974 sq. ft.
2813 S Orlando, Pine Bluff, AR 71602
MLS# 26002207Listed by: BLUE INK REAL ESTATE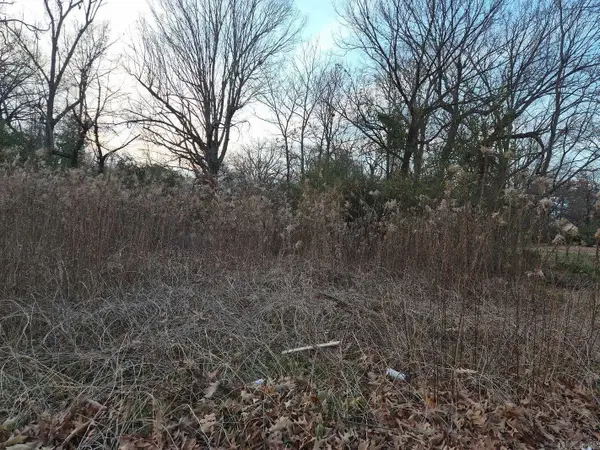 $2,999Active0.18 Acres
Address Withheld By Seller, Pine Bluff, AR 71603
MLS# 26002201Listed by: REALTY SOLUTION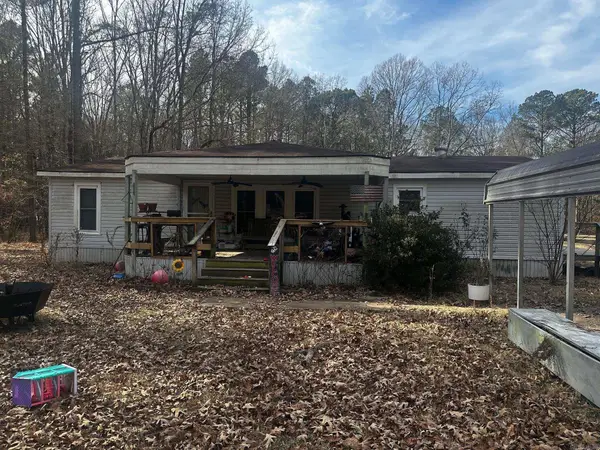 $106,900Active3 beds 2 baths1,568 sq. ft.
3908 Big Creek Rd, Pine Bluff, AR 71603
MLS# 26002152Listed by: IHP REAL ESTATE $199,000Active3 beds 2 baths2,541 sq. ft.
1300 W 28th Avenue, Pine Bluff, AR 71603
MLS# 26001879Listed by: RE/MAX ENCORE $58,000Active3 beds 1 baths1,056 sq. ft.
4406 W 16th Avenue, Pine Bluff, AR 71603
MLS# 26001884Listed by: RE/MAX ENCORE $53,000Active3 beds 1 baths1,460 sq. ft.
800 W 34th Ave, Pine Bluff, AR 71603
MLS# 26001821Listed by: REALHOME SERVICES AND SOLUTIONS, INC. $39,000Active3 beds 2 baths1,280 sq. ft.
6113 Kilcrease, Pine Bluff, AR 71603
MLS# 26001803Listed by: LUNSFORD & ASSOCIATES REALTY CO.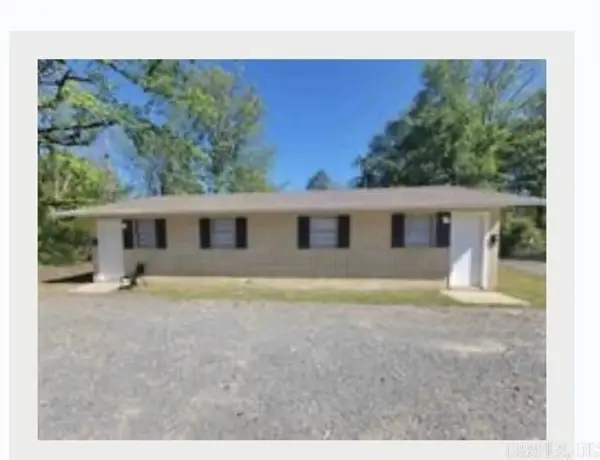 $92,500Active-- beds -- baths882 sq. ft.
Address Withheld By Seller, Pine Bluff, AR 71603
MLS# 26001669Listed by: MILES-NEWSOME & ASSOCIATES REALTY, INC. $87,000Active3 beds 1 baths1,195 sq. ft.
1501 W 33rd, Pine Bluff, AR 71603
MLS# 26001349Listed by: LUNSFORD & ASSOCIATES REALTY CO. $149,900Active4 beds 2 baths2,524 sq. ft.
3703 Petty Rd, Pine Bluff, AR 71602
MLS# 26001168Listed by: BLUE INK REAL ESTATE $124,900Active3 beds 2 baths1,362 sq. ft.
1602 W 36th, Pine Bluff, AR 71603
MLS# 26001169Listed by: BLUE INK REAL ESTATE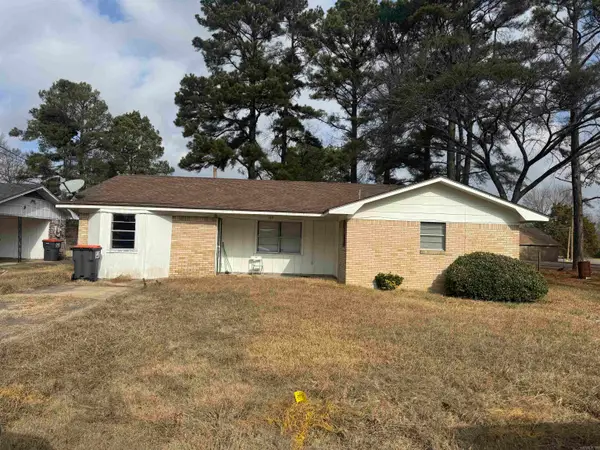 $99,500Active3 beds 2 baths1,520 sq. ft.
105 W 37th, Pine Bluff, AR 71603
MLS# 26001172Listed by: BLUE INK REAL ESTATE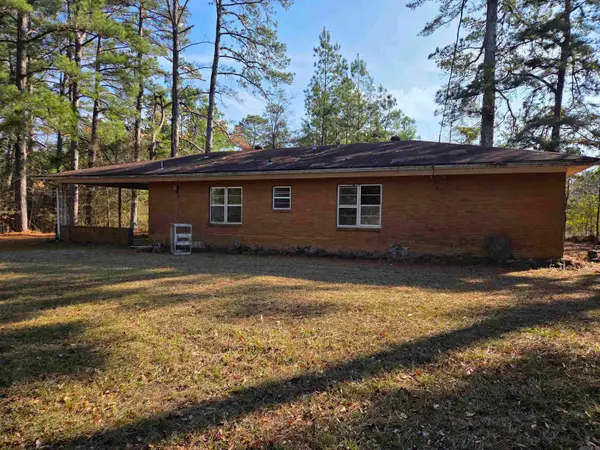 $253,000Active3 beds 2 baths1,708 sq. ft.
6824 Nevins Road, Pine Bluff, AR 71603
MLS# 26001121Listed by: PREMIER REAL ESTATE SERVICES $395,000Active3 beds 3 baths3,166 sq. ft.
9201 Old Warren Road, Pine Bluff, AR 71603
MLS# 26001122Listed by: RE/MAX PLATINUM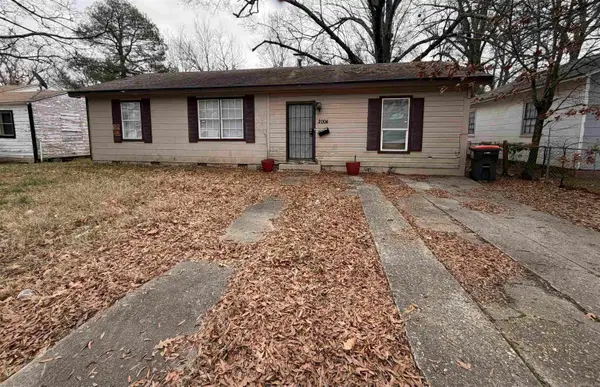 $62,000Active3 beds 2 baths1,911 sq. ft.
Address Withheld By Seller, Pine Bluff, AR 71603
MLS# 26000800Listed by: PLUSH HOMES CO. REALTORS $245,000Active3 beds 2 baths2,347 sq. ft.
5903 Hampton Parkway, Pine Bluff, AR 71603
MLS# 26000640Listed by: LISA ATTWOOD REALTY $159,900Active3 beds 2 baths1,956 sq. ft.
3609 Old Warren Road, Pine Bluff, AR 71603
MLS# 26000298Listed by: LUNSFORD & ASSOCIATES REALTY CO. $150,000Active3 beds 2 baths1,620 sq. ft.
5207 Straughn, Pine Bluff, AR 71603
MLS# 25050279Listed by: REALTY ONE GROUP LOCK AND KEY $119,000Active3 beds 2 baths1,645 sq. ft.
1501 Blackhawk Ridge Lane, Pine Bluff, AR 71603
MLS# 25050174Listed by: RE/MAX PLATINUM $11,200Active0.33 Acres
4208 W 10th, Pine Bluff, AR 71603
MLS# 25050052Listed by: IREALTY ARKANSAS - SHERWOOD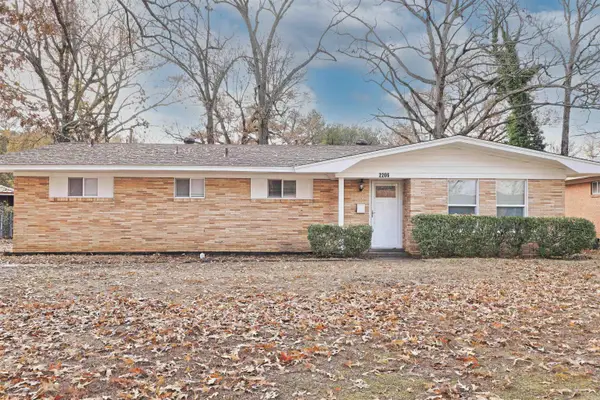 $184,900Active3 beds 2 baths1,870 sq. ft.
2206 W 36, Pine Bluff, AR 71603
MLS# 25049891Listed by: LUNSFORD & ASSOCIATES REALTY CO. $45,000Active3 beds 1 baths1,185 sq. ft.
2213 S Maple, Pine Bluff, AR 71603
MLS# 25049690Listed by: ALLURIN EXSON STEVENSON REAL ESTATE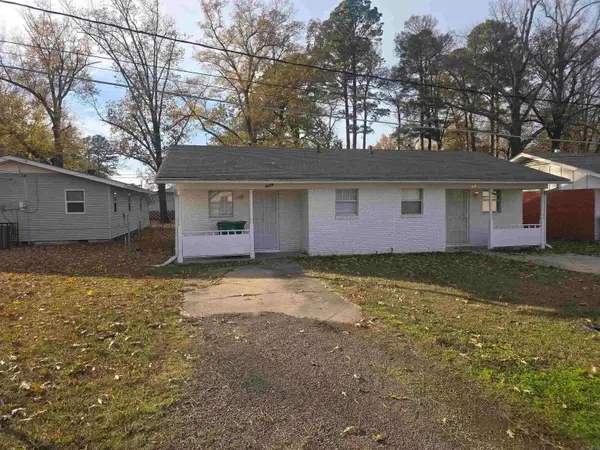 $80,000Active4 beds 2 baths1,114 sq. ft.
3016 S Gum Street, Pine Bluff, AR 71603
MLS# 25049553Listed by: RE/MAX PLATINUM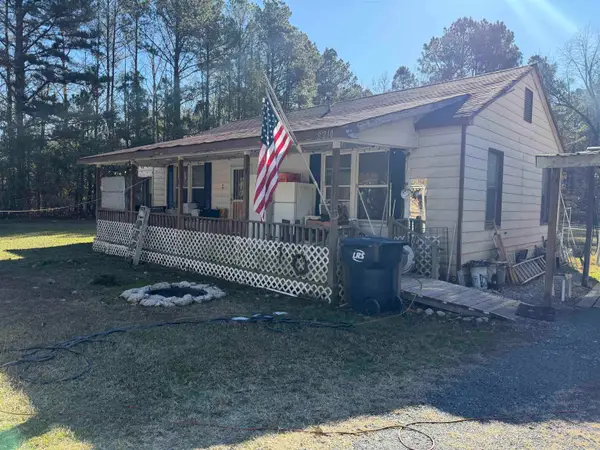 $42,500Active3 beds 1 baths1,088 sq. ft.
9210 Henderson Road, Pine Bluff, AR 71603
MLS# 25049464Listed by: LISA ATTWOOD REALTY $15,500Active0.18 Acres
2001 W 16th Avenue, Pine Bluff, AR 71603
MLS# 1330965Listed by: REMAX REAL ESTATE RESULTS $70,000Active4 beds 1 baths1,456 sq. ft.
2315 Oakwood Road, Pine Bluff, AR 71603
MLS# 25048598Listed by: IREALTY ARKANSAS - SHERWOOD $88,000Active3 beds 2 baths1,900 sq. ft.
2605 W 37th Avenue, Pine Bluff, AR 71603
MLS# 25048465Listed by: CRYE-LEIKE REALTORS FINANCIAL CENTRE BRANCH $122,500Active3 beds 2 baths1,482 sq. ft.
1916 Sunset Cove, Pine Bluff, AR 71603
MLS# 25048058Listed by: IREALTY ARKANSAS - SHERIDAN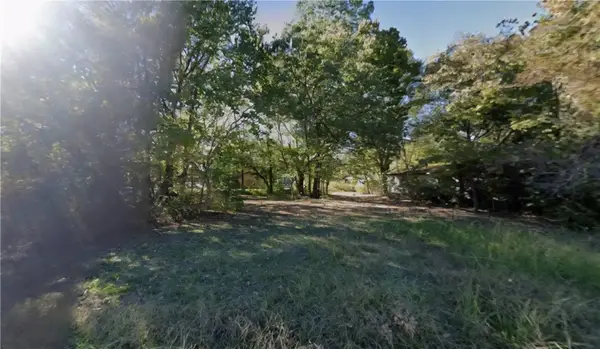 $8,950Active0.3 Acres
Lot 002 W 13th Avenue, Pine Bluff, AR 71603
MLS# 1330106Listed by: REMAX REAL ESTATE RESULTS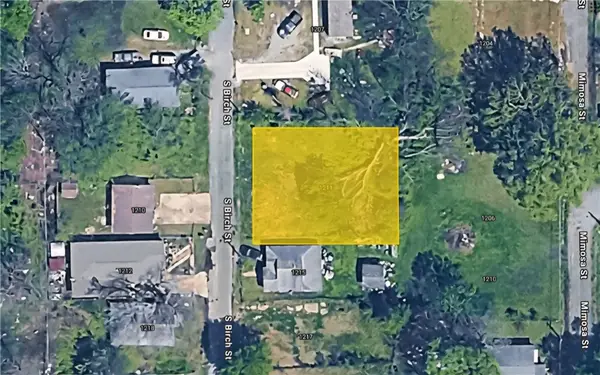 $7,500Active0.18 Acres
1211 S Birch Street, Pine Bluff, AR 71603
MLS# 1330087Listed by: REMAX REAL ESTATE RESULTS $384,900Active4 beds 4 baths2,733 sq. ft.
1002 W 73rd, Pine Bluff, AR 71603
MLS# 25047857Listed by: BLUE INK REAL ESTATE $130,000Active2 beds 2 baths1,950 sq. ft.
6 Summerset Place, Pine Bluff, AR 71603
MLS# 25047871Listed by: RE/MAX PLATINUM $65,000Active3 beds 1 baths1,148 sq. ft.
3501 W 15th, Pine Bluff, AR 71603
MLS# 25047684Listed by: BLUE INK REAL ESTATE $290,000Active4 beds 4 baths4,143 sq. ft.
4703 S Beech, Pine Bluff, AR 71603
MLS# 25047375Listed by: JEFFREY NEAL REALTY $65,000Active3 beds 2 baths1,368 sq. ft.
3202 Tulip Street, Pine Bluff, AR 71603
MLS# 25046926Listed by: RE/MAX PLATINUM $47,000Active3 beds 2 baths1,340 sq. ft.
2212 S Maple Street, Pine Bluff, AR 71603
MLS# 25046931Listed by: RE/MAX PLATINUM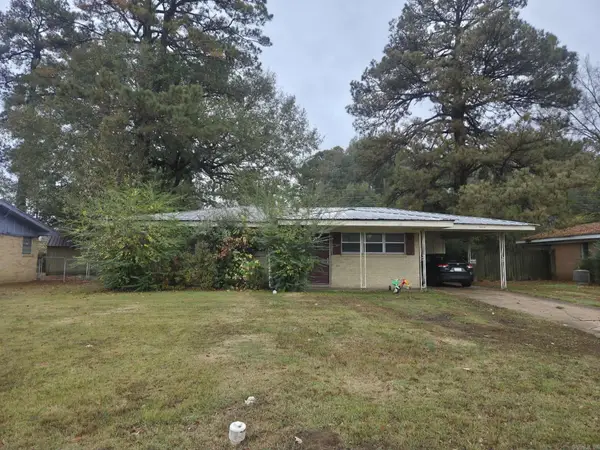 $55,000Active3 beds 1 baths1,026 sq. ft.
3404 Violet Drive, Pine Bluff, AR 71603
MLS# 25046915Listed by: RE/MAX PLATINUM $56,000Active4 beds 1 baths1,280 sq. ft.
3305 Daffodil Street, Pine Bluff, AR 71603
MLS# 25046918Listed by: RE/MAX PLATINUM $6,500Active1 Acres
10 Old Warren Road, Pine Bluff, AR 71603
MLS# 25046506Listed by: LISTWITHFREEDOM.COM, INC. $114,900Active3 beds 1 baths1,162 sq. ft.
5012 Faucett, Pine Bluff, AR 71603
MLS# 25046323Listed by: LUNSFORD & ASSOCIATES REALTY CO.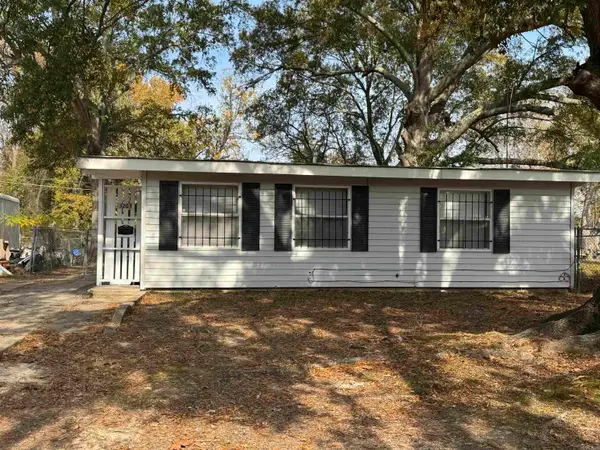 $40,500Active2 beds 1 baths780 sq. ft.
Address Withheld By Seller, Pine Bluff, AR 71603
MLS# 25046317Listed by: LUX REAL ESTATE GROUP $449,900Active116.37 Acres
Address Withheld By Seller, Pine Bluff, AR 71603
MLS# 25046060Listed by: WHITETAIL PROPERTIES REAL ESTATE, LLC $425,000Active50 Acres
Address Withheld By Seller, Pine Bluff, AR 71603
MLS# 25046068Listed by: WHITETAIL PROPERTIES REAL ESTATE, LLC $290,000Active3 beds 3 baths3,220 sq. ft.
12 Elmwood Circle, Pine Bluff, AR 71603
MLS# 25045808Listed by: PREMIER REAL ESTATE SERVICES $27,000Active5 Acres
10365 Alexander Road, Pine Bluff, AR 71603
MLS# 25045799Listed by: LISTWITHFREEDOM.COM, INC. $15,000Active0.78 Acres
0000 Hampton Parkway, Pine Bluff, AR 71603
MLS# 25045687Listed by: BROKERS GUILD REAL ESTATE $55,000Active3 beds 1 baths950 sq. ft.
2706 Patricia Street, Pine Bluff, AR 71603
MLS# 25045446Listed by: RE/MAX PLATINUM $60,000Active3 beds 2 baths1,256 sq. ft.
3108 Tulip Street, Pine Bluff, AR 71603
MLS# 25045460Listed by: RE/MAX PLATINUM $129,500Active3 beds 2 baths1,448 sq. ft.
4008 S Holly, Pine Bluff, AR 71603
MLS# 25045367Listed by: LISA ATTWOOD REALTY $114,800Active3 beds 3 baths1,646 sq. ft.
507 Greenbriar Drive, Pine Bluff, AR 71603
MLS# 25045347Listed by: BROKERS GUILD REAL ESTATE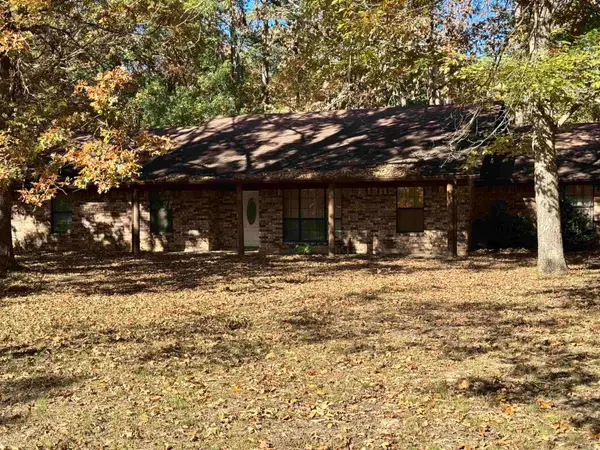 $130,000Active4 beds 2 baths2,352 sq. ft.
8601 Dolphin Cove, Pine Bluff, AR 71603
MLS# 25045081Listed by: KELLER WILLIAMS REALTY $45,000Active2 beds 1 baths1,075 sq. ft.
2503 S Linden St, Pine Bluff, AR 71603
MLS# 25044848Listed by: RE/MAX PLATINUM $43,000Active3 beds 1 baths1,267 sq. ft.
1906 Edmar Drive, Pine Bluff, AR 71603
MLS# 25044738Listed by: SOUTHERN HOMES REALTY - WHITE HALL $80,000Active-- beds -- baths1,994 sq. ft.
2507 S Linden Street, Pine Bluff, AR 71603
MLS# 25044717Listed by: RE/MAX PLATINUM $55,000Active3 beds 1 baths1,036 sq. ft.
3307 Orchid Drive, Pine Bluff, AR 71603
MLS# 25044723Listed by: RE/MAX PLATINUM $55,000Active3 beds 1 baths967 sq. ft.
3200 Daffodil Street, Pine Bluff, AR 71603
MLS# 25044695Listed by: RE/MAX PLATINUM $72,000Active3 beds 2 baths1,538 sq. ft.
3205 Daffodil Street, Pine Bluff, AR 71603
MLS# 25044670Listed by: RE/MAX PLATINUM $189,000Active3 beds 2 baths2,040 sq. ft.
4510 W 30th, Pine Bluff, AR 71603
MLS# 25044338Listed by: LISA ATTWOOD REALTY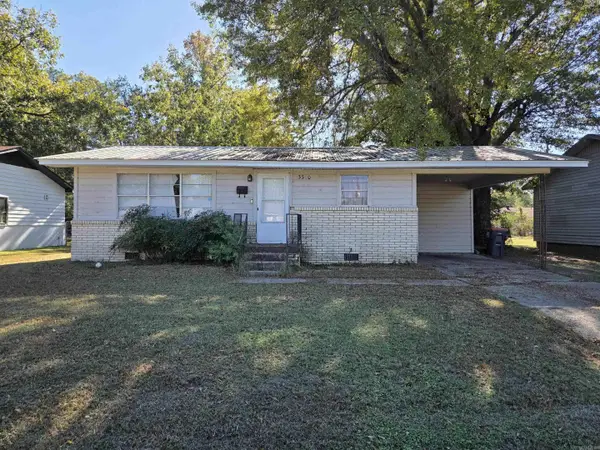 $55,000Active3 beds 1 baths1,216 sq. ft.
3300 Daffodil Street, Pine Bluff, AR 71603
MLS# 25044341Listed by: RE/MAX PLATINUM $60,000Active3 beds 1 baths1,168 sq. ft.
3205 Tulip Street, Pine Bluff, AR 71603
MLS# 25043417Listed by: RE/MAX PLATINUM $60,000Active3 beds 1 baths1,040 sq. ft.
2107 Howard Drive, Pine Bluff, AR 71603
MLS# 25043422Listed by: RE/MAX PLATINUM $79,900Active3 beds 2 baths1,728 sq. ft.
Address Withheld By Seller, Pine Bluff, AR 71603
MLS# 25043050Listed by: RE/MAX PLATINUM $60,000Active3 beds 1 baths779 sq. ft.
2002 W 29th Avenue, Pine Bluff, AR 71603
MLS# 25042904Listed by: RE/MAX PLATINUM $169,950Active4 beds 3 baths2,625 sq. ft.
7728 Gaddy Koonce Road, Pine Bluff, AR 71603
MLS# 25042653Listed by: TRAMMELL & COMPANY REAL ESTATE $4,950Active0.11 Acres
3007 W 15th Avenue, Pine Bluff, AR 71601
MLS# 1326362Listed by: REMAX REAL ESTATE RESULTS $265,000Active3 beds 4 baths3,492 sq. ft.
13 Jefferson Place, Pine Bluff, AR 71603
MLS# 25042212Listed by: LUNSFORD & ASSOCIATES REALTY CO. $145,000Active3 beds 2 baths1,326 sq. ft.
Address Withheld By Seller, Pine Bluff, AR 71603
MLS# 25042007Listed by: KELLER WILLIAMS REALTY $19,500Active3 Acres
8911 Pine Meadow Dr., Sulphur Springs, AR 72603
MLS# 25041319Listed by: HABITAT LAND COMPANY- $15,000Active0 Acres
2403 Beau Monde Street, Pine Bluff, AR 71603
MLS# 25041264Listed by: MERRITT REALTY GROUP  $60,000Active3 beds 2 baths1,476 sq. ft.
2607 W 26th Ave., Pine Bluff, AR 71603
MLS# 25040881Listed by: REAL ESTATE CENTRAL $52,500Active8.44 Acres
00 Sulphur Springs Road, Pine Bluff, AR 71603
MLS# 25038767Listed by: LUNSFORD & ASSOCIATES REALTY CO. $2,500Active0.12 Acres
1606 W 30th, Pine Bluff, AR 71603
MLS# 25040382Listed by: LUNSFORD & ASSOCIATES REALTY CO. $18,900Active2 Acres
00 Oakwood Rd, Pine Bluff, AR 71603
MLS# 25039542Listed by: BLUE COLLAR REAL ESTATE $30,000Active3.08 Acres
7214 Jericho Road, Pine Bluff, AR 71603
MLS# 25039077Listed by: CAPITAL REAL ESTATE ADVISORS $320,000Active4 beds 4 baths2,752 sq. ft.
8611 Sulphur Springs, Pine Bluff, AR 71603
MLS# 25038809Listed by: LISA ATTWOOD REALTY $372,500Active-- beds -- baths7,630 sq. ft.
1020 S Linden, Pine Bluff, AR 71611
MLS# 25038273Listed by: FAITH REALTY & ASSOCIATES $150,000Active-- beds -- baths3,306 sq. ft.
Address Withheld By Seller, Pine Bluff, AR 71611
MLS# 25038274Listed by: FAITH REALTY & ASSOCIATES $199,900Active3 beds 2 baths2,536 sq. ft.
14160 W Hwy 54, Pine Bluff, AR 71603
MLS# 25038092Listed by: SOUTHERN HOMES REALTY - WHITE HALL $55,000Active3 beds 2 baths1,816 sq. ft.
2219 W 34th, Pine Bluff, AR 71603
MLS# 25038070Listed by: LISA ATTWOOD REALTY $40,000Active4 Acres
000 Crownwood Dr, Pine Bluff, AR 71603
MLS# 25037034Listed by: CBRPM MAUMELLE $359,000Active3 beds 3 baths3,145 sq. ft.
1206 W 46th, Pine Bluff, AR 71603
MLS# 25036462Listed by: RE/MAX PLATINUM $175,000Active15 Acres
7603 Sorrells Rd, Pine Bluff, AR 71603
MLS# 25036024Listed by: CBRPM MAUMELLE $254,900Active4 beds 2 baths2,276 sq. ft.
8930 Dyson Road, Pine Bluff, AR 71603
MLS# 25035297Listed by: RE/MAX PLATINUM $20,000Active1 Acres
2205 Foxborough Cove, Pine Bluff, AR 71603
MLS# 25034191Listed by: NASH REALTY $192,400Active3 beds 2 baths1,767 sq. ft.
4800 Goodfaith Road, Pine Bluff, AR 71603
MLS# 25033988Listed by: LISA ATTWOOD REALTY $89,999Active3 beds 2 baths1,326 sq. ft.
1508 Red Oak Ln., Pine Bluff, AR 71603
MLS# 26005920Listed by: JENICA CLEMENT PROPERTIES
 $102,000Active4 beds 2 baths1,645 sq. ft.
6600 S Mulberry Street, Pine Bluff, AR 71603
MLS# 25030895Listed by: CENTURY 21 PARKER & SCROGGINS REALTY - CONWAY $50,550Active3 beds 1 baths1,335 sq. ft.
12350 Princeton Pike, White Hall, AR 71602
MLS# 25030771Listed by: CRYE-LEIKE REALTORS FINANCIAL CENTRE BRANCH $55,000Active4 beds 1 baths1,333 sq. ft.
2401 Howard Drive, Pine Bluff, AR 71603
MLS# 25042905Listed by: RE/MAX PLATINUM $189,900Active4 beds 2 baths2,024 sq. ft.
7609 N Pinewood, Pine Bluff, AR 71603
MLS# 25029606Listed by: LUNSFORD & ASSOCIATES REALTY CO. $390,000Active-- beds -- baths14,488 sq. ft.
1100 W 18th Avenue, Pine Bluff, AR 71601
MLS# 25029323Listed by: FAITH REALTY & ASSOCIATES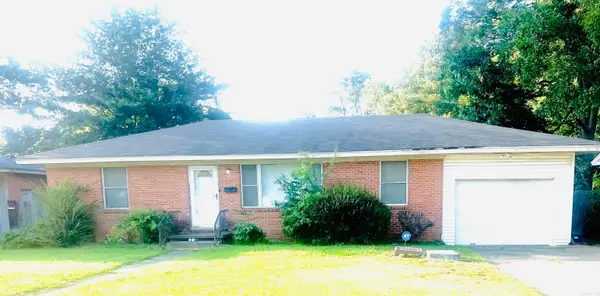 $65,500Active3 beds 1 baths1,204 sq. ft.
1405 W 23rd Street, Pine Bluff, AR 71603
MLS# 25029177Listed by: PLUSH HOMES CO. REALTORS $395,000Active4 beds 3 baths3,991 sq. ft.
1 Hillcroft St, Pine Bluff, AR 71603
MLS# 25029084Listed by: BLUE INK REAL ESTATE $119,000Active3 beds 2 baths1,525 sq. ft.
6740 Rayhan Rd, Pine Bluff, AR 71603
MLS# 25027856Listed by: LISA ATTWOOD REALTY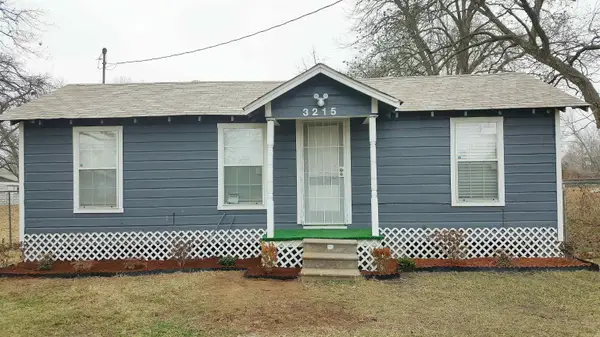 $34,500Active2 beds 1 baths1,020 sq. ft.
3215 Miramar Drive, Pine Bluff, AR 71603
MLS# 25027672Listed by: BRICK KEY REALTY $40,000Active2 beds 1 baths1,148 sq. ft.
1500 W 25th Ave., Pine Bluff, AR 76103
MLS# 25027524Listed by: REAL ESTATE CENTRAL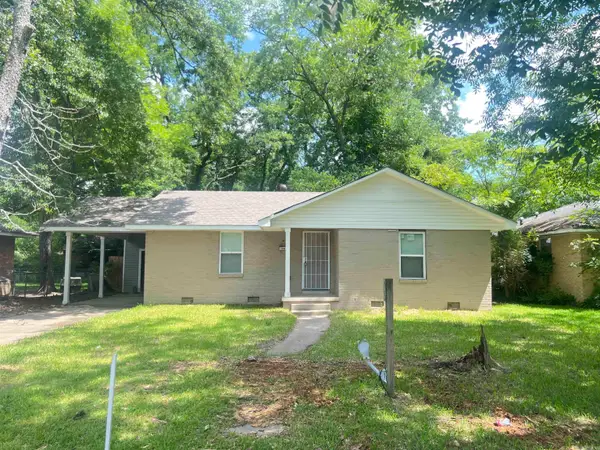 $89,900Active3 beds 2 baths1,030 sq. ft.
1903 W 24th Avenue, Pine Bluff, AR 71603
MLS# 25024804Listed by: LISA ATTWOOD REALTY $70,000Active2 beds 1 baths1,450 sq. ft.
Address Withheld By Seller, Pine Bluff, AR 71603
MLS# 25024029Listed by: KELLER WILLIAMS REALTY HOT SPRINGS $71,000Active3 beds 2 baths1,280 sq. ft.
2907 Beechnut Dr, Pine Bluff, AR 71603
MLS# 25023590Listed by: JENICA CLEMENT PROPERTIES $90,000Active3 beds 2 baths1,546 sq. ft.
2800 S Cherry Street, Pine Bluff, AR 71603
MLS# 25022071Listed by: CRYE-LEIKE REALTORS NLR BRANCH $4,000Active0.15 Acres
3412 W 12th Ave, Pine Bluff, AR 71603
MLS# 26009518Listed by: LUNSFORD & ASSOCIATES REALTY CO. $154,900Active3 beds 2 baths1,800 sq. ft.
2913 Edgewood Drive, Pine Bluff, AR 71603
MLS# 25031092Listed by: LISA ATTWOOD REALTY $155,000Active3 beds 3 baths2,448 sq. ft.
Address Withheld By Seller, Pine Bluff, AR 71603
MLS# 25018885Listed by: RESOURCE REALTY $194,000Active3 beds 2 baths2,072 sq. ft.
3801 S Hazel, Pine Bluff, AR 71603
MLS# 25017796Listed by: LUNSFORD & ASSOCIATES REALTY CO. $51,000Active17 Acres
000 Middlewarren Road, Pine Bluff, AR 71603
MLS# 25016036Listed by: RE/MAX ADVANTAGE HEBER SPRINGS $295,000Active4 beds 3 baths2,427 sq. ft.
Address Withheld By Seller, Pine Bluff, AR 71603
MLS# 25014654Listed by: JEFFREY NEAL REALTY $164,900Active3 beds 2 baths1,468 sq. ft.
2609 Sherwood Forest, Pine Bluff, AR 71603
MLS# 25014644Listed by: LISA ATTWOOD REALTY $4,400Active0.27 Acres
3411 W 7th Ave, Pine Bluff, AR 71603
MLS# 26007159Listed by: LUNSFORD & ASSOCIATES REALTY CO. $32,200Active1.79 Acres
5508 W. 17th Avenue, Pine Bluff, AR 71603
MLS# 25012203Listed by: SOUTHERN HOMES REALTY - WHITE HALL- $11,000Active1 Acres
2718 Shannon Valley Road, Pine Bluff, AR 71603
MLS# 25009630Listed by: LUNSFORD & ASSOCIATES REALTY CO.  $89,900Active3 beds 2 baths1,456 sq. ft.
9024 Welborn Drive, Pine Bluff, AR 71603
MLS# 25008799Listed by: SIGNATURE HOMES REAL ESTATE $60,000Active9.97 Acres
00 Ridgeway Road, Pine Bluff, AR 71603
MLS# 25039538Listed by: BLUE COLLAR REAL ESTATE $499,000Active19.16 Acres
4826 Old Warren Road, Pine Bluff, AR 71603
MLS# 25004249Listed by: LUNSFORD & ASSOCIATES REALTY CO. $2,100Active0.16 Acres
77 Cypress Drive, Other, Ar 71603
MLS# 83461660Listed by: PREMIER REALTY GROUP $46,000Active3 beds 1 baths925 sq. ft.
2804 W 30th Avenue, Pine Bluff, AR 71603
MLS# 24040374Listed by: RE/MAX PLATINUM $39,900Active3 beds 1 baths1,526 sq. ft.
210 W 18th Avenue, Pine Bluff, AR 71603
MLS# 24038445Listed by: FAITH REALTY & ASSOCIATES $19,900Active3 beds 1 baths1,056 sq. ft.
3406 Lilac, Pine Bluff, AR 71603
MLS# 24038435Listed by: FAITH REALTY & ASSOCIATES $42,996Active3 beds 2 baths1,302 sq. ft.
2923 Edgewood Drive, Pine Bluff, AR 71603
MLS# 24036669Listed by: CENTURY 21 UNITED PINE BLUFF $7,000Active2 beds 1 baths948 sq. ft.
1904 Arlington Street, Pine Bluff, AR 71603
MLS# 24036677Listed by: CENTURY 21 UNITED PINE BLUFF $105,000Active2 Acres
0 Tinner, Pine Bluff, AR 71603
MLS# 24034260Listed by: LISA ATTWOOD REALTY $2,950Active0.14 Acres
1405 W 9th Avenue, Other, Ar 71603
MLS# 98610922Listed by: PREMIER REALTY GROUP $74,950Active19.2 Acres
Address Withheld By Seller, Pine Bluff, AR 71603
MLS# 24032585Listed by: DDK LAND AND FARM $65,600Active16.8 Acres
Address Withheld By Seller, Pine Bluff, AR 71603
MLS# 24032586Listed by: DDK LAND AND FARM $599,900Active4 beds 4 baths3,400 sq. ft.
190 Peregrine Drive, Pine Bluff, AR 71603
MLS# 24031149Listed by: LISA ATTWOOD REALTY $65,000Active5.76 Acres
Address Withheld By Seller, Pine Bluff, AR 71603
MLS# 25038738Listed by: RE/MAX PLATINUM $49,900Active2 beds 1 baths1,062 sq. ft.
3500 S Poplar, Pine Bluff, AR 71603
MLS# 24028984Listed by: THE PROPERTY SHOP OF AR, INC. $5,000Active0.25 Acres
Lot 16 and 17 Eureka Heights #5 Subdivision, Pine Bluff, AR 71602
MLS# 25027644Listed by: CBRPM BRYANT $130,500Active3 beds 2 baths1,542 sq. ft.
Address Withheld By Seller, Pine Bluff, AR 71603
MLS# 24023076Listed by: MILES-NEWSOME & ASSOCIATES REALTY, INC. $365,000Active4 beds 4 baths3,362 sq. ft.
10 Deer Horn Cove, Pine Bluff, AR 71603
MLS# 24018391Listed by: REAL ESTATE CENTRAL $99,500Active3 beds 2 baths1,803 sq. ft.
2201 W 38th, Pine Bluff, AR 71603
MLS# 25034379Listed by: BLUE INK REAL ESTATE $10,000Active0.24 Acres
Address Withheld By Seller, Pine Bluff, AR 71603
MLS# 24013970Listed by: C GRIFF REALTY $30,500Active3 beds 1 baths1,561 sq. ft.
1901 S Cherry St, Pine Bluff, AR 71603
MLS# 24011985Listed by: REAL ESTATE CENTRAL $50,000Active13.77 Acres
0 Lee Springs Road, Pine Bluff, AR 71603
MLS# 24010741Listed by: LISA ATTWOOD REALTY $15,000Active5 Acres
0 W 13th, Pine Bluff, AR 71603
MLS# 24003896Listed by: LISA ATTWOOD REALTY $100,555Active28.73 Acres
0000 Ridgeway/hampton Parkway Area, Pine Bluff, AR 71603
MLS# 23036813Listed by: MERRITT REALTY GROUP $90,405Active25.83 Acres
0001 Ridgeway/hampton Parkway Area, Pine Bluff, AR 71603
MLS# 23036819Listed by: MERRITT REALTY GROUP $19,500Active2 beds 1 baths1,300 sq. ft.
Address Withheld By Seller, Pine Bluff, AR 71613
MLS# 23028137Listed by: AUSTIN REALTY SERVICES INC. $160,000Active40 Acres
40 Acres Sulphur Springs Rd, Pine Bluff, AR 71603
MLS# 23026890Listed by: NEW STAGE REALTY, LLC $187,500Active75 Acres
0000 Aaron Road, Pine Bluff, AR 71603
MLS# 25029593Listed by: MICHELE PHILLIPS & CO. REALTORS- $5,500Active1 Acres
1902 E 38th, Pine Bluff, AR 71603
MLS# 20014503Listed by: THE MIDAS REAL ESTATE GROUP  $75,000Active3 beds 1 baths1,134 sq. ft.
4510 W 17th Street, Pine Bluff, AR 71602
MLS# 22022642Listed by: THE PROPERTY SHOP OF AR, INC. $87,900Active3 beds 2 baths1,416 sq. ft.
Address Withheld By Seller, Pine Bluff, AR 71603
MLS# 23004895Listed by: JEFFREY NEAL REALTY $89,450Active20 Acres
Sorrells Road, Pine Bluff, AR 71603
MLS# 22021018Listed by: DDK LAND AND FARM
Local realty services provided by:CENTURY 21 Combs & Associates Real Estate, CENTURY 21 Action Realty, CENTURY 21 Lucky Money Real Estate
Copyright 2026, Houston Realtors Information Service, Inc. All information provided is deemed reliable but is not guaranteed and should be independently verified. IDX information is provided exclusively for consumers' personal, non-commercial use, it may not be used for any purpose other than to identify prospective properties consumers may be interested in purchasing, and the data is deemed reliable but is not guaranteed accurate by the MLS.
Popular searches near 71603
Popular neighborhoods near 71603
- Chicot, Little Rock homes for sale
- Cloverdale, Little Rock homes for sale
- Dunbar School, Little Rock homes for sale
- Governor's Mansion, Little Rock homes for sale
- Hanger Hill, Little Rock homes for sale
- Macarthur Park, Little Rock homes for sale
- Martin Luther King, Little Rock homes for sale
- Meadowbrook, Little Rock homes for sale
- Otter Creek, Little Rock homes for sale
- OUR, Little Rock homes for sale
- Pettaway, Little Rock homes for sale
- Quapaw Quarter, Little Rock homes for sale
- South End, Little Rock homes for sale
- Stagecoach, Little Rock homes for sale
- Town and Country, Little Rock homes for sale
- Upper Baseline, Little Rock homes for sale
- Wakefield, Little Rock homes for sale
- West Baseline, Little Rock homes for sale
- Westwood, Little Rock homes for sale
- Wright Avenue, Little Rock homes for sale
Counties near Pine Bluff, 71603
- Arkansas County homes for sale
- Ashley County homes for sale
- Bradley County homes for sale
- Calhoun County homes for sale
- Clark County homes for sale
- Cleveland County homes for sale
- Dallas County homes for sale
- Desha County homes for sale
- Drew County homes for sale
- Garland County homes for sale
- Grant County homes for sale
- Hot Spring County homes for sale
- Jefferson County homes for sale
- Lincoln County homes for sale
- Lonoke County homes for sale
- Monroe County homes for sale
- Ouachita County homes for sale
- Prairie County homes for sale
- Pulaski County homes for sale
- Saline County homes for sale
Protect your home and budget from life's surprises with an Assurant Home Warranty, backed by a partner that supports you through every step of homeownership. Explore Plans.
©2026 Century 21 Real Estate LLC. All rights reserved. CENTURY 21®, the CENTURY 21 Logo and C21® are service marks owned by Century 21 Real Estate LLC. Century 21 Real Estate LLC fully supports the principles of the Fair Housing Act and the Equal Opportunity Act. Each office is independently owned and operated. Listing information is deemed reliable but not guaranteed accurate.