- Boca Bayou, Boca Raton homes for sale
- Boca Pointe, Boca Raton homes for sale
- Boca Raton Square, Boca Raton homes for sale
- Bramalea, Boca Raton homes for sale
- Broward Highlands, Deerfield Beach homes for sale
- Buenavista, Boca Raton homes for sale
- Camino Gardens, Boca Raton homes for sale
- Carver Heights, Deerfield Beach homes for sale
- Century Village, Deerfield Beach homes for sale
- Coral Manor, Deerfield Beach homes for sale
- Deer Creek Golf Estates, Deerfield Beach homes for sale
- Deerfield Beach Estates, Deerfield Beach homes for sale
- Mizner Trail, Boca Raton homes for sale
- Newport Center, Deerfield Beach homes for sale
- Northwest Park, Deerfield Beach homes for sale
- Palm Beach Farms, Boca Raton homes for sale
- Park Haven, Pompano Beach homes for sale
- Parkside, Boca Raton homes for sale
- The Village at Tivoli, Deerfield Beach homes for sale
- Via Mizner Golf & Country Club, Boca Raton homes for sale
Pine Tree Park, Deerfield Beach, FL - homes for sale
2 of 2 results displayed
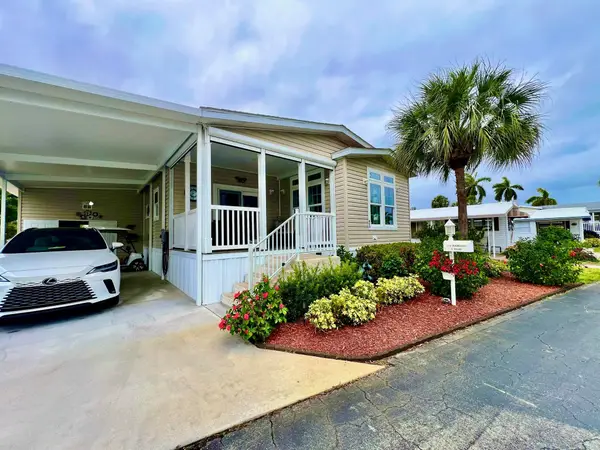 $289,000Active2 beds 2 baths1,200 sq. ft.
413 Hibiscus Drive, Deerfield Beach, FL 33442
MLS# R11129012Listed by: FLORIDA REALTY AGENCY $125,000Active2 beds 2 baths850 sq. ft.
610 Frangipani Lane, Deerfield Beach, FL 33442
MLS# R11150033Listed by: FLORIDA REALTY AGENCY
Local realty services provided by:CENTURY 21 Hansen Realty
Popular neighborhoods near Pine Tree Park, Deerfield Beach, FL
Zip codes near Pine Tree Park, Deerfield Beach, FL
- 33060 homes for sale
- 33062 homes for sale
- 33063 homes for sale
- 33064 homes for sale
- 33066 homes for sale
- 33067 homes for sale
- 33069 homes for sale
- 33073 homes for sale
- 33076 homes for sale
- 33428 homes for sale
- 33431 homes for sale
- 33432 homes for sale
- 33433 homes for sale
- 33434 homes for sale
- 33441 homes for sale
- 33442 homes for sale
- 33486 homes for sale
- 33487 homes for sale
- 33496 homes for sale
- 33498 homes for sale
Counties near Pine Tree Park, Deerfield Beach, FL
Protect your home and budget from life's surprises with an Assurant Home Warranty, backed by a partner that supports you through every step of homeownership. Explore Plans.
©2026 Century 21 Real Estate LLC. All rights reserved. CENTURY 21®, the CENTURY 21 Logo and C21® are service marks owned by Century 21 Real Estate LLC. Century 21 Real Estate LLC fully supports the principles of the Fair Housing Act and the Equal Opportunity Act. Each office is independently owned and operated. Listing information is deemed reliable but not guaranteed accurate.