- Apple Hollow, Clarksville homes for sale
- Bordeaux, Nashville homes for sale
- Brick Church Bellshire, Whites Creek homes for sale
- Canterbury, Clarksville homes for sale
- Enchanted Hills, Nashville homes for sale
- Farmington, Clarksville homes for sale
- Holly Point, Clarksville homes for sale
- Joelton, Joelton homes for sale
- Marrowbone, Joelton homes for sale
- Parkvue Village, Clarksville homes for sale
- Parkwood, Goodlettsville homes for sale
- Poplar Hill, Clarksville homes for sale
- Rudolphtown, Clarksville homes for sale
- Scottsboro, Nashville homes for sale
- South Ridge, Clarksville homes for sale
- Stones Manor, Clarksville homes for sale
- The Legacy, Springfield homes for sale
- The Villages, Clarksville homes for sale
- Treefield Woods, Clarksville homes for sale
- Whites Bend, Nashville homes for sale
Pleasant View, TN - homes for sale
118 of 118 results displayed
- New
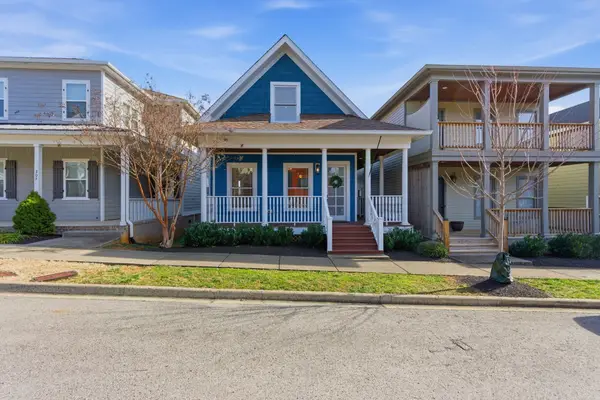
 $340,000Active3 beds 3 baths1,640 sq. ft.
107 Savannah Ave, Pleasant View, TN 37146
MLS# 3288207Listed by: MARK SPAIN REAL ESTATE - New
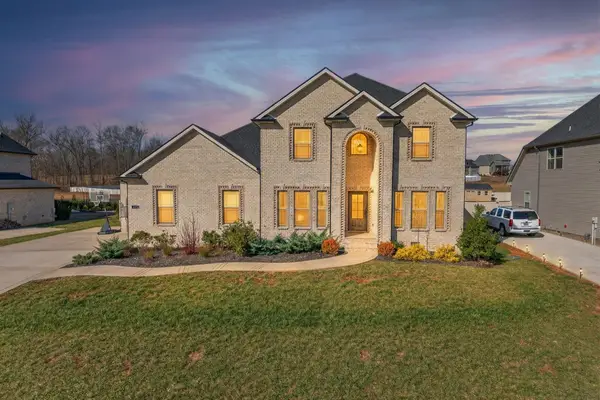
 $339,000Active3 beds 2 baths1,480 sq. ft.
2310 Bradley St, Pleasant View, TN 37146
MLS# 3279305Listed by: BENCHMARK REALTY - New
 $399,990Active4 beds 3 baths2,325 sq. ft.
5043 Kensington Way, Pleasant View, TN 37146
MLS# 3279141Listed by: RYAN HOMES  $463,570Pending4 beds 3 baths2,423 sq. ft.
3294 Paddock Park, Pleasant View, TN 37146
MLS# 3272311Listed by: RYAN HOMES- New
 $404,990Active4 beds 3 baths2,423 sq. ft.
5035 Kensington Way, Pleasant View, TN 37146
MLS# 3270637Listed by: RYAN HOMES - New
 $479,999Active3 beds 3 baths2,390 sq. ft.
315 Augusta Ave, Pleasant View, TN 37146
MLS# 3269706Listed by: COLDWELL BANKER SOUTHERN REALTY - New
 $710,000Active5 beds 4 baths3,452 sq. ft.
308 Young Ln, Pleasant View, TN 37146
MLS# 3269650Listed by: CORCORAN REVERIE 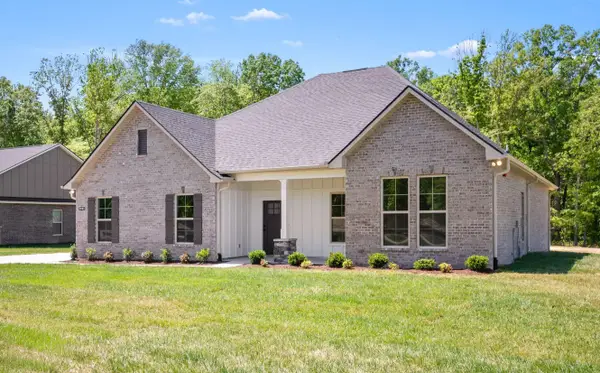 $575,990Active6 beds 3 baths3,144 sq. ft.
8803 Turnbull Dr, Pleasant View, TN 37146
MLS# 3262614Listed by: DSLD HOMES (SOUTHEAST), LLC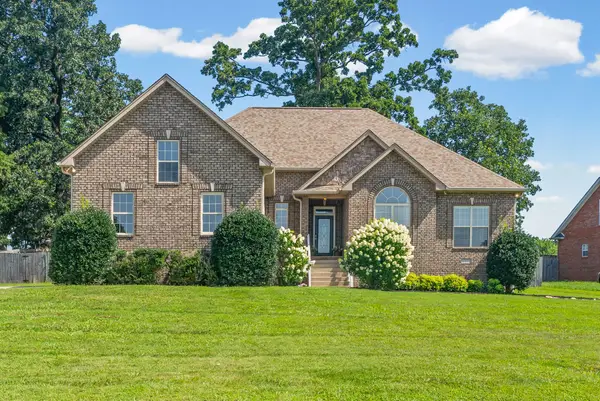 $499,900Active4 beds 3 baths2,508 sq. ft.
1191 Filmore Harris Rd, Pleasant View, TN 37146
MLS# 3261516Listed by: BENCHMARK REALTY- Open Mon, 4 to 6pm
 $0Active3 beds 2 baths1,395 sq. ft.
2262 Pleasant View Rd, Pleasant View, TN 37146
MLS# 3261455Listed by: APEX REALTY & AUCTION, LLC  $412,900Active3 beds 3 baths1,880 sq. ft.
193 Misty Dr, Pleasant View, TN 37146
MLS# 3260582Listed by: ELEVATE POWERED BY EXIT $381,005Pending3 beds 3 baths1,601 sq. ft.
3235 Paddock Park, Pleasant View, TN 37146
MLS# 3256662Listed by: RYAN HOMES $400,000Active3 beds 2 baths1,876 sq. ft.
1007 Copper Kettle Cir, Pleasant View, TN 37146
MLS# 3255199Listed by: AT HOME REALTY $262,900Active4 beds 3 baths1,847 sq. ft.
1155 Woodson Rd, Pleasant View, TN 37146
MLS# 3251933Listed by: COLDWELL BANKER CONROY, MARABLE & HOLLEMAN $4,950,000Active5.63 Acres
0 Higway 49, Pleasant View, TN 37146
MLS# 3251943Listed by: MARK SPAIN REAL ESTATE $569,990Active6 beds 3 baths3,144 sq. ft.
8709 Turnbull Dr, Pleasant View, TN 37146
MLS# 3251644Listed by: DSLD HOMES (SOUTHEAST), LLC $415,000Active3 beds 3 baths1,763 sq. ft.
241 Franklin St, Pleasant View, TN 37146
MLS# 3251479Listed by: 24 REALTY $409,900Active3 beds 3 baths1,631 sq. ft.
2029 Copper Kettle Cir, Pleasant View, TN 37146
MLS# 3251376Listed by: EXIT REALTY REFINED $570,990Active5 beds 3 baths2,880 sq. ft.
8638 Turnbull Dr, Pleasant View, TN 37146
MLS# 3251147Listed by: DSLD HOMES (SOUTHEAST), LLC $459,000Active3 beds 2 baths2,772 sq. ft.
1387 Old Clarksville Pike, Pleasant View, TN 37146
MLS# 3249018Listed by: HOME HUNTERS REALTY $399,900Active3 beds 2 baths1,471 sq. ft.
266 Glenda Ct, Pleasant View, TN 37146
MLS# 3248123Listed by: RE/MAX CARRIAGE HOUSE $460,000Active4 beds 3 baths2,184 sq. ft.
430 Clayton Ct, Pleasant View, TN 37146
MLS# 3246675Listed by: BENCHMARK REALTY, LLC $645,000Active4 beds 3 baths2,967 sq. ft.
202 Gower St, Pleasant View, TN 37146
MLS# 3246348Listed by: WEICHERT, REALTORS - THE ANDREWS GROUP $309,000Active3 beds 3 baths1,641 sq. ft.
138 Addi St, Pleasant View, TN 37146
MLS# 3246442Listed by: BENCHMARK REALTY $564,990Active6 beds 3 baths3,144 sq. ft.
8663 Turnbull Dr, Pleasant View, TN 37146
MLS# 3246376Listed by: DSLD HOMES (SOUTHEAST), LLC $389,900Active3 beds 2 baths1,544 sq. ft.
261 Franklin St, Pleasant View, TN 37146
MLS# 3245786Listed by: 24 REALTY $689,000Active4 beds 3 baths3,080 sq. ft.
2447 Pleasant View Rd, Pleasant View, TN 37146
MLS# 3245568Listed by: FIRST CLASS REALTY, LLC $275,000Active2 beds 2 baths1,176 sq. ft.
177 Bailey Ln #101, Pleasant View, TN 37146
MLS# 3245586Listed by: AT HOME REALTY $415,000Pending3 beds 2 baths2,218 sq. ft.
1372 Hicks Edgen Rd, Pleasant View, TN 37146
MLS# 3244648Listed by: WEICHERT, REALTORS - THE ANDREWS GROUP $417,900Active3 beds 2 baths2,489 sq. ft.
223 Misty Dr, Pleasant View, TN 37146
MLS# 3243840Listed by: CPR REALTY $442,000Active3 beds 3 baths1,818 sq. ft.
1062 Heatherwood Rd, Pleasant View, TN 37146
MLS# 3243207Listed by: AT HOME REALTY $335,000Active3 beds 1 baths1,000 sq. ft.
1337 Oaklawn Rd, Chapmansboro, TN 37035
MLS# 3242855Listed by: AT HOME REALTY $300,000Active3 beds 1 baths1,098 sq. ft.
116 Ellis Dr, Pleasant View, TN 37146
MLS# 3242293Listed by: BENCHMARK REALTY, LLC $729,900Active3 beds 3 baths2,690 sq. ft.
15 Rustling Oaks Ct, Pleasant View, TN 37146
MLS# 3239563Listed by: SWEET HOME REALTY AND PROPERTY MANAGEMENT $299,900Active5.57 Acres
0 Keystone Dr, Pleasant View, TN 37146
MLS# 3239606Listed by: SWEET HOME REALTY AND PROPERTY MANAGEMENT $365,000Active3 beds 2 baths1,226 sq. ft.
1087 Heatherwood Rd, Pleasant View, TN 37146
MLS# 3231243Listed by: ANEW REAL ESTATE CONSULTANTS $414,900Active3 beds 3 baths2,208 sq. ft.
288 Augusta Ave, Pleasant View, TN 37146
MLS# 3230656Listed by: REDFIN $285,000Active2 beds 3 baths1,548 sq. ft.
414 Manor Row, Pleasant View, TN 37146
MLS# 3229979Listed by: 24 REALTY $381,190Pending3 beds 3 baths2,296 sq. ft.
5083 Kensington Way, Pleasant View, TN 37146
MLS# 3243176Listed by: RYAN HOMES $434,900Active3 beds 2 baths2,150 sq. ft.
2016 Copper Kettle Cir, Pleasant View, TN 37146
MLS# 3224850Listed by: 24 REALTY $499,900Active3 beds 3 baths2,458 sq. ft.
216 Daniel St, Pleasant View, TN 37146
MLS# 3225185Listed by: KELLER WILLIAMS REALTY $379,900Active3 beds 2 baths1,634 sq. ft.
1340 Hicks Edgen Rd, Pleasant View, TN 37146
MLS# 3223107Listed by: WEICHERT, REALTORS - THE ANDREWS GROUP $439,900Active3 beds 3 baths2,317 sq. ft.
379 Misty Dr, Pleasant View, TN 37146
MLS# 3220259Listed by: MARKET STREET PROPERTIES, LLC $319,900Active3 beds 2 baths1,125 sq. ft.
1223 Main St, Pleasant View, TN 37146
MLS# 3219921Listed by: BEASTON GROUP REAL ESTATE $475,000Active3 beds 3 baths2,080 sq. ft.
1138 Shahan Rd, Pleasant View, TN 37146
MLS# 3218234Listed by: THE ASHTON REAL ESTATE GROUP OF RE/MAX ADVANTAGE $519,900Active4 beds 3 baths3,006 sq. ft.
278 Janet Dr, Pleasant View, TN 37146
MLS# 3218088Listed by: BENCHMARK REALTY, LLC $374,990Active3 beds 3 baths2,294 sq. ft.
5063 Kennsington Way, Pleasant View, TN 37146
MLS# 3243938Listed by: RYAN HOMES $479,000Active3 beds 3 baths1,904 sq. ft.
235 Augusta Ave, Pleasant View, TN 37146
MLS# 3208108Listed by: BENCHMARK REALTY, LLC $589,900Active5 beds 4 baths3,288 sq. ft.
8583 Turnbull Dr, Pleasant View, TN 37146
MLS# 3205554Listed by: AT HOME REALTY $475,000Active3 beds 3 baths2,112 sq. ft.
1236 Rooster Ridge Rd, Pleasant View, TN 37146
MLS# 3190930Listed by: 24 REALTY $273,500Active3 beds 3 baths1,477 sq. ft.
2067 Downstream Dr, Ashland City, TN 37015
MLS# 3191193Listed by: AT HOME REALTY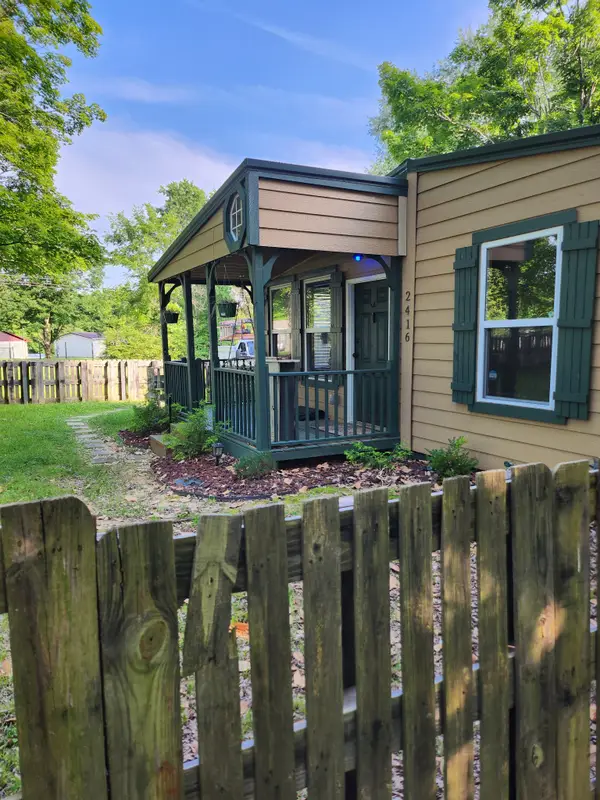 $309,000Active2 beds 1 baths1,008 sq. ft.
2416 Lee Dr, Pleasant View, TN 37146
MLS# 3190529Listed by: PHOENIX INVESTMENT REAL ESTATE LLC $722,400Active4 beds 4 baths3,225 sq. ft.
95 Highland Reserves, Pleasant View, TN 37146
MLS# 3190420Listed by: EXP REALTY $379,000Active3 beds 3 baths1,994 sq. ft.
719 Centre St, Pleasant View, TN 37146
MLS# 3185376Listed by: GOLDSTAR REALTY $329,900Active3 beds 3 baths1,784 sq. ft.
320 Manor Row, Pleasant View, TN 37146
MLS# 3183376Listed by: CRYE-LEIKE, REALTORS $402,990Active3 beds 2 baths1,596 sq. ft.
1211 Amber Hills Drive, Ashland City, TN 37015
MLS# 3183213Listed by: OLE SOUTH REALTY $415,990Active3 beds 3 baths1,999 sq. ft.
1227 Amber Hills Drive, Ashland City, TN 37015
MLS# 3183320Listed by: OLE SOUTH REALTY
 $459,777Active3 beds 2 baths1,978 sq. ft.
1705 Hunt Ln, Pleasant View, TN 37146
MLS# 3182979Listed by: CENTURY 21 LANDMARK REALTY $336,000Active3 beds 3 baths1,705 sq. ft.
415 Prestige Ct, Pleasant View, TN 37146
MLS# 3182160Listed by: OPENDOOR BROKERAGE, LLC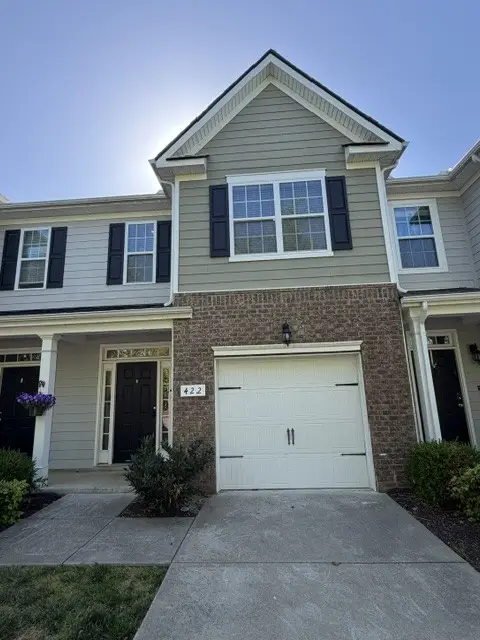 $299,900Active2 beds 3 baths1,548 sq. ft.
422 Manor Row, Pleasant View, TN 37146
MLS# 3181824Listed by: AT HOME REALTY $325,000Active3 beds 1 baths1,100 sq. ft.
1404 Alton Dr, Pleasant View, TN 37146
MLS# 3181007Listed by: 24 REALTY $349,900Active3 beds 3 baths1,450 sq. ft.
130 Gower Street, Pleasant View, TN 37146
MLS# 3178723Listed by: BYERS & HARVEY INC. $279,900Pending3 beds 2 baths1,081 sq. ft.
515 Preakness Cir, Pleasant View, TN 37146
MLS# 3176606Listed by: AT HOME REALTY $279,900Active2 beds 3 baths1,306 sq. ft.
147 Addi St, Pleasant View, TN 37146
MLS# 3170919Listed by: BENCHMARK REALTY, LLC $619,990Pending5 beds 4 baths3,520 sq. ft.
8756 Turnbull Dr, Pleasant View, TN 37146
MLS# 3170996Listed by: DSLD HOMES (SOUTHEAST), LLC $1,150,000Active3 beds 3 baths2,706 sq. ft.
2385 Pleasant View Rd, Pleasant View, TN 37146
MLS# 3169067Listed by: BENCHMARK REALTY, LLC $319,000Active3 beds 2 baths1,370 sq. ft.
1923 Blue Bird Dr, Pleasant View, TN 37146
MLS# 3168430Listed by: ONWARD REAL ESTATE $352,990Pending3 beds 2 baths1,666 sq. ft.
5024 Kennsington Way, Pleasant View, TN 37146
MLS# 3176459Listed by: RYAN HOMES $475,000Active3 beds 2 baths2,004 sq. ft.
623 Centre St, Pleasant View, TN 37146
MLS# 3167746Listed by: WEICHERT, REALTORS - THE ANDREWS GROUP $729,900Active4 beds 3 baths4,025 sq. ft.
119 Christi Pl, Pleasant View, TN 37146
MLS# 3167007Listed by: KELLER WILLIAMS REALTY $482,900Pending3 beds 3 baths2,118 sq. ft.
704 Jess Harris Rd, Pleasant View, TN 37146
MLS# 3164236Listed by: AT HOME REALTY $492,800Active3 beds 3 baths2,240 sq. ft.
4005 Sweet Home Rd, Pleasant View, TN 37146
MLS# 3164237Listed by: AT HOME REALTY $485,500Active3 beds 3 baths2,158 sq. ft.
4007 Sweet Home Rd, Pleasant View, TN 37146
MLS# 3164238Listed by: AT HOME REALTY $747,348Active5 beds 4 baths3,444 sq. ft.
99 Highland Reserves, Pleasant View, TN 37146
MLS# 3149405Listed by: CLARKSVILLEHOMEOWNER.COM $658,350Active4 beds 4 baths3,174 sq. ft.
8325 Turnbull Dr, Pleasant View, TN 37146
MLS# 3148767Listed by: KELLER WILLIAMS REALTY CLARKSVILLE $639,900Active4 beds 3 baths2,745 sq. ft.
2031 Eagles Bluff Dr, Pleasant View, TN 37146
MLS# 3146270Listed by: 24 REALTY $589,990Pending5 beds 3 baths3,270 sq. ft.
8802 Turnbull Dr, Pleasant View, TN 37146
MLS# 3146462Listed by: DSLD HOMES (SOUTHEAST), LLC $295,000Active3 beds 2 baths1,489 sq. ft.
207 Bailey Ln #102, Pleasant View, TN 37146
MLS# 3145305Listed by: FIRST CLASS REALTY, LLC $389,610Pending3 beds 3 baths2,294 sq. ft.
5042 Kensington Way, Pleasant View, TN 37146
MLS# 3143334Listed by: RYAN HOMES $574,990Active4 beds 3 baths3,013 sq. ft.
8662 Turnbull Dr, Pleasant View, TN 37146
MLS# 3138385Listed by: DSLD HOMES (SOUTHEAST), LLC $613,557Active3 beds 3 baths2,629 sq. ft.
98 Highland Reserves, Pleasant View, TN 37146
MLS# 3138223Listed by: BENCHMARK REALTY $375,640Pending3 beds 2 baths1,513 sq. ft.
1267 Amber Hills Drive, Ashland City, TN 37015
MLS# 3135466Listed by: OLE SOUTH REALTY $485,000Active3 beds 2 baths1,772 sq. ft.
2717 Longstreet Ave, Pleasant View, TN 37146
MLS# 3116189Listed by: AT HOME REALTY $394,000Active4 beds 3 baths3,440 sq. ft.
6125 Highway 41a, Pleasant View, TN 37146
MLS# 3072457Listed by: PREMIER REALTY AND MANAGEMENT $657,900Active4 beds 4 baths2,924 sq. ft.
373 Young Lane, Pleasant View, TN 37146
MLS# 3068334Listed by: KELLER WILLIAMS REALTY CLARKSVILLE $400,000Pending4 beds 2 baths2,088 sq. ft.
1631 Triangle Rd, Ashland City, TN 37015
MLS# 3067688Listed by: MARK SPAIN REAL ESTATE $99,950Active1.57 Acres
2854 Joe Dowlen Rd, Pleasant View, TN 37146
MLS# 3062185Listed by: THE HUFFAKER GROUP, LLC $299,990Active2 beds 3 baths1,487 sq. ft.
270 Selesia Lane, Pleasant View, TN 37146
MLS# 3039907Listed by: OLE SOUTH REALTY $299,990Pending3 beds 3 baths1,641 sq. ft.
264 Selesia Lane, Pleasant View, TN 37146
MLS# 3039866Listed by: OLE SOUTH REALTY $309,990Pending3 beds 3 baths1,815 sq. ft.
258 Selesia Lane, Pleasant View, TN 37146
MLS# 3039458Listed by: OLE SOUTH REALTY $299,990Pending3 beds 3 baths1,641 sq. ft.
294 Selesia Lane, Pleasant View, TN 37146
MLS# 3039415Listed by: OLE SOUTH REALTY $299,990Active2 beds 3 baths1,487 sq. ft.
286 Selesia Lane, Pleasant View, TN 37146
MLS# 3038966Listed by: OLE SOUTH REALTY $299,990Active2 beds 3 baths1,487 sq. ft.
316 Selesia Lane, Pleasant View, TN 37146
MLS# 3038967Listed by: OLE SOUTH REALTY $629,200Active4 beds 3 baths2,860 sq. ft.
353 Young Lane, Pleasant View, TN 37146
MLS# 3070067Listed by: BENCHMARK REALTY $655,750Active4 beds 4 baths3,050 sq. ft.
390 Young Ln, Pleasant View, TN 37146
MLS# 3070309Listed by: EXP REALTY $1,179,000Active5 beds 4 baths3,050 sq. ft.
0 Keystone Drive, Pleasant View, TN 37146
MLS# 2976929Listed by: SWEET HOME REALTY AND PROPERTY MANAGEMENT $85,000Pending1.69 Acres
0 Rustling Oaks Ct, Pleasant View, TN 37146
MLS# 3121481Listed by: MODERN MOVEMENT REAL ESTATE $423,840Pending4 beds 3 baths2,423 sq. ft.
1278 Bay Meadows Way, Pleasant View, TN 37146
MLS# 2944324Listed by: RYAN HOMES $414,375Active3 beds 4 baths2,125 sq. ft.
191 Charleston Ave, Pleasant View, TN 37146
MLS# 2914078Listed by: SIXONEFIVE REAL ESTATE ADVISORS $398,546Active3 beds 4 baths1,973 sq. ft.
199 Charleston Ave, Pleasant View, TN 37146
MLS# 2914086Listed by: SIXONEFIVE REAL ESTATE ADVISORS $401,172Active3 beds 4 baths1,986 sq. ft.
195 Charleston Ave, Pleasant View, TN 37146
MLS# 2914087Listed by: SIXONEFIVE REAL ESTATE ADVISORS $408,200Active3 beds 5 baths1,986 sq. ft.
203 Charleston Ave, Pleasant View, TN 37146
MLS# 2914088Listed by: SIXONEFIVE REAL ESTATE ADVISORS $409,000Active3 beds 4 baths2,122 sq. ft.
187 Charleston Ave, Pleasant View, TN 37146
MLS# 2914068Listed by: SIXONEFIVE REAL ESTATE ADVISORS $415,155Active3 beds 4 baths2,129 sq. ft.
183 Charleston Ave, Pleasant View, TN 37146
MLS# 2914028Listed by: SIXONEFIVE REAL ESTATE ADVISORS $415,000Active3 beds 4 baths2,021 sq. ft.
179 Charleston Ave, Pleasant View, TN 37146
MLS# 2914016Listed by: SIXONEFIVE REAL ESTATE ADVISORS $299,990Pending2 beds 3 baths1,487 sq. ft.
145 Coleson Lane, Pleasant View, TN 37146
MLS# 2821189Listed by: OLE SOUTH REALTY $383,990Pending4 beds 3 baths2,325 sq. ft.
2068 Huntington Lane, Pleasant View, TN 37146
MLS# 2818841Listed by: RYAN HOMES $383,990Pending4 beds 3 baths2,325 sq. ft.
2078 Huntington Lane, Pleasant View, TN 37146
MLS# 2818839Listed by: RYAN HOMES $351,990Pending3 beds 2 baths1,666 sq. ft.
2063 Huntington Lane, Pleasant View, TN 37146
MLS# 2808766Listed by: RYAN HOMES $441,990Pending4 beds 3 baths3,010 sq. ft.
1226 Bay Meadows Way, Pleasant View, TN 37146
MLS# 2797899Listed by: RYAN HOMES $1,700,000Active-- beds -- baths
2126 Old Chamblis Rd, Pleasant View, TN 37146
MLS# 2654283Listed by: CENTURY 21 LANDMARK REALTY $315,000Active2 beds 1 baths1,008 sq. ft.
2416 Lee Dr, Pleasant View, TN 37146
MLS# 2610276Listed by: PHOENIX INVESTMENT REAL ESTATE LLC $224,000Pending4 beds 2 baths2,108 sq. ft.
2014 Highway 49 E, Ashland City, TN 37015
MLS# 2609605Listed by: APEX REALTY & AUCTION, LLC $610,000Active5 beds 4 baths2,922 sq. ft.
2088 Beverly Gail Rd, Pleasant View, TN 37146
MLS# 2594632Listed by: CRYE-LEIKE, INC., REALTORS $490,000Active3 beds 3 baths2,112 sq. ft.
7191 Winding Way, Pleasant View, TN 37146
MLS# 2587543Listed by: JIM BRINKLEY, REALTORS, INC. $699,000Active4 beds 3 baths2,611 sq. ft.
1395 Hicks Edgen Rd, Pleasant View, TN 37146
MLS# 2583773Listed by: HIVE NASHVILLE LLC $544,900Active3 beds 3 baths2,928 sq. ft.
124 Daniel St, Pleasant View, TN 37146
MLS# 2580483Listed by: WEICHERT, REALTORS - THE ANDREWS GROUP $759,900Active5 beds 4 baths3,444 sq. ft.
113 Highland Reserves, Pleasant View, TN 37146
MLS# 2540488Listed by: THE REDA SALES TEAM
Local realty services provided by:CENTURY 21 Premier
Neighborhoods near Pleasant View, TN
Zip codes near Pleasant View, TN
- 37010 homes for sale
- 37015 homes for sale
- 37032 homes for sale
- 37035 homes for sale
- 37036 homes for sale
- 37043 homes for sale
- 37072 homes for sale
- 37073 homes for sale
- 37080 homes for sale
- 37143 homes for sale
- 37146 homes for sale
- 37171 homes for sale
- 37172 homes for sale
- 37187 homes for sale
- 37189 homes for sale
- 37207 homes for sale
- 37209 homes for sale
- 37218 homes for sale
- 37228 homes for sale
- 37243 homes for sale
Popular searches near Pleasant View, TN
- Adams homes for sale
- Ashland City homes for sale
- Cedar Hill homes for sale
- Chapmansboro homes for sale
- Clarksville homes for sale
- Coopertown homes for sale
- Goodlettsville homes for sale
- Goodlettsville homes for sale
- Greenbrier homes for sale
- Guthrie homes for sale
- Joelton homes for sale
- Madison homes for sale
- Millersville homes for sale
- Nashville-Davidson homes for sale
- Pegram homes for sale
- Ridgetop homes for sale
- Southside homes for sale
- Springfield homes for sale
- White House homes for sale
- Whites Creek homes for sale
Protect your home and budget from life's surprises with an Assurant Home Warranty, backed by a partner that supports you through every step of homeownership. Explore Plans.
©2026 Century 21 Real Estate LLC. All rights reserved. CENTURY 21®, the CENTURY 21 Logo and C21® are service marks owned by Century 21 Real Estate LLC. Century 21 Real Estate LLC fully supports the principles of the Fair Housing Act and the Equal Opportunity Act. Each office is independently owned and operated. Listing information is deemed reliable but not guaranteed accurate.