- Artisan Lakes, Palmetto properties for sale
- Ayersworth, Wimauma properties for sale
- Belmont, Sun City Center properties for sale
- Covered Bridge Estates, Ellenton properties for sale
- Cross Creek, Parrish properties for sale
- Cypress Creek, Sun City Center properties for sale
- Falcon Watch, Sun City Center properties for sale
- Foxbrook, Parrish properties for sale
- Harrison Ranch, Parrish properties for sale
- Imperial Lakewoods Golf Club, Palmetto properties for sale
- Kingsfield, Parrish properties for sale
- North Course, Sun City Center properties for sale
- Panther Trace, Riverview properties for sale
- Renaissance, Sun City Center properties for sale
- Rivercrest, Riverview properties for sale
- South Course, Sun City Center properties for sale
- South Fork, Riverview properties for sale
- Summerfield, Riverview properties for sale
- Sun City Center, Sun City Center properties for sale
- Twin Rivers, Parrish properties for sale
Ruskin, FL - homes for sale
300 of 348 results displayed
- New
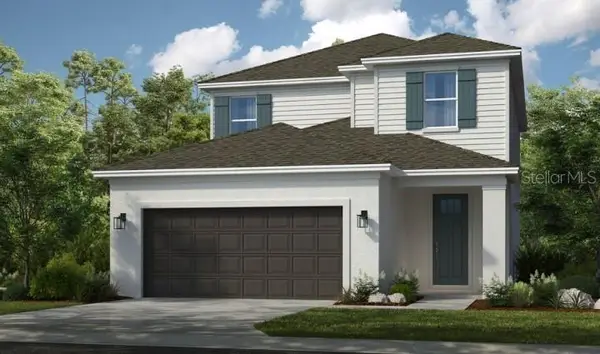
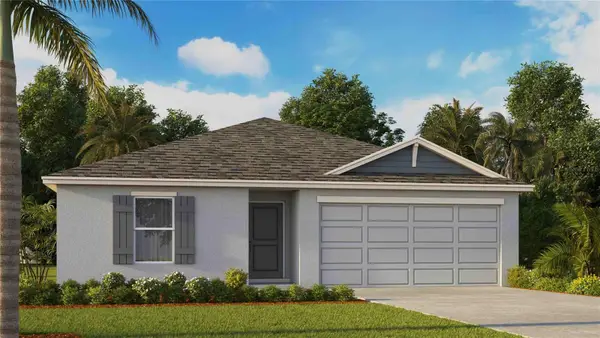
 $439,000Active6 beds 4 baths3,332 sq. ft.
1504 Oak Pond Street, RUSKIN, FL 33570
MLS# TB8464941Listed by: KELLER WILLIAMS SOUTH SHORE - New
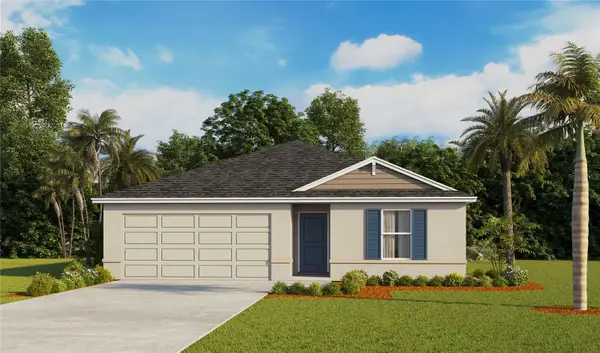
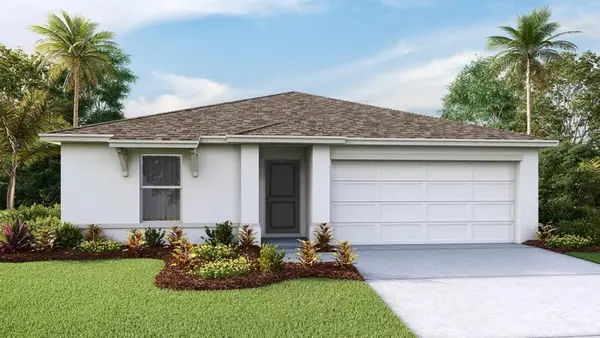
 $328,990Active3 beds 2 baths1,302 sq. ft.
446 Warm Heron Place, RUSKIN, FL 33570
MLS# TB8465422Listed by: D R HORTON REALTY OF TAMPA LLC - New
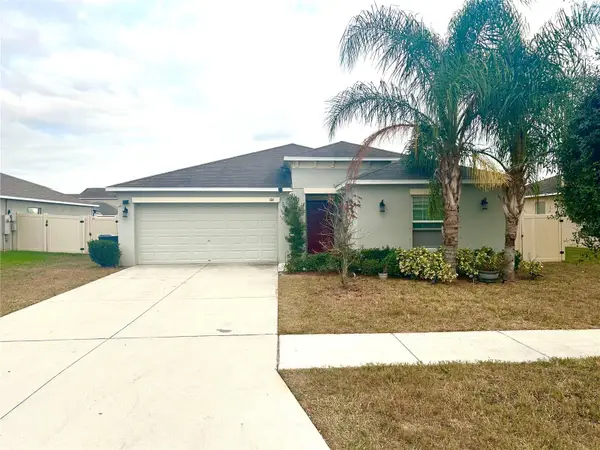
 $601,999Active4 beds 4 baths3,053 sq. ft.
5119 Slate Hue Place, APOLLO BEACH, FL 33572
MLS# TB8465226Listed by: TAYLOR MORRISON REALTY OF FL - New
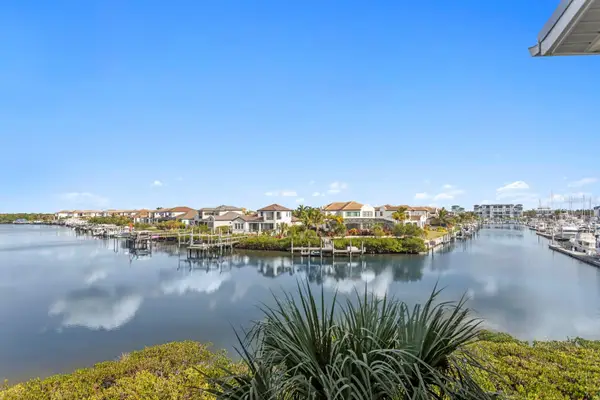
 $601,999Active4 beds 4 baths3,422 sq. ft.
5125 Slate Hue Place, APOLLO BEACH, FL 33572
MLS# TB8464618Listed by: TAYLOR MORRISON REALTY OF FL - New
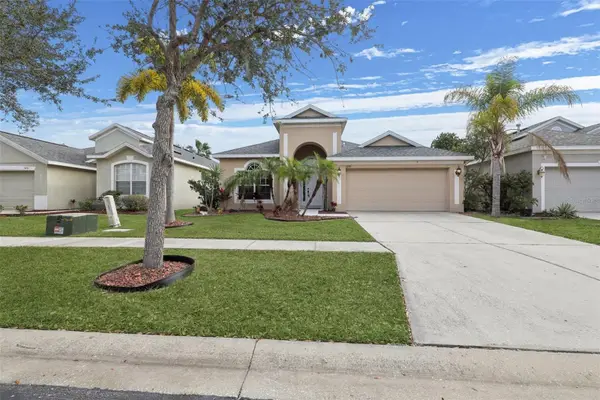
 $5,000Active3 beds 2 baths4,400 sq. ft.
1970 Hawks View Drive, Ruskin, FL 33570
MLS# 321627Listed by: JAMIE L BOONE LLC - New
 $451,999Active4 beds 4 baths2,209 sq. ft.
725 Steel Drive, APOLLO BEACH, FL 33572
MLS# TB8464510Listed by: TAYLOR MORRISON REALTY OF FL - New
 $359,999Active3 beds 2 baths2,062 sq. ft.
5229 Clover Mist Drive, APOLLO BEACH, FL 33572
MLS# O6373436Listed by: BEYCOME OF FLORIDA LLC - New
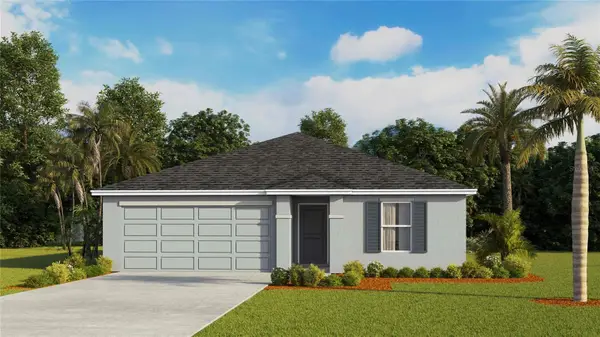
 $314,990Active3 beds 2 baths1,328 sq. ft.
1218 12 Street Se, RUSKIN, FL 33570
MLS# TB8463662Listed by: D R HORTON REALTY OF TAMPA LLC - New
 $313,990Active3 beds 2 baths1,328 sq. ft.
1214 12 Street Se, RUSKIN, FL 33570
MLS# TB8463674Listed by: D R HORTON REALTY OF TAMPA LLC - New
 $364,995Active4 beds 2 baths1,828 sq. ft.
1632 Sourwood Drive, RUSKIN, FL 33570
MLS# TB8463655Listed by: D R HORTON REALTY OF TAMPA LLC - New
 $325,990Active4 beds 2 baths1,498 sq. ft.
1220 12th Avenue Se, RUSKIN, FL 33570
MLS# TB8463694Listed by: D R HORTON REALTY OF TAMPA LLC - New
 $322,990Active4 beds 2 baths1,498 sq. ft.
1216 12th Avenue Se, RUSKIN, FL 33570
MLS# TB8463719Listed by: D R HORTON REALTY OF TAMPA LLC - New
 $423,900Active4 beds 2 baths1,971 sq. ft.
106 Cascade Bend Drive, RUSKIN, FL 33570
MLS# TB8463389Listed by: VANDERLEELIE & ASSOC.RE ESTATE - New
 $459,900Active3 beds 3 baths1,417 sq. ft.
457 Bahia Beach Boulevard, RUSKIN, FL 33570
MLS# A4677617Listed by: SUNSET REALTY - New
 $1,275,000Active3 beds 3 baths2,807 sq. ft.
3036 Christophers Watch Lane, RUSKIN, FL 33570
MLS# A4677590Listed by: SUNSET REALTY - New
 $317,500Active3 beds 2 baths1,676 sq. ft.
1905 Blue Stream Street, RUSKIN, FL 33570
MLS# TB8459626Listed by: REAL BROKER, LLC  $349,000Pending3 beds 3 baths2,117 sq. ft.
511 W College Avenue, RUSKIN, FL 33570
MLS# TB8461758Listed by: KELLER WILLIAMS SOUTH SHORE- New
 $324,900Active4 beds 2 baths1,880 sq. ft.
729 Chatham Walk Drive, RUSKIN, FL 33570
MLS# TB8462397Listed by: HOMM REAL ESTATE SERVICES - New
 $120,000Active3 beds 2 baths1,132 sq. ft.
1710 7th Street Sw #27, RUSKIN, FL 33570
MLS# TB8461174Listed by: FATHOM REALTY FL LLC - New
 $349,900Active2 beds 2 baths1,095 sq. ft.
817 Bahia Del Sol Drive #40, RUSKIN, FL 33570
MLS# A4677283Listed by: SUNSET REALTY  $349,990Pending4 beds 2 baths1,665 sq. ft.
1042 Spotted Egret Loop, RUSKIN, FL 33570
MLS# TB8458364Listed by: D R HORTON REALTY OF TAMPA LLC- New
 $339,000Active2 beds 2 baths1,184 sq. ft.
464 Bahia Beach Boulevard, RUSKIN, FL 33570
MLS# A4677024Listed by: SUNSET REALTY  $89,991Pending0.36 Acres
107 9th Street Ne, RUSKIN, FL 33570
MLS# TB8461151Listed by: ELEGANT CASAS CORP $5,000Active3 beds 2 baths1,835 sq. ft.
636 Tanana Fall Drive, Ruskin, FL 33570
MLS# 1065536Listed by: JAIME L BOONE LLC $405,000Active4 beds 2 baths2,112 sq. ft.
1761 Bonita Bluff Court, RUSKIN, FL 33570
MLS# TB8460319Listed by: LPT REALTY LLC $520,000Active4 beds 3 baths2,696 sq. ft.
1511 Bonita Bluff Court, RUSKIN, FL 33570
MLS# A4676583Listed by: MICHAEL SAUNDERS & COMPANY $359,000Active4 beds 2 baths1,935 sq. ft.
1728 Fred Ives Street, RUSKIN, FL 33570
MLS# TB8458703Listed by: 27NORTH REALTY $299,000Active3 beds 2 baths1,633 sq. ft.
921 Wynnmere Walk Avenue, RUSKIN, FL 33570
MLS# TB8458519Listed by: SANTANA AND COMPANY REAL ESTATE $384,990Active4 beds 3 baths2,336 sq. ft.
1370 16th Avenue Se, RUSKIN, FL 33570
MLS# TB8458450Listed by: D R HORTON REALTY OF TAMPA LLC $379,990Active4 beds 3 baths2,020 sq. ft.
1641 Sourwood Drive, RUSKIN, FL 33570
MLS# TB8458453Listed by: D R HORTON REALTY OF TAMPA LLC $322,990Active4 beds 2 baths1,498 sq. ft.
1212 12th Avenue Se, RUSKIN, FL 33570
MLS# TB8456233Listed by: D R HORTON REALTY OF TAMPA LLC $591,999Active4 beds 4 baths3,422 sq. ft.
5129 Slate Hue Place, APOLLO BEACH, FL 33572
MLS# TB8457880Listed by: TAYLOR MORRISON REALTY OF FL $434,999Active3 beds 4 baths2,060 sq. ft.
747 Steel Drive, APOLLO BEACH, FL 33572
MLS# TB8457868Listed by: TAYLOR MORRISON REALTY OF FL $295,000Active3 beds 2 baths1,267 sq. ft.
421 Royal Empress Drive, RUSKIN, FL 33570
MLS# N6141940Listed by: EXIT KING REALTY $416,999Active4 beds 4 baths2,060 sq. ft.
815 Steel Drive, APOLLO BEACH, FL 33572
MLS# TB8457689Listed by: TAYLOR MORRISON REALTY OF FL $824,000Active3 beds 2 baths1,964 sq. ft.
5413 Wishing Arch Drive, APOLLO BEACH, FL 33572
MLS# TB8457016Listed by: 27NORTH REALTY- Open Sat, 12 to 3pm
 $400,000Active3 beds 3 baths1,538 sq. ft.
215 17th Street Nw, RUSKIN, FL 33570
MLS# TB8455031Listed by: TAMPA LUXURY REAL ESTATE GROUP INC  $225,900Active3 beds 2 baths1,404 sq. ft.
837 Chatham Walk Drive, RUSKIN, FL 33570
MLS# A4675527Listed by: RE/MAX ALLIANCE GROUP $249,000Pending3 beds 2 baths1,984 sq. ft.
2201 Metro Drive, RUSKIN, FL 33570
MLS# TB8454887Listed by: KELLER WILLIAMS SOUTH SHORE $520,000Active2 beds 2 baths1,104 sq. ft.
907 Bahia Del Sol Drive #907, RUSKIN, FL 33570
MLS# A4675337Listed by: SUNSET REALTY $409,990Active6 beds 3 baths3,078 sq. ft.
2411 Birds Eye Court, RUSKIN, FL 33570
MLS# TB8456551Listed by: HOMEXPRESS REALTY, INC. $529,900Active3 beds 3 baths2,447 sq. ft.
1109 Seagrape Drive, RUSKIN, FL 33570
MLS# TB8455920Listed by: EXP REALTY LLC $317,000Active3 beds 2 baths1,423 sq. ft.
113 Eagle Summit Drive, RUSKIN, FL 33570
MLS# TB8455655Listed by: LPT REALTY, LLC- Open Sat, 2 to 4pm
 $480,000Active3 beds 3 baths1,593 sq. ft.
465 Bahia Beach Boulevard, RUSKIN, FL 33570
MLS# TB8455576Listed by: LPT REALTY, LLC  $299,900Active3 beds 2 baths1,451 sq. ft.
934 Fennel Seed Way, RUSKIN, FL 33570
MLS# TB8456418Listed by: AZURE REAL ESTATE & PROPERTY MANAGEMENT GROUP LLC $352,000Active4 beds 3 baths2,159 sq. ft.
1740 Bonita Bluff Court, RUSKIN, FL 33570
MLS# OM715049Listed by: LPT REALTY, LLC- Open Sat, 1 to 4pm
 $459,900Active3 beds 3 baths1,417 sq. ft.
423 Bahia Beach Boulevard, RUSKIN, FL 33570
MLS# A4675079Listed by: SUNSET REALTY  $379,990Active4 beds 3 baths2,020 sq. ft.
1382 16th Avenue Se, RUSKIN, FL 33570
MLS# TB8456227Listed by: D R HORTON REALTY OF TAMPA LLC $398,000Active4 beds 3 baths1,799 sq. ft.
2252 Colville Chase Drive, RUSKIN, FL 33570
MLS# A4674541Listed by: LESLIE WELLS REALTY, INC. $69,000Active0.12 Acres
1104 W College Avenue, RUSKIN, FL 33570
MLS# TB8455496Listed by: FLORIDA'S 1ST CHOICE RLTY LLC $350,000Active2 beds 2 baths1,095 sq. ft.
813 Bahia Del Sol Drive #34, RUSKIN, FL 33570
MLS# TB8454961Listed by: RE/MAX BAYSIDE REALTY LLC $322,000Active4 beds 2 baths1,606 sq. ft.
2025 Peaceful Palm Street, RUSKIN, FL 33570
MLS# TB8453394Listed by: EXIT BAYSHORE REALTY
 $849,000Active3 beds 2 baths1,737 sq. ft.
1706 Saffold Park Drive, RUSKIN, FL 33570
MLS# TB8454226Listed by: CENTURY 21 BEGGINS ENTERPRISES $1,500,000Active7 beds 5 baths5,090 sq. ft.
815 NW 2nd Avenue, RUSKIN, FL 33570
MLS# TB8453081Listed by: 54 REALTY LLC $405,990Active5 beds 3 baths2,490 sq. ft.
1649 Sourwood Drive Se, RUSKIN, FL 33570
MLS# TB8453674Listed by: D R HORTON REALTY OF TAMPA LLC $299,990Active3 beds 2 baths1,328 sq. ft.
1210 12 Street Se, RUSKIN, FL 33570
MLS# TB8453685Listed by: D R HORTON REALTY OF TAMPA LLC $327,990Active4 beds 2 baths1,498 sq. ft.
1120 12th Avenue Se, RUSKIN, FL 33570
MLS# TB8453689Listed by: D R HORTON REALTY OF TAMPA LLC $649,900Active1.18 Acres
820 Stephens Road, RUSKIN, FL 33570
MLS# TB8453365Listed by: DALTON WADE INC $315,900Active5 beds 3 baths2,674 sq. ft.
321 Blue Point Drive, RUSKIN, FL 33570
MLS# TB8453297Listed by: LPT REALTY, LLC $600,000Active2 beds 2 baths1,592 sq. ft.
827 Blue Heron Boulevard, RUSKIN, FL 33570
MLS# TB8450120Listed by: KELLER WILLIAMS SUBURBAN TAMPA- Open Sat, 11am to 2pm
 $365,000Active3 beds 3 baths1,417 sq. ft.
559 Bahia Beach Boulevard, RUSKIN, FL 33570
MLS# TB8450216Listed by: KELLER WILLIAMS SUBURBAN TAMPA  $549,999Pending4 beds 4 baths3,053 sq. ft.
5121 Slate Hue Place, APOLLO BEACH, FL 33572
MLS# TB8452993Listed by: TAYLOR MORRISON REALTY OF FL $380,990Active4 beds 3 baths2,020 sq. ft.
1648 Sourwood Drive, RUSKIN, FL 33570
MLS# TB8452753Listed by: D R HORTON REALTY OF TAMPA LLC $344,990Active4 beds 2 baths1,828 sq. ft.
1640 Sourwood Drive, RUSKIN, FL 33570
MLS# TB8452751Listed by: D R HORTON REALTY OF TAMPA LLC $319,900Active3 beds 2 baths1,451 sq. ft.
1735 Ripple Jade Place, RUSKIN, FL 33570
MLS# TB8452584Listed by: JB REALTY FLORIDA, LLC $319,990Active4 beds 2 baths1,498 sq. ft.
1313 Coastal Redwood Court, RUSKIN, FL 33570
MLS# TB8452796Listed by: D R HORTON REALTY OF TAMPA LLC $384,990Active4 beds 3 baths2,336 sq. ft.
1408 16th Avenue Se, RUSKIN, FL 33570
MLS# TB8452784Listed by: D R HORTON REALTY OF TAMPA LLC $389,990Active4 beds 3 baths2,336 sq. ft.
1663 Sourwood Drive Se, RUSKIN, FL 33570
MLS# TB8452787Listed by: D R HORTON REALTY OF TAMPA LLC $399,990Active5 beds 3 baths2,490 sq. ft.
1394 16th Avenue Se, RUSKIN, FL 33570
MLS# TB8452789Listed by: D R HORTON REALTY OF TAMPA LLC $250,000Active3 beds 3 baths1,760 sq. ft.
2009 Hawks View Drive, RUSKIN, FL 33570
MLS# A4671557Listed by: EXP REALTY LLC $159,000Active1 beds 1 baths445 sq. ft.
611 Destiny Dr #310, RUSKIN, FL 33570
MLS# TB8451959Listed by: NIZZ REALTY INC $325,000Active3 beds 3 baths1,704 sq. ft.
2324 Potomac Mark Place, RUSKIN, FL 33570
MLS# TB8450864Listed by: FLORIDA EXPRESS REALTY- Open Sat, 12 to 2pm
 $500,000Active6 beds 3 baths3,010 sq. ft.
2447 Dovesong Trace Drive, RUSKIN, FL 33570
MLS# TB8451390Listed by: KELLER WILLIAMS SUBURBAN TAMPA  $495,000Active4 beds 4 baths2,539 sq. ft.
118 2nd Street Nw, RUSKIN, FL 33570
MLS# TB8452094Listed by: FLORIDA REALTY- Open Sat, 11am to 1pm
 $330,000Active4 beds 2 baths1,832 sq. ft.
507 Powder View Drive, RUSKIN, FL 33570
MLS# TB8450567Listed by: LPT REALTY, LLC  $347,000Active4 beds 3 baths1,797 sq. ft.
915 Cristelle Jean Drive, RUSKIN, FL 33570
MLS# TB8451929Listed by: JASON MITCHELL REAL ESTATE FLO $899,000Pending4 beds 4 baths2,913 sq. ft.
1128 Seagrape Drive, RUSKIN, FL 33570
MLS# TB8450820Listed by: 27NORTH REALTY $400,000Pending5 beds 4 baths3,414 sq. ft.
608 Washita Stone Drive, RUSKIN, FL 33570
MLS# TB8450953Listed by: KELLER WILLIAMS SUBURBAN TAMPA $415,000Active3 beds 3 baths2,615 sq. ft.
626 15th Avenue Nw, RUSKIN, FL 33570
MLS# TB8451672Listed by: CENTURY 21 BEGGINS ENTERPRISES $330,000Active4 beds 3 baths1,963 sq. ft.
702 Cristelle Jean Drive, RUSKIN, FL 33570
MLS# TB8451680Listed by: CENTURY 21 BEGGINS ENTERPRISES $225,000Active2 beds 2 baths1,247 sq. ft.
123 18th Street Nw, RUSKIN, FL 33570
MLS# TB8451645Listed by: EXP REALTY LLC $475,000Active3 beds 3 baths2,010 sq. ft.
411 SW 12th Street, RUSKIN, FL 33570
MLS# TB8451227Listed by: EZ CHOICE REALTY $419,000Active4 beds 2 baths1,935 sq. ft.
889 Calico Scallop Street, RUSKIN, FL 33570
MLS# TB8447538Listed by: KELLER WILLIAMS SOUTH SHORE $385,000Active4 beds 3 baths1,578 sq. ft.
204 E Shell Point Road, RUSKIN, FL 33570
MLS# TB8450870Listed by: RE/MAX REALTY UNLIMITED $346,990Pending4 beds 2 baths1,665 sq. ft.
458 Warm Heron Place, RUSKIN, FL 33570
MLS# TB8451083Listed by: D R HORTON REALTY OF TAMPA LLC $325,000Active4 beds 2 baths1,878 sq. ft.
572 Vista Ridge Drive, RUSKIN, FL 33570
MLS# O6362799Listed by: MARK SPAIN REAL ESTATE $1,595,000Active3 beds 4 baths3,647 sq. ft.
2209 Lost River Trail, RUSKIN, FL 33570
MLS# TB8450151Listed by: KELLER WILLIAMS RLTY NEW TAMPA- Open Sun, 12am to 2pm
 $290,000Active3 beds 2 baths1,568 sq. ft.
1836 Atlantic Drive, RUSKIN, FL 33570
MLS# TB8450032Listed by: GLADIATOR REALTY GROUP LLC  $349,800Active5 beds 3 baths2,264 sq. ft.
2007 Sea Salt Court, RUSKIN, FL 33570
MLS# TB8449877Listed by: 54 REALTY LLC $360,000Active5 beds 3 baths3,321 sq. ft.
1803 Palm Warbler Lane, RUSKIN, FL 33570
MLS# TB8449892Listed by: COMPASS FLORIDA LLC $163,000Active4 beds 3 baths1,676 sq. ft.
1432 Harbour Blue Street, RUSKIN, FL 33570
MLS# TB8449522Listed by: NACA $115,000Pending2 beds 2 baths1,064 sq. ft.
1710 7th Street Sw #67, RUSKIN, FL 33570
MLS# TB8448940Listed by: FATHOM REALTY FL LLC $309,500Active3 beds 2 baths1,451 sq. ft.
872 Olive Conch Street, RUSKIN, FL 33570
MLS# TB8449170Listed by: EXP REALTY LLC $279,990Pending3 beds 3 baths1,464 sq. ft.
455 Warm Heron Place, RUSKIN, FL 33570
MLS# TB8449316Listed by: D R HORTON REALTY OF TAMPA LLC $279,990Active3 beds 3 baths1,464 sq. ft.
459 Warm Heron Place, RUSKIN, FL 33570
MLS# TB8449305Listed by: D R HORTON REALTY OF TAMPA LLC $278,990Pending3 beds 3 baths1,464 sq. ft.
457 Warm Heron Place, RUSKIN, FL 33570
MLS# TB8449313Listed by: D R HORTON REALTY OF TAMPA LLC $289,990Active3 beds 3 baths1,464 sq. ft.
463 Warm Heron Place, RUSKIN, FL 33570
MLS# TB8449279Listed by: D R HORTON REALTY OF TAMPA LLC $289,990Active3 beds 3 baths1,464 sq. ft.
453 Warm Heron Place, RUSKIN, FL 33570
MLS# TB8449290Listed by: D R HORTON REALTY OF TAMPA LLC $279,990Active3 beds 3 baths1,464 sq. ft.
461 Warm Heron Place, RUSKIN, FL 33570
MLS# TB8449296Listed by: D R HORTON REALTY OF TAMPA LLC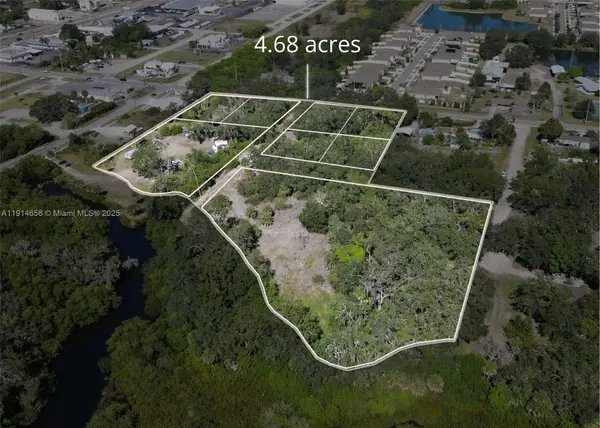 $1,550,000Active4.68 Acres
301 E Shell Point Road, Tampa, FL 33570
MLS# A11914656Listed by: REAL ESTATE SALES FORCE $349,000Pending3 beds 2 baths1,489 sq. ft.
711 Parker Den Drive, RUSKIN, FL 33570
MLS# TB8446390Listed by: FLAT FEE MLS REALTY $314,990Active3 beds 2 baths1,302 sq. ft.
1038 Spotted Egret Loop, RUSKIN, FL 33570
MLS# TB8448442Listed by: D R HORTON REALTY OF TAMPA LLC $334,000Active4 beds 3 baths2,028 sq. ft.
2408 Nighthawk Landing Court, RUSKIN, FL 33570
MLS# TB8442986Listed by: KELLER WILLIAMS SOUTH SHORE $125,000Active2 beds 2 baths1,046 sq. ft.
1710 7th Street Sw #44, RUSKIN, FL 33570
MLS# TB8445593Listed by: FATHOM REALTY FL LLC $289,000Pending4 beds 3 baths1,805 sq. ft.
510 Laguna Mill Drive, RUSKIN, FL 33570
MLS# TB8448298Listed by: CENTURY 21 BEGGINS ENTERPRISES $389,900Active4 beds 3 baths2,264 sq. ft.
2434 Dakota Rock Drive, RUSKIN, FL 33570
MLS# TB8447528Listed by: FUTURE HOME REALTY INC $152,000Active1 beds 1 baths464 sq. ft.
611 Destiny Drive #520, RUSKIN, FL 33570
MLS# TB8447652Listed by: BREWER REALTY- Open Sun, 12 to 3pmNew
 $455,000Active4 beds 2 baths1,897 sq. ft.
304 Cascade Bend Drive, RUSKIN, FL 33570
MLS# TB8462184Listed by: ALIGN RIGHT REALTY LLC  $573,000Active5 beds 5 baths3,283 sq. ft.
2432 Cumberland Cliff Drive, RUSKIN, FL 33570
MLS# TB8419121Listed by: BOARDWALK REALTY ASSOCIATES, LLC $274,900Pending3 beds 2 baths1,400 sq. ft.
927 Windton Oak Drive, RUSKIN, FL 33570
MLS# O6358777Listed by: MAINSTAY BROKERAGE LLC $305,000Active3 beds 2 baths1,676 sq. ft.
1104 Tidal Rock Avenue, RUSKIN, FL 33570
MLS# TB8446778Listed by: STATEWIDE PREMIER PROPERTIES $170,000Active1 beds 1 baths464 sq. ft.
611 Destiny Drive #516, RUSKIN, FL 33570
MLS# TB8446796Listed by: 27NORTH REALTY $390,990Pending4 beds 3 baths2,336 sq. ft.
1679 Sourwood Drive, RUSKIN, FL 33570
MLS# TB8446361Listed by: D R HORTON REALTY OF TAMPA LLC $399,000Active5.2 Acres
1702 30th Street Se, RUSKIN, FL 33570
MLS# A4670021Listed by: LPT REALTY, LLC $369,990Pending4 beds 3 baths2,020 sq. ft.
1671 Sourwood Drive, RUSKIN, FL 33570
MLS# TB8446360Listed by: D R HORTON REALTY OF TAMPA LLC $379,990Active5 beds 3 baths2,490 sq. ft.
1434 16th Avenue Se, RUSKIN, FL 33570
MLS# TB8446362Listed by: D R HORTON REALTY OF TAMPA LLC $309,990Active4 beds 2 baths1,665 sq. ft.
1208 12th Street, RUSKIN, FL 33570
MLS# TB8446364Listed by: D R HORTON REALTY OF TAMPA LLC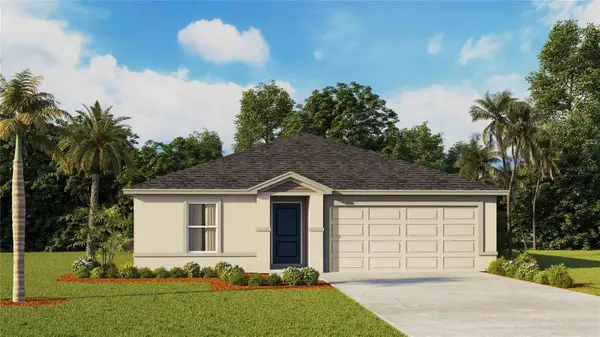 $344,990Pending5 beds 2 baths1,708 sq. ft.
1122 12th Street Se, RUSKIN, FL 33570
MLS# TB8446366Listed by: D R HORTON REALTY OF TAMPA LLC $374,990Pending4 beds 3 baths2,020 sq. ft.
1422 16th Avenue Se, RUSKIN, FL 33570
MLS# TB8446344Listed by: D R HORTON REALTY OF TAMPA LLC $160,000Active1 beds 1 baths308 sq. ft.
611 Destiny Drive #215, RUSKIN, FL 33570
MLS# TB8446228Listed by: 27NORTH REALTY $374,990Pending4 beds 3 baths2,020 sq. ft.
1685 Sourwood Drive, RUSKIN, FL 33570
MLS# TB8446342Listed by: D R HORTON REALTY OF TAMPA LLC $589,000Active3 beds 3 baths2,591 sq. ft.
1025 Seagrape Drive, RUSKIN, FL 33570
MLS# TB8446095Listed by: 27NORTH REALTY $339,990Pending3 beds 2 baths1,560 sq. ft.
462 Warm Heron Place, RUSKIN, FL 33570
MLS# TB8445908Listed by: D R HORTON REALTY OF TAMPA LLC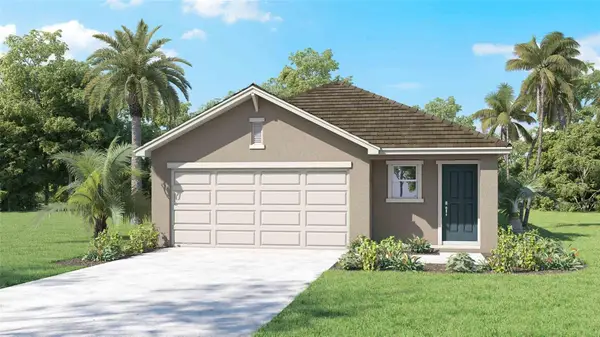 $341,990Pending3 beds 2 baths1,560 sq. ft.
1032 Spotted Egret Loop, RUSKIN, FL 33570
MLS# TB8445911Listed by: D R HORTON REALTY OF TAMPA LLC $324,990Pending3 beds 2 baths1,302 sq. ft.
464 Warm Heron Place, RUSKIN, FL 33570
MLS# TB8445913Listed by: D R HORTON REALTY OF TAMPA LLC $519,900Pending4 beds 3 baths2,672 sq. ft.
302 York Dale Drive, RUSKIN, FL 33570
MLS# TB8445760Listed by: RE/MAX REALTY UNLIMITED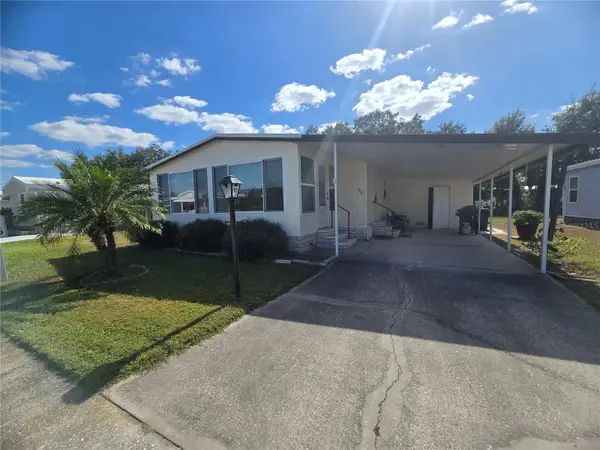 $135,000Active2 beds 2 baths1,120 sq. ft.
1710 7th Street Sw #59, RUSKIN, FL 33570
MLS# TB8445553Listed by: KELLER WILLIAMS SOUTH SHORE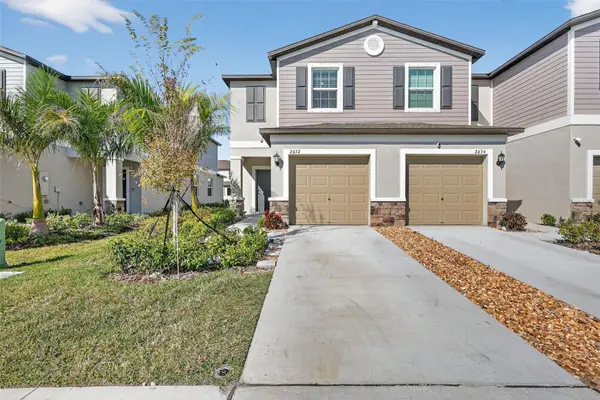 $245,000Pending2 beds 3 baths1,540 sq. ft.
2632 Sunray Venus Way, RUSKIN, FL 33570
MLS# A4671119Listed by: COLDWELL BANKER REALTY $199,000Active3 beds 2 baths1,211 sq. ft.
2820 Metro Drive, RUSKIN, FL 33570
MLS# TB8443301Listed by: MARKET TAMPA LLC $334,900Active4 beds 3 baths2,790 sq. ft.
1303 Alhambra Crest Drive, RUSKIN, FL 33570
MLS# TB8443826Listed by: EXP REALTY LLC $359,990Pending4 beds 3 baths2,336 sq. ft.
1448 16th Avenue Se, RUSKIN, FL 33570
MLS# TB8444515Listed by: D R HORTON REALTY OF TAMPA LLC $141,000Active1 beds 1 baths445 sq. ft.
611 Destiny Drive #304, RUSKIN, FL 33570
MLS# TB8443965Listed by: DALTON WADE INC $334,990Pending5 beds 2 baths1,708 sq. ft.
1315 Coastal Redwood Court, RUSKIN, FL 33570
MLS# TB8444485Listed by: D R HORTON REALTY OF TAMPA LLC $275,000Active3 beds 3 baths1,588 sq. ft.
1035 Seminole Sky Drive, RUSKIN, FL 33570
MLS# TB8443961Listed by: COASTAL PROPERTIES GROUP INTER $319,000Active3 beds 2 baths1,444 sq. ft.
2118 Pleasure Run Drive, RUSKIN, FL 33570
MLS# TB8442108Listed by: LPT REALTY, LLC $999,999Pending4 beds 4 baths3,662 sq. ft.
3523 W Shell Point Road, RUSKIN, FL 33570
MLS# TB8442486Listed by: DALTON WADE INC $310,000Active3 beds 2 baths1,492 sq. ft.
114 Eagle Summit Drive, RUSKIN, FL 33570
MLS# TB8443110Listed by: KELLER WILLIAMS RLTY NEW TAMPA $400,000Active4 beds 3 baths2,890 sq. ft.
1015 Golden Shiner Avenue, RUSKIN, FL 33570
MLS# TB8443909Listed by: ALIGN RIGHT REALTY RIVERVIEW $464,990Active4 beds 3 baths2,638 sq. ft.
1507 Mira Lago Circle, RUSKIN, FL 33570
MLS# TB8439678Listed by: JOE WALKER REALTY LLC $379,000Active4 beds 3 baths2,045 sq. ft.
1110 Lauren Manor Loop, RUSKIN, FL 33570
MLS# TB8443754Listed by: CENTURY 21 BEGGINS $254,900Active3 beds 3 baths2,617 sq. ft.
2509 River Briar Boulevard, RUSKIN, FL 33570
MLS# TB8443632Listed by: COLDWELL BANKER REALTY $320,000Active4 beds 2 baths1,612 sq. ft.
1132 Shared Passion Street, RUSKIN, FL 33570
MLS# TB8442542Listed by: KELLER WILLIAMS SOUTH SHORE $265,000Active3 beds 1 baths1,275 sq. ft.
412 13th Street Ne, RUSKIN, FL 33570
MLS# TB8442648Listed by: JEFFREY GOULD REAL ESTATE LLC $435,000Pending1.89 Acres
Lost River Trail, RUSKIN, FL 33570
MLS# TB8441399Listed by: ROBERT SLACK LLC $409,900Active4 beds 3 baths3,016 sq. ft.
1762 Mira Lago Circle, RUSKIN, FL 33570
MLS# O6340639Listed by: MAINSTAY BROKERAGE LLC $289,000Active3 beds 2 baths1,708 sq. ft.
1108 Wynnmere Meadow Place, RUSKIN, FL 33570
MLS# TB8440942Listed by: COLDWELL BANKER REALTY- Open Sun, 11am to 2pm
 $289,999Active3 beds 3 baths1,796 sq. ft.
736 Royal Empress Drive, RUSKIN, FL 33570
MLS# TB8441326Listed by: FLORIDA EXECUTIVE REALTY  $350,000Active5 beds 4 baths2,255 sq. ft.
1055 Seminole Sky Drive, RUSKIN, FL 33570
MLS# TB8441710Listed by: DALTON WADE INC $309,000Active4 beds 2 baths1,881 sq. ft.
714 Griffen Heights Court, RUSKIN, FL 33570
MLS# A4669941Listed by: COUNTREEWIDE REALTY INC $449,000Active2 beds 2 baths1,232 sq. ft.
105 E North Branch Road, RUSKIN, FL 33570
MLS# TB8441147Listed by: DALTON WADE INC $363,999Active4 beds 3 baths2,579 sq. ft.
1601 Climbing Dayflower Drive, RUSKIN, FL 33570
MLS# TB8440743Listed by: PINEYWOODS REALTY LLC $190,000Active1 beds 1 baths464 sq. ft.
611 Destiny Drive #501, RUSKIN, FL 33570
MLS# TB8438567Listed by: CHARLES RUTENBERG REALTY INC $623,500Active5 beds 3 baths3,711 sq. ft.
2429 Cumberland Cliff Drive, RUSKIN, FL 33570
MLS# TB8441003Listed by: RE/MAX REALTY UNLIMITED $99,500Active0.15 Acres
2603 Goldwyn Drive, RUSKIN, FL 33570
MLS# TB8440930Listed by: CENTURY 21 BEGGINS ENTERPRISES $294,900Pending3 beds 2 baths1,705 sq. ft.
430 Stone Briar Drive, RUSKIN, FL 33570
MLS# TB8440848Listed by: EXP REALTY LLC $299,900Active3 beds 3 baths1,785 sq. ft.
714 Barclay Wood Drive, RUSKIN, FL 33570
MLS# TB8440042Listed by: HOMEXPRESS REALTY, INC. $249,900Pending3 beds 2 baths1,296 sq. ft.
2403 Metro Drive, RUSKIN, FL 33570
MLS# TB8440470Listed by: RE/MAX REALTY UNLIMITED $99,500Active0.16 Acres
2601 Goldwyn Drive, RUSKIN, FL 33570
MLS# TB8440706Listed by: CENTURY 21 BEGGINS ENTERPRISES $346,990Pending4 beds 2 baths1,665 sq. ft.
504 Warm Heron Place, RUSKIN, FL 33570
MLS# TB8439710Listed by: D R HORTON REALTY OF TAMPA LLC $489,900Active4 beds 4 baths2,798 sq. ft.
1027 Ocean Spray Drive, RUSKIN, FL 33570
MLS# TB8438269Listed by: KELLER WILLIAMS SOUTH SHORE $91,700Active0.23 Acres
201 6th Street Nw, RUSKIN, FL 33570
MLS# TB8439623Listed by: GREAT WESTERN REALTY $75,000Active0.18 Acres
Sable Cove, RUSKIN, FL 33570
MLS# TB8439435Listed by: TURNING LEAF REALTY $599,000Active3 beds 3 baths2,447 sq. ft.
2636 Yellow Sundial Loop, RUSKIN, FL 33570
MLS# TB8439184Listed by: CENTURY 21 BEGGINS ENTERPRISES $309,999Active4 beds 2 baths1,846 sq. ft.
813 18th Avenue Se, RUSKIN, FL 33570
MLS# TB8438916Listed by: MARK SPAIN REAL ESTATE $259,990Pending4 beds 2 baths1,586 sq. ft.
2018 Peaceful Palm Street, RUSKIN, FL 33570
MLS# V4945423Listed by: KARIZA CAPITAL REALTY, LLC $414,000Active3 beds 3 baths2,085 sq. ft.
602 10th Street Sw, RUSKIN, FL 33570
MLS# TB8437635Listed by: DALTON WADE INC $495,000Pending9 beds 9 baths892 sq. ft.
1210 Sweeney Drive, RUSKIN, FL 33570
MLS# TB8437965Listed by: PREMIER REALTY OF TAMPA $325,000Active4 beds 2 baths1,935 sq. ft.
1816 Moon Cactus, RUSKIN, FL 33570
MLS# TB8435645Listed by: INSPIRED REALTY, LLC $299,900Pending4 beds 3 baths2,486 sq. ft.
1706 Bonita Bluff Court, RUSKIN, FL 33570
MLS# O6340989Listed by: MAINSTAY BROKERAGE LLC $1,399,000Active2.38 Acres
2701 Metro Drive, RUSKIN, FL 33570
MLS# TB8437000Listed by: MILITARY FIRST REAL ESTATE LLC $569,000Active3 beds 2 baths1,629 sq. ft.
828 Blue Heron Boulevard, RUSKIN, FL 33570
MLS# TB8436591Listed by: PEOPLE'S CHOICE REALTY SVC LLC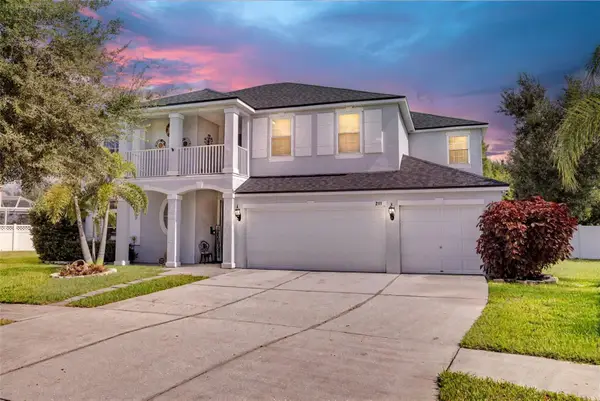 $584,800Active5 beds 4 baths3,505 sq. ft.
2111 Colville Chase Drive, RUSKIN, FL 33570
MLS# W7879750Listed by: RE/MAX ALLIANCE GROUP $340,000Active4 beds 2 baths1,632 sq. ft.
1426 Blossom Bayou Circle, RUSKIN, FL 33570
MLS# TB8435878Listed by: RE/MAX REALTY UNLIMITED $244,000Active3 beds 3 baths1,707 sq. ft.
762 Barclay Wood Drive, RUSKIN, FL 33570
MLS# TB8435966Listed by: FATHOM REALTY FL LLC $135,000Active1 beds 1 baths322 sq. ft.
611 Destiny Drive #116, RUSKIN, FL 33570
MLS# TB8435786Listed by: JACK KELLER INC $183,000Active3 beds 1 baths1,628 sq. ft.
4339 Old Us Highway 41, RUSKIN, FL 33570
MLS# TB8435238Listed by: ALIGN RIGHT REALTY LLC $469,900Active4 beds 3 baths2,349 sq. ft.
506 3rd Avenue Se, RUSKIN, FL 33570
MLS# TB8434049Listed by: ALIGN RIGHT REALTY LLC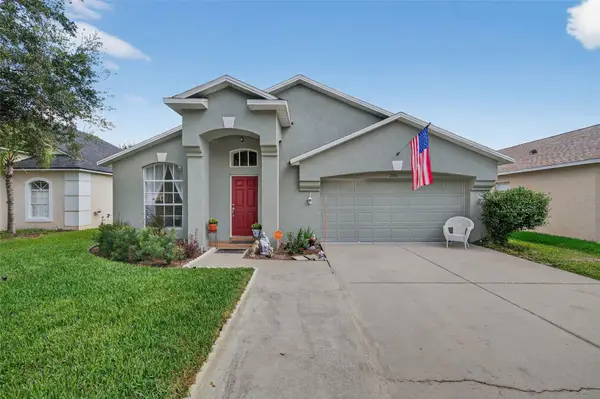 $325,000Active3 beds 2 baths1,400 sq. ft.
2326 Potomac Mark Place, RUSKIN, FL 33570
MLS# L4956250Listed by: DALTON WADE INC $514,999Pending3 beds 3 baths2,652 sq. ft.
720 Steel Drive, APOLLO BEACH, FL 33572
MLS# A4667295Listed by: TAYLOR MORRISON RLTY OF FLA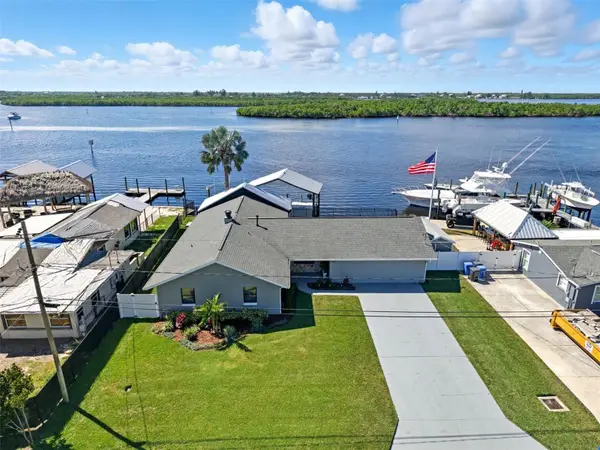 $1,450,000Active3 beds 3 baths3,100 sq. ft.
3422 W Shell Point Road, RUSKIN, FL 33570
MLS# TB8430997Listed by: YELLOWFIN REALTY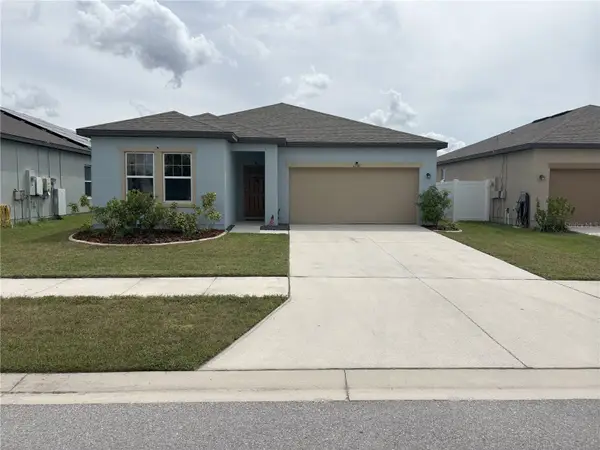 $300,000Active3 beds 2 baths1,784 sq. ft.
1238 Anchor Bend Drive, RUSKIN, FL 33570
MLS# TB8432159Listed by: CLASSIC REAL ESTATE $340,000Active4 beds 3 baths2,500 sq. ft.
609 Tanana Fall Drive, RUSKIN, FL 33570
MLS# TB8426713Listed by: KELLER WILLIAMS SUBURBAN TAMPA $399,000Active4 beds 3 baths2,210 sq. ft.
1833 Mira Lago Circle, RUSKIN, FL 33570
MLS# TB8432914Listed by: EXP REALTY LLC $598,500Active4 beds 4 baths3,858 sq. ft.
205 Orange Mill Ave, RUSKIN, FL 33570
MLS# TB8433326Listed by: RE/MAX BAYSIDE REALTY LLC $285,000Active4 beds 2 baths2,403 sq. ft.
601 8th Court Se, RUSKIN, FL 33570
MLS# TB8447670Listed by: CENTURY 21 BEGGINS ENTERPRISES $324,900Active4 beds 2 baths1,425 sq. ft.
2328 Pleasure Run Drive, RUSKIN, FL 33570
MLS# TB8430638Listed by: PROPERTY SCHOLARS REALTY & DEV $278,990Pending3 beds 3 baths1,464 sq. ft.
1013 Spotted Egret Loop, RUSKIN, FL 33570
MLS# TB8432284Listed by: D R HORTON REALTY OF TAMPA LLC $389,990Pending5 beds 3 baths2,490 sq. ft.
1693 Sourwood Drive, RUSKIN, FL 33570
MLS# TB8431848Listed by: D R HORTON REALTY OF TAMPA LLC $320,000Active4 beds 3 baths2,152 sq. ft.
1147 Anchor Bend Drive, RUSKIN, FL 33570
MLS# TB8429799Listed by: ALIGN RIGHT REALTY RIVERVIEW $364,990Pending4 beds 3 baths2,020 sq. ft.
1476 16th Avenue Se, RUSKIN, FL 33570
MLS# TB8431839Listed by: D R HORTON REALTY OF TAMPA LLC $389,900Active4 beds 3 baths2,289 sq. ft.
1022 Kelly Fern Loop, RUSKIN, FL 33570
MLS# O6346772Listed by: YOU HAVE REALTY LLC $415,000Active4 beds 3 baths2,653 sq. ft.
1516 Yale Castle Court, RUSKIN, FL 33570
MLS# TB8430482Listed by: COLDWELL BANKER REALTY $300,000Pending4 beds 3 baths1,672 sq. ft.
1402 Delano Trent Street, RUSKIN, FL 33570
MLS# TB8430057Listed by: REAL BROKER, LLC $325,000Pending5 beds 3 baths3,305 sq. ft.
1505 Oak Pond Street, RUSKIN, FL 33570
MLS# TB8430031Listed by: GAVIN REALTY INC. $250,000Active0.94 Acres
1520 21st Avenue Se, RUSKIN, FL 33570
MLS# TB8429413Listed by: HOMETRUST REALTY GROUP $336,000Active4 beds 3 baths2,442 sq. ft.
1806 Oak Pond Street, RUSKIN, FL 33570
MLS# TB8427603Listed by: KELLER WILLIAMS SUBURBAN TAMPA- Open Sat, 12 to 2pmNew
 $325,000Active3 beds 2 baths2,136 sq. ft.
427 Stone Briar Drive, RUSKIN, FL 33570
MLS# TB8461334Listed by: KELLER WILLIAMS SUBURBAN TAMPA  $714,900Active4 beds 4 baths2,913 sq. ft.
1041 Seagrape Drive, RUSKIN, FL 33570
MLS# TB8429011Listed by: RE/MAX REALTY UNLIMITED $255,000Active3 beds 2 baths1,265 sq. ft.
814 Fern Leaf Drive, RUSKIN, FL 33570
MLS# TB8429164Listed by: KELLER WILLIAMS ST PETE REALTY $405,000Active3 beds 3 baths1,560 sq. ft.
3212 Byrd Nest Lane, RUSKIN, FL 33570
MLS# A4665242Listed by: KW COASTAL LIVING II $274,900Active3 beds 2 baths1,320 sq. ft.
2350 Richwood Pike Drive, RUSKIN, FL 33570
MLS# TB8428478Listed by: SUNCOAST REALTY SOLUTIONS, LLC $359,900Active5 beds 3 baths2,415 sq. ft.
566 Sunlit Coral Street, RUSKIN, FL 33570
MLS# O6341996Listed by: ERIZIA REALTY INVESTMENTS $269,990Pending3 beds 3 baths1,464 sq. ft.
1009 Spotted Egret Loop, RUSKIN, FL 33570
MLS# TB8428287Listed by: D R HORTON REALTY OF TAMPA LLC $274,990Pending3 beds 3 baths1,464 sq. ft.
1011 Spotted Egret Loop, RUSKIN, FL 33570
MLS# TB8428293Listed by: D R HORTON REALTY OF TAMPA LLC $359,000Active4 beds 2 baths1,935 sq. ft.
1754 Fred Ives Street, RUSKIN, FL 33570
MLS# TB8427309Listed by: HOMETRUST REALTY GROUP $289,990Pending3 beds 3 baths1,464 sq. ft.
1015 Spotted Egret Loop, RUSKIN, FL 33570
MLS# TB8427981Listed by: D R HORTON REALTY OF TAMPA LLC $290,990Pending3 beds 3 baths1,464 sq. ft.
1005 Spotted Egret Loop, RUSKIN, FL 33570
MLS# TB8427976Listed by: D R HORTON REALTY OF TAMPA LLC $1,275,000Active3 beds 4 baths3,220 sq. ft.
308 Manatee Drive, RUSKIN, FL 33570
MLS# P4936244Listed by: STAR REALTY OF WINTER HAVEN $310,000Active3 beds 2 baths1,428 sq. ft.
204 7th Avenue Nw, RUSKIN, FL 33570
MLS# TB8425783Listed by: COLDWELL BANKER REALTY $840,000Active4 beds 4 baths2,869 sq. ft.
3027 Bermuda Sloop Circle, RUSKIN, FL 33570
MLS# TB8426441Listed by: COMPASS FLORIDA LLC $269,900Active3 beds 2 baths1,463 sq. ft.
2310 Pleasure Run Drive, RUSKIN, FL 33570
MLS# TB8425431Listed by: KELLER WILLIAMS SOUTH SHORE $289,900Active4 beds 2 baths1,845 sq. ft.
1739 Chatham Green Circle, RUSKIN, FL 33570
MLS# TB8426439Listed by: FUTURE HOME REALTY INC- Open Sun, 11am to 1pm
 $429,000Active4 beds 4 baths2,820 sq. ft.
528 Ocean Spray Drive, RUSKIN, FL 33570
MLS# TB8425549Listed by: LPT REALTY, LLC  $210,000Active0.25 Acres
1st Street Ne, RUSKIN, FL 33570
MLS# O6341421Listed by: SELECTED HOMES REALTY LLC $350,000Active5 beds 3 baths2,522 sq. ft.
476 Olive Conch Street, RUSKIN, FL 33570
MLS# TB8421485Listed by: TRUENEST PROPERTY MANAGEMENT TAMPA BAY $310,000Active3 beds 2 baths1,676 sq. ft.
1014 Coastal Hammock Avenue, RUSKIN, FL 33570
MLS# A4663780Listed by: KW COASTAL LIVING III $674,990Active4.6 Acres
1142 SE 12th Street, RUSKIN, FL 33570
MLS# TB8423879Listed by: LPT REALTY, LLC $645,000Active3 beds 4 baths2,271 sq. ft.
820 Blue Heron Boulevard, RUSKIN, FL 33570
MLS# TB8423423Listed by: KELLER WILLIAMS SUBURBAN TAMPA $445,000Pending4 beds 3 baths1,914 sq. ft.
808 Nutmeg Spice Place, RUSKIN, FL 33570
MLS# TB8423397Listed by: WEST COAST REAL ESTATE OF TAMPA, LLC $269,000Active3 beds 3 baths1,796 sq. ft.
843 Royal Empress Drive, RUSKIN, FL 33570
MLS# TB8421247Listed by: DALTON WADE INC $390,000Active2 beds 2 baths1,095 sq. ft.
826 Bahia Del Sol Drive #56, RUSKIN, FL 33570
MLS# TB8420836Listed by: PINEYWOODS REALTY LLC $316,990Pending3 beds 3 baths1,758 sq. ft.
264 Royal Spoonbill Drive, RUSKIN, FL 33570
MLS# TB8420892Listed by: D R HORTON REALTY OF TAMPA LLC $284,990Pending3 beds 3 baths1,673 sq. ft.
260 Royal Spoonbill Drive, RUSKIN, FL 33570
MLS# TB8420885Listed by: D R HORTON REALTY OF TAMPA LLC $284,990Pending3 beds 3 baths1,673 sq. ft.
262 Royal Spoonbill Drive, RUSKIN, FL 33570
MLS# TB8364705Listed by: D R HORTON REALTY OF TAMPA LLC $263,000Active3 beds 2 baths1,372 sq. ft.
963 Sunlit Coral Street, RUSKIN, FL 33570
MLS# TB8419558Listed by: FLORIDA REALTY INVESTMENTS $250,000Active3 beds 2 baths1,873 sq. ft.
1501 12th Street Ne, RUSKIN, FL 33570
MLS# TB8419344Listed by: LPT REALTY, LLC $229,900Active1.3 Acres
Smilodon Trail, RUSKIN, FL 33570
MLS# TB8418968Listed by: MARKET TAMPA LLC $67,000Active0.17 Acres
2508 Goldwyn Drive, RUSKIN, FL 33570
MLS# TB8411122Listed by: EXP REALTY LLC $399,990Pending4 beds 3 baths2,336 sq. ft.
1692 Sourwood Drive, RUSKIN, FL 33570
MLS# TB8417939Listed by: D R HORTON REALTY OF TAMPA LLC $1,649,000Active4 beds 4 baths3,517 sq. ft.
3016 Christophers Watch Lane, RUSKIN, FL 33570
MLS# TB8417074Listed by: FRANK ALBERT REALTY $415,000Pending2 beds 2 baths1,002 sq. ft.
1727 30th Street Se, RUSKIN, FL 33570
MLS# TB8404212Listed by: BINGHAM REALTY INC $525,000Active0.26 Acres
3322 W Shell Point Road #B, RUSKIN, FL 33570
MLS# TB8399626Listed by: EZ CHOICE REALTY $169,900Active1 beds 1 baths322 sq. ft.
611 Destiny Drive, RUSKIN, FL 33570
MLS# TB8411554Listed by: KELLER WILLIAMS SOUTH SHORE $582,900Active4 beds 3 baths2,125 sq. ft.
901 8th Ave Sw, RUSKIN, FL 33570
MLS# TB8415326Listed by: RE/MAX BAYSIDE REALTY LLC $199,900Active4 beds 2 baths2,183 sq. ft.
110 14th Street Se, RUSKIN, FL 33570
MLS# TB8415107Listed by: DALTON WADE INC $3,600,000Active20 beds 19 baths13,835 sq. ft.
1800 Kofresi Court, RUSKIN, FL 33570
MLS# O6333255Listed by: SUGDEN REAL ESTATE $320,000Active4 beds 2 baths1,839 sq. ft.
616 Chatham Walk Drive, RUSKIN, FL 33570
MLS# TB8414997Listed by: CHARLES RUTENBERG REALTY INC- Open Sat, 10am to 5pm
 $444,999Active5 beds 4 baths2,209 sq. ft.
811 Steel Drive, APOLLO BEACH, FL 33572
MLS# TB8415097Listed by: TAYLOR MORRISON REALTY OF FL  $799,000Active10 beds 6 baths3,837 sq. ft.
1603 W Shell Point Road, RUSKIN, FL 33570
MLS# TB8413715Listed by: EZ CHOICE REALTY $235,000Active2 beds 3 baths1,491 sq. ft.
1984 Hawks View Drive, RUSKIN, FL 33570
MLS# TB8414509Listed by: MARK SPAIN REAL ESTATE $320,000Active3 beds 2 baths1,555 sq. ft.
149 Cascade Bend Drive, RUSKIN, FL 33570
MLS# TB8412597Listed by: COLDWELL BANKER REALTY $358,500Active3 beds 1 baths1,132 sq. ft.
602 8th Court Se, RUSKIN, FL 33570
MLS# TB8413391Listed by: DREAM HOMES REALTY- $140,000Active1 beds 1 baths308 sq. ft.
611 Destiny Drive #210, RUSKIN, FL 33570
MLS# TB8393044Listed by: RE/MAX BAYSIDE REALTY LLC  $375,000Active3 beds 2 baths2,082 sq. ft.
2239 Roanoke Springs Drive, RUSKIN, FL 33570
MLS# TB8410813Listed by: COLDWELL BANKER REALTY $469,999Pending4 beds 3 baths2,394 sq. ft.
840 Steel Drive, APOLLO BEACH, FL 33572
MLS# TB8410130Listed by: TAYLOR MORRISON REALTY OF FL $389,900Active4 beds 3 baths2,289 sq. ft.
1038 Kelly Fern Loop, RUSKIN, FL 33570
MLS# TB8395971Listed by: DALTON WADE INC $546,514Active4 beds 3 baths2,394 sq. ft.
5127 Slate Hue Place, APOLLO BEACH, FL 33572
MLS# TB8409971Listed by: TAYLOR MORRISON REALTY OF FL $339,900Active4 beds 2 baths1,935 sq. ft.
769 Calico Scallop Street, RUSKIN, FL 33570
MLS# TB8407667Listed by: FUTURE HOME REALTY INC $279,900Pending3 beds 2 baths1,676 sq. ft.
802 Ace Outlaw Avenue, RUSKIN, FL 33570
MLS# TB8408895Listed by: DALTON WADE INC $367,000Active3 beds 2 baths1,688 sq. ft.
501 Delwood Breck Street, RUSKIN, FL 33570
MLS# TB8408459Listed by: DALTON WADE INC $529,000Active4 beds 3 baths3,005 sq. ft.
443 York Dale Drive, RUSKIN, FL 33570
MLS# TB8408028Listed by: EZ CHOICE MLS, INC $394,999Active3 beds 3 baths1,790 sq. ft.
765 Steel Drive, APOLLO BEACH, FL 33572
MLS# TB8407381Listed by: TAYLOR MORRISON REALTY OF FL $389,999Pending3 beds 3 baths1,790 sq. ft.
809 Steel Drive, APOLLO BEACH, FL 33572
MLS# TB8407361Listed by: TAYLOR MORRISON REALTY OF FL $799,000Active4 beds 4 baths4,400 sq. ft.
404 Dickman Drive Sw, RUSKIN, FL 33570
MLS# TB8406999Listed by: LPT REALTY, LLC $799,000Active2 beds 2 baths1,940 sq. ft.
102 W North Branch Road, RUSKIN, FL 33570
MLS# TB8404370Listed by: FATHOM REALTY FL LLC $69,000Pending2 beds 2 baths984 sq. ft.
1710 7th Street Sw #82, RUSKIN, FL 33570
MLS# TB8398582Listed by: FATHOM REALTY FL LLC $349,000Active5 beds 4 baths2,180 sq. ft.
1112 Seminole Sky Drive, RUSKIN, FL 33570
MLS# TB8402580Listed by: BANYAN RESIDENTIAL GROUP, LLC $1,325,000Active3 beds 3 baths2,807 sq. ft.
3036 Christophers Watch Lane, RUSKIN, FL 33570
MLS# TB8402638Listed by: EXP REALTY LLC $225,000Active0.19 Acres
W Shell Point Road, RUSKIN, FL 33570
MLS# TB8403034Listed by: EZ CHOICE REALTY $315,000Pending3 beds 3 baths1,845 sq. ft.
2118 Song Sparrow Court, RUSKIN, FL 33570
MLS# A4656827Listed by: REALTY HUB $309,000Active3 beds 3 baths1,810 sq. ft.
1821 Hawks View Drive, RUSKIN, FL 33570
MLS# TB8398035Listed by: KELLER WILLIAMS SOUTH SHORE $195,000Active3 beds 2 baths792 sq. ft.
2603 Ince Drive, RUSKIN, FL 33570
MLS# TB8401409Listed by: MARKET TAMPA LLC $455,000Active4 beds 3 baths2,735 sq. ft.
2637 Yukon Cliff Drive, RUSKIN, FL 33570
MLS# TB8386017Listed by: COLDWELL BANKER REALTY $319,000Active2 beds 2 baths1,100 sq. ft.
809 Bahia Del Sol Drive #72, RUSKIN, FL 33570
MLS# TB8396504Listed by: RE/MAX ACTION FIRST OF FLORIDA $314,990Pending4 beds 2 baths1,498 sq. ft.
1217 Cape Chestnut Place, RUSKIN, FL 33570
MLS# TB8397533Listed by: D R HORTON REALTY OF TAMPA LLC $479,000Active5 beds 3 baths3,347 sq. ft.
1314 Oak Pond Street, RUSKIN, FL 33570
MLS# L4957147Listed by: THE STONES REAL ESTATE FIRM $365,000Active4 beds 3 baths2,635 sq. ft.
1655 Blue Rose Drive, RUSKIN, FL 33570
MLS# TB8395432Listed by: EXP REALTY LLC $399,000Active3 beds 2 baths1,826 sq. ft.
301 Carlyle Boulevard, RUSKIN, FL 33570
MLS# TB8455199Listed by: LPT REALTY, LLC $449,999Pending4 beds 4 baths2,209 sq. ft.
719 Steel Drive, APOLLO BEACH, FL 33572
MLS# TB8396320Listed by: TAYLOR MORRISON REALTY OF FL $5,000Active4 beds 3 baths2,732 sq. ft.
556 19th Street Nw, Ruskin, FL 33570
MLS# 1048533Listed by: JAIME L BOONE LLC $469,000Active4 beds 3 baths2,672 sq. ft.
1829 Mira Lago Circle, RUSKIN, FL 33570
MLS# O6315011Listed by: FEYAS FLORIDA REALTY LLC- Open Sat, 10am to 5pm
 $526,999Active4 beds 4 baths2,600 sq. ft.
714 Sky Shade Drive, APOLLO BEACH, FL 33572
MLS# TB8390883Listed by: TAYLOR MORRISON REALTY OF FL  $155,000Active3 beds 2 baths1,493 sq. ft.
1710 7th Street Sw #85, RUSKIN, FL 33570
MLS# TB8389820Listed by: FATHOM REALTY FL LLC $325,000Pending3 beds 2 baths1,315 sq. ft.
314 Dickman Drive Sw, RUSKIN, FL 33570
MLS# TB8390297Listed by: WEST COAST REAL ESTATE OF TAMPA, LLC $164,000Active1 beds 1 baths464 sq. ft.
611 Destiny Dr #509, RUSKIN, FL 33570
MLS# TB8390051Listed by: RE/MAX BAYSIDE REALTY LLC $850,000Active4 beds 4 baths1,968 sq. ft.
1114 27th Street Se #A, RUSKIN, FL 33570
MLS# TB8385024Listed by: EZ CHOICE REALTY $885,000Active1 Acres
3312 W Shell Point Road, RUSKIN, FL 33570
MLS# TB8389115Listed by: SIGNATURE REALTY ASSOCIATES $389,900Active4 beds 3 baths2,584 sq. ft.
1876 Colding Drive, RUSKIN, FL 33570
MLS# TB8382267Listed by: HOMEXPRESS REALTY, INC. $340,000Active4 beds 2 baths1,841 sq. ft.
742 8th Street Nw, RUSKIN, FL 33570
MLS# TB8387529Listed by: OLIVER MOSLEY REALTY INC $309,900Active4 beds 2 baths1,939 sq. ft.
2216 4th Street Sw, RUSKIN, FL 33570
MLS# TB8386284Listed by: BRIDGE HOMES $290,000Active3 beds 2 baths1,092 sq. ft.
404 12th Street Sw, RUSKIN, FL 33570
MLS# TB8385284Listed by: RE/MAX REALTY UNLIMITED $999,000Pending4 beds 4 baths2,913 sq. ft.
3122 Christophers Watch Lane, RUSKIN, FL 33570
MLS# TB8384658Listed by: EXP REALTY LLC $390,000Active6 beds 3 baths2,614 sq. ft.
413 Royal Empress Drive, RUSKIN, FL 33570
MLS# TB8381293Listed by: COLDWELL BANKER REALTY $799,000Pending3 beds 3 baths2,496 sq. ft.
100 18th Street Nw, RUSKIN, FL 33570
MLS# TB8383446Listed by: KELLER WILLIAMS SOUTH SHORE $348,750Active4 beds 3 baths2,622 sq. ft.
1401 Parker Den Drive, RUSKIN, FL 33570
MLS# L4952771Listed by: LA ROSA REALTY PRESTIGE $425,000Pending3 beds 3 baths2,483 sq. ft.
1657 Bonita Bluff Court, RUSKIN, FL 33570
MLS# A4651207Listed by: BERKSHIRE HATHAWAY HOMESERVICE $475,000Active3.18 Acres
962 E Shell Pointe Road, RUSKIN, FL 33570
MLS# O6305977Listed by: COMPASS FLORIDA LLC $305,000Active4 beds 2 baths1,788 sq. ft.
309 Blue Point Drive, RUSKIN, FL 33570
MLS# A4650998Listed by: PREFERRED SHORE LLC $420,000Active6 beds 3 baths3,362 sq. ft.
1739 Broad Winged Hawk Drive, RUSKIN, FL 33570
MLS# OM700808Listed by: HELPFUL SALE LLC $599,900Active3 beds 3 baths2,591 sq. ft.
1025 Seagrape Drive, RUSKIN, FL 33570
MLS# TB8379132Listed by: FLORIDA'S 1ST CHOICE RLTY LLC $349,990Pending4 beds 3 baths2,584 sq. ft.
1823 Moon Cactus Court, RUSKIN, FL 33570
MLS# TB8379520Listed by: LPT REALTY, LLC $259,000Active2 beds 1 baths1,028 sq. ft.
119 18th Street Nw, RUSKIN, FL 33570
MLS# TB8378138Listed by: CENTURY 21 COAST TO COAST $389,000Active2 beds 3 baths1,258 sq. ft.
3248 Mangrove Point Drive, RUSKIN, FL 33570
MLS# A4649291Listed by: EXP REALTY LLC $399,900Pending4 beds 2 baths1,846 sq. ft.
511 York Dale Drive, RUSKIN, FL 33570
MLS# TB8372149Listed by: RE/MAX ACTION FIRST OF FLORIDA $265,900Active3 beds 3 baths1,796 sq. ft.
633 Royal Empress Drive, RUSKIN, FL 33570
MLS# A4647086Listed by: EXP REALTY LLC $255,900Active3 beds 3 baths1,707 sq. ft.
708 Barclay Wood Drive, RUSKIN, FL 33570
MLS# TB8361543Listed by: KELLER WILLIAMS SOUTH SHORE $393,900Active4 beds 3 baths2,563 sq. ft.
627 Washita Stone Drive, RUSKIN, FL 33570
MLS# TB8367857Listed by: BHHS FLORIDA PROPERTIES GROUP $749,900Active3 beds 2 baths1,655 sq. ft.
109 Carmelina Street, RUSKIN, FL 33570
MLS# TB8366706Listed by: KELLER WILLIAMS SOUTH SHORE $110,000Active2 beds 1 baths984 sq. ft.
1710 7th Street Sw #24, RUSKIN, FL 33570
MLS# TB8365762Listed by: FATHOM REALTY FL LLC $99,000Active0.39 Acres
0 11th Street Sw, RUSKIN, FL 33570
MLS# TB8366394Listed by: KELLER WILLIAMS SOUTH SHORE
Local realty services provided by:CENTURY 21 Link Realty, Inc., CENTURY 21 Myers Realty, CENTURY 21 Lighthouse Realty, CENTURY 21 North East
The information being provided by Stellar Mls is for the consumer's personal, non-commercial use and may not be used for any purpose other than to identify prospective properties consumer may be interested in purchasing. Any information relating to real estate for sale referenced on this web site comes from the Internet Data Exchange (IDX) program of the Stellar Mls. CENTURY 21 Link Realty, Inc. is not a Multiple Listing Service (MLS), nor does it offer MLS access. This website is a service of CENTURY 21 Link Realty, Inc., a broker participant of Stellar Mls. This web site may reference real estate listing(s) held by a brokerage firm other than the broker and/or agent who owns this web site.
The accuracy of all information, regardless of source, including but not limited to open house information, square footages and lot sizes, is deemed reliable but not guaranteed and should be personally verified through personal inspection by and/or with the appropriate professionals. The data contained herein is copyrighted by Stellar Mls and is protected by all applicable copyright laws. Any unauthorized dissemination of this information is in violation of copyright laws and is strictly prohibited.
Properties in listings may have been sold or may no longer be available.
Copyright 2026 Stellar Mls. All rights reserved.
Information deemed reliable but not guaranteed. Information is provided, in part, by Brevard MLS. This information being provided is for consumer's personal, non-commercial use and may not be used for any other purpose other than to identify prospective properties consumers may be interested in purchasing.
Information deemed reliable but not guaranteed. Information is provided, in part, by Greater Miami MLS. This information being provided is for consumer's personal, non-commercial use and may not be used for any other purpose other than to identify prospective properties consumers may be interested in purchasing.
Neighborhoods near Ruskin, FL
Zip codes near Ruskin, FL
- 33534 properties for sale
- 33569 properties for sale
- 33570 properties for sale
- 33572 properties for sale
- 33573 properties for sale
- 33578 properties for sale
- 33579 properties for sale
- 33598 properties for sale
- 33611 properties for sale
- 33616 properties for sale
- 33619 properties for sale
- 33701 properties for sale
- 33703 properties for sale
- 33704 properties for sale
- 33705 properties for sale
- 34212 properties for sale
- 34219 properties for sale
- 34221 properties for sale
- 34222 properties for sale
- 34250 properties for sale
Popular searches near Ruskin, FL
- Apollo Beach properties for sale
- Balm properties for sale
- Bloomingdale properties for sale
- Brandon properties for sale
- Ellenton properties for sale
- Fish Hawk properties for sale
- Gibsonton properties for sale
- Memphis properties for sale
- Palm River-Clair Mel properties for sale
- Palm River-Gibsonton properties for sale
- Palmetto properties for sale
- Parrish properties for sale
- Progress Village properties for sale
- Riverview properties for sale
- St. Petersburg properties for sale
- Samoset properties for sale
- Sun City Center properties for sale
- Terra Ceia properties for sale
- Wimauma properties for sale
- Wimauma-Riverview properties for sale
©2026 Century 21 Real Estate LLC. All rights reserved. CENTURY 21®, the CENTURY 21 Logo and C21® are service marks owned by Century 21 Real Estate LLC. Century 21 Real Estate LLC fully supports the principles of the Fair Housing Act and the Equal Opportunity Act. Each office is independently owned and operated. Listing information is deemed reliable but not guaranteed accurate.
©2026 Century 21 Real Estate LLC. All rights reserved. CENTURY 21®, the CENTURY 21 Logo and C21® are service marks owned by Century 21 Real Estate LLC. Century 21 Real Estate LLC fully supports the principles of the Fair Housing Act and the Equal Opportunity Act. Each office is independently owned and operated. Listing information is deemed reliable but not guaranteed accurate.