- Anderson Island, Shreveport homes for sale
- Broadmoor, Shreveport homes for sale
- Cedar Grove, Shreveport homes for sale
- Central Business District, Shreveport homes for sale
- Cherokee Park, Shreveport homes for sale
- Dixie Garden, Shreveport homes for sale
- East Ridge, Shreveport homes for sale
- Fairfield, Shreveport homes for sale
- Highland, Shreveport homes for sale
- Huckleberry Ridge, Shreveport homes for sale
- Madison Park, Shreveport homes for sale
- Pierremont, Shreveport homes for sale
- Robson Plantation, Shreveport homes for sale
- Shady Grove, Bossier City homes for sale
- Shreve Island, Shreveport homes for sale
- South Broadmoor, Shreveport homes for sale
- South Highland, Shreveport homes for sale
- Spring Lake, Shreveport homes for sale
- Stoner Hill, Shreveport homes for sale
- Town South, Shreveport homes for sale
Ruston, LA - homes for sale
10 of 10 results displayed
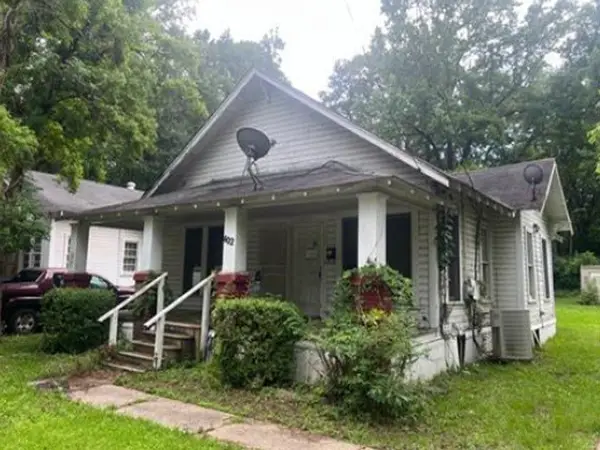 $45,000Active2 beds 1 baths1,092 sq. ft.
402 E Texas Avenue, Ruston, LA 71270
MLS# 21334522Listed by: REALHOME SERVICES & SOLUTIONS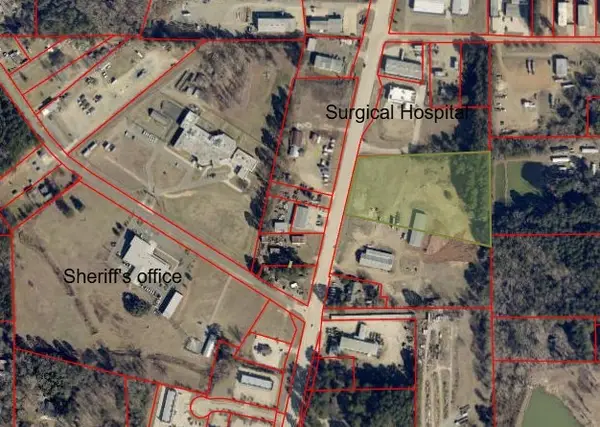 $1,500,000Active5 Acres
0000 Highway 33, Ruston, LA 71270
MLS# 21323455Listed by: LOUISIANA ORCHARD REALTY LLC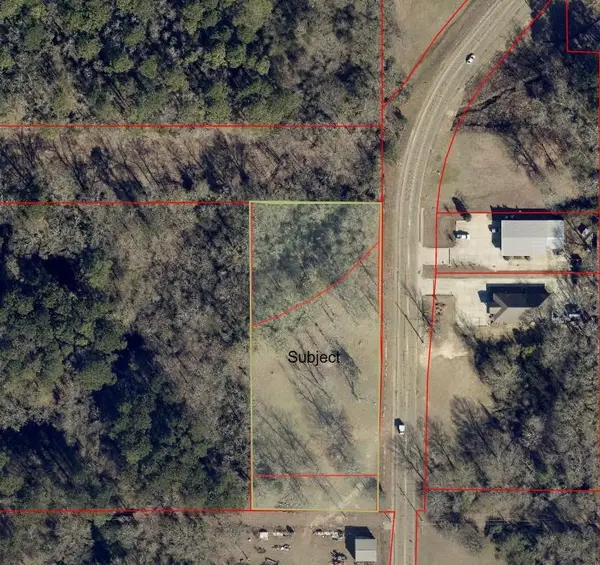 $360,000Active1.96 Acres
0000 Willow Glen, Ruston, LA 71270
MLS# 21323500Listed by: LOUISIANA ORCHARD REALTY LLC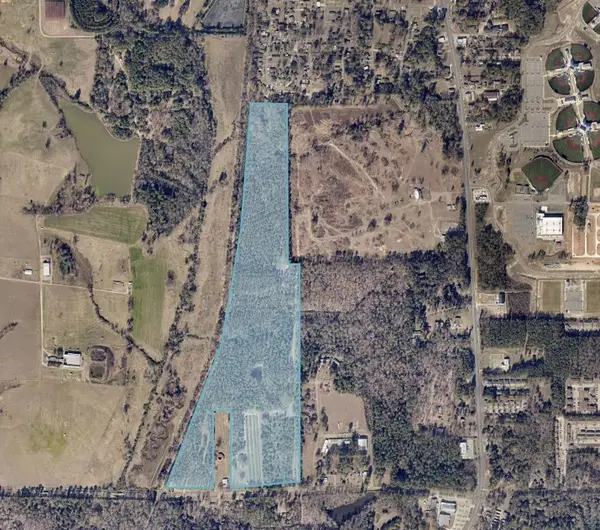 $1,642,140Active91 Acres
0000 Tennessee, Ruston, LA 71270
MLS# 21323437Listed by: LOUISIANA ORCHARD REALTY LLC
 $189,900Active4 beds 1 baths1,263 sq. ft.
1810 Lexington Street, Ruston, LA 71273
MLS# 21308465Listed by: CENTURY 21 UNITED $276,672Active3 beds 2 baths1,572 sq. ft.
707 Joseph Lane, Ruston, LA 71270
MLS# 21260784Listed by: PELICAN REALTY ADVISORS $295,856Active3 beds 2 baths1,681 sq. ft.
711 Joseph Lane, Ruston, LA 71270
MLS# 21260790Listed by: PELICAN REALTY ADVISORS $319,900Active4 beds 2 baths1,828 sq. ft.
703 Joseph Lane, Ruston, LA 71270
MLS# 21260795Listed by: PELICAN REALTY ADVISORS $350,000Active3 beds 3 baths2,496 sq. ft.
2105 Franklin Avenue, Ruston, LA 71270
MLS# 21198518Listed by: FRENCH REALTY, LLC $2,500,000Active4.24 Acres
1322 Cooktown Road, Ruston, LA 71270
MLS# 20820682Listed by: PINNACLE REALTY ADVISORS
Local realty services provided by:CENTURY 21 Mike Bowman, Inc.
Information provided, in part, by North Texas Real Estate Information Systems, Inc. Last Updated July 30, 2026 Listings with the NTREIS logo are listed by brokerages other than CENTURY 21 Mike Bowman, Inc.. GDAR Member Broker: Dave Bowman
Neighborhoods near Ruston, LA
Zip codes near Ruston, LA
- 71001 homes for sale
- 71016 homes for sale
- 71024 homes for sale
- 71031 homes for sale
- 71038 homes for sale
- 71039 homes for sale
- 71040 homes for sale
- 71055 homes for sale
- 71068 homes for sale
- 71070 homes for sale
- 71073 homes for sale
- 71226 homes for sale
- 71241 homes for sale
- 71251 homes for sale
- 71256 homes for sale
- 71270 homes for sale
- 71275 homes for sale
- 71292 homes for sale
- 71747 homes for sale
- 71749 homes for sale
Popular searches near Ruston, LA
- Arcadia homes for sale
- Chatham homes for sale
- Farmerville homes for sale
- Goldonna homes for sale
- Goldonna homes for sale
- Heflin homes for sale
- Henderson homes for sale
- Homer homes for sale
- Jackson homes for sale
- Johnson homes for sale
- Jonesboro homes for sale
- Junction City homes for sale
- Junction City homes for sale
- Minden homes for sale
- Monroe homes for sale
- Ringgold homes for sale
- Saline homes for sale
- Sibley homes for sale
- West Monroe homes for sale
- Winnfield homes for sale
Protect your home and budget from life's surprises with an Assurant Home Warranty, backed by a partner that supports you through every step of homeownership. Explore Plans.
©2026 Century 21 Real Estate LLC. All rights reserved. CENTURY 21®, the CENTURY 21 Logo and C21® are service marks owned by Century 21 Real Estate LLC. Century 21 Real Estate LLC fully supports the principles of the Fair Housing Act and the Equal Opportunity Act. Each office is independently owned and operated. Listing information is deemed reliable but not guaranteed accurate.