- Avoca, Pittston homes for sale
- Bellevue, Scranton homes for sale
- Bull's Head, Scranton homes for sale
- Downtown, Scranton homes for sale
- Dupont, Pittston homes for sale
- Duryea, Duryea homes for sale
- East Mountain, Scranton homes for sale
- Green Ridge, Scranton homes for sale
- Hill Section, Scranton homes for sale
- Hyde Park, Scranton homes for sale
- Keyser Valley, Scranton homes for sale
- Lower Green Ridge, Scranton homes for sale
- Minooka, Scranton homes for sale
- Pine Brook, Scranton homes for sale
- Providence, Scranton homes for sale
- South Side, Scranton homes for sale
- The Flats, Scranton homes for sale
- The Plot, Scranton homes for sale
- Tripp's Park, Scranton homes for sale
- West Side, Scranton homes for sale
Scranton, PA - homes for sale
2 of 2 results displayed
- Open Tue, 5 to 7pmNew
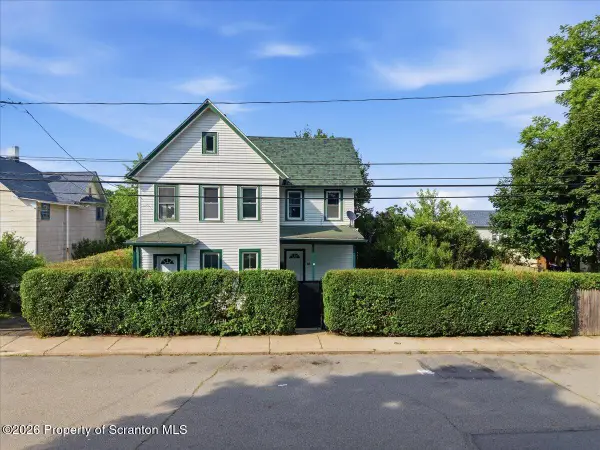 $199,000Active3 beds 2 baths1,158 sq. ft.
1110 Lloyd Street, Scranton, PA 18508
MLS# SC263127Listed by: EXP REALTY LLC - Open Sat, 11am to 12pmNew
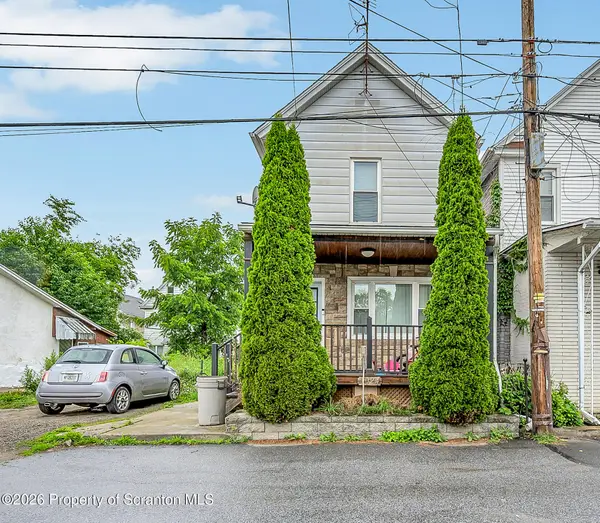 $124,900Active2 beds 1 baths873 sq. ft.
1024 Farber Court, Scranton, PA 18510
MLS# SC263093Listed by: REVOLVE REAL ESTATE
Local realty services provided by:CENTURY 21 Jackson Real Estate
Neighborhoods near Scranton, PA
Popular searches near Scranton, PA
- Avoca homes for sale
- Blakely homes for sale
- Chinchilla homes for sale
- Clarks Green homes for sale
- Clarks Summit homes for sale
- Dickson City homes for sale
- Dunmore homes for sale
- Duryea homes for sale
- Elmhurst Township homes for sale
- Jessup homes for sale
- Moosic homes for sale
- Newton homes for sale
- Old Forge homes for sale
- Olyphant homes for sale
- Peckville homes for sale
- Ransom Township homes for sale
- Roaring Brook Township homes for sale
- South Abington Township homes for sale
- Taylor homes for sale
- Throop homes for sale
Protect your home and budget from life's surprises with an Assurant Home Warranty, backed by a partner that supports you through every step of homeownership. Explore Plans.
©2026 Century 21 Real Estate LLC. All rights reserved. CENTURY 21®, the CENTURY 21 Logo and C21® are service marks owned by Century 21 Real Estate LLC. Century 21 Real Estate LLC fully supports the principles of the Fair Housing Act and the Equal Opportunity Act. Each office is independently owned and operated. Listing information is deemed reliable but not guaranteed accurate.