- Cotton Crossing, New Braunfels homes for sale
- Cottonwood Creek, San Marcos homes for sale
- Cypress Rapids at Gruene, New Braunfels homes for sale
- Downtown, New Braunfels homes for sale
- Gruene Crossing, New Braunfels homes for sale
- Havenwood at Hunter's Crossing, New Braunfels homes for sale
- Lake McQueeney Area, McQueeney homes for sale
- Las Palomas Country Club, Stockdale homes for sale
- Mission Hills Ranch, New Braunfels homes for sale
- Mission Oaks, New Braunfels homes for sale
- Morningstar, New Braunfels homes for sale
- Oak Run, New Braunfels homes for sale
- Oakwood Estates, New Braunfels homes for sale
- Oelkers Acres, New Braunfels homes for sale
- Park Ridge, New Braunfels homes for sale
- River Chase, New Braunfels homes for sale
- River Oaks, New Braunfels homes for sale
- Rolling Valley, New Braunfels homes for sale
- Town Creek, New Braunfels homes for sale
- West Pointe, New Braunfels homes for sale
Seguin, TX - homes for sale
114 of 114 results displayed
- New
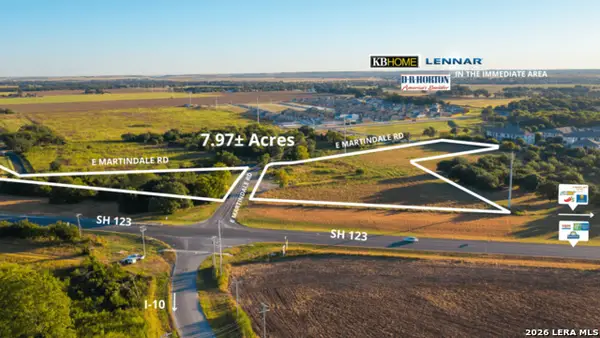 $1,500,000Active7.97 Acres
TBD N Highway 123 Byp At N Heideke St, Seguin, TX 78155
MLS# 1946034Listed by: WEST AND SWOPE RANCHES  $1,200,000Active5.73 Acres
637 Strempel Rd, Seguin, TX 78155
MLS# 1943393Listed by: WEST AND SWOPE RANCHES $98,900Active1.48 Acres
3074 Vista Ridge, Seguin, TX 78155
MLS# 1943354Listed by: SOUTHERN CAPITAL REALTY $895,000Active42.95 Acres
TBD 42 Acres Fm 1117, Seguin, TX 78155
MLS# 579833Listed by: WEST AND SWOPE RANCHES $850,000Active50 Acres
TBD 50 Acres Pfullman Road, Seguin, TX 78155
MLS# 597610Listed by: WEST AND SWOPE RANCHES $540,000Active27 Acres
TBD 27 Acres Pfullman Road, Seguin, TX 78155
MLS# 597623Listed by: WEST AND SWOPE RANCHES $45,000Active0 Acres
1059 Tabernacle St, Seguin, TX 78155
MLS# 7099288Listed by: LEVI RODGERS REAL ESTATE GROUP $29,999Active0.11 Acres
920 Veterans Street, Seguin, TX 78155
MLS# 604253Listed by: LAND UNLIMITED $29,900Active0.27 Acres
69 S Hampton Drive, Seguin, TX 78155
MLS# 603442Listed by: WHITE LINE REALTY LLC $89,000Active0.4 Acres
648 Oak Creek Parkway, Seguin, TX 78155
MLS# 603645Listed by: BARNARD REALTY GROUP, LLC $99,500Active1.34 Acres
3071 Vista Ridge, Seguin, TX 78155
MLS# 603140Listed by: SOUTHERN CAPITAL REALTY $269,000Active5.42 Acres
700 Water Tower, Seguin, TX 78155
MLS# 1934819Listed by: A CUT ABOVE REALTY, LLC $340,000Active18.84 Acres
Tract 7 Fm 1117, Seguin, TX 78155
MLS# 601846Listed by: WEST AND SWOPE RANCHES $145,000Active1.45 Acres
449 Hurst, Seguin, TX 78155
MLS# 1933117Listed by: PHILLIPS & ASSOCIATES REALTY $80,000Active0 Acres
112 Lake Forrest Dr, Seguin, TX 78155
MLS# 1926502Listed by: CELINA ROSS REALTY, LLC $80,000Active0 Acres
110 Lake Forrest Dr, Seguin, TX 78155
MLS# 7976346Listed by: CELINA ROSS REALTY, LLC $69,900Pending0.2 Acres
1739 W Court Street, Seguin, TX 78155
MLS# 600676Listed by: ANDERS PIERCE REALTY, LLC $334,000Active8.44 Acres
250 Spur Trl, Seguin, TX 78155
MLS# 1930409Listed by: RE/MAX ASSOCIATES BOERNE $135,000Active1.43 Acres
3046 Vista, Seguin, TX 78155
MLS# 1930412Listed by: TKO LISTINGS, LLC $234,900Active4.06 Acres
650 Mcknight Road, Seguin, TX 78155
MLS# 600246Listed by: CENTURY 21 INTEGRA $64,900Active0.12 Acres
239 Club View E, Seguin, TX 78155
MLS# 1928601Listed by: BOSS REAL ESTATE $64,900Active0.12 Acres
245 Club View E, Seguin, TX 78155
MLS# 1928604Listed by: BOSS REAL ESTATE $64,900Active0.12 Acres
263 Club View E, Seguin, TX 78155
MLS# 1928606Listed by: BOSS REAL ESTATE $250,000Active4 Acres
982 Ilka Switch, Seguin, TX 78155
MLS# 1928088Listed by: PIONEER REALTY PARTNERS, LLC $89,500Active0.81 Acres
0 Paseo Del Rio, Seguin, TX 78155
MLS# 1926408Listed by: TEXAS ALLY REAL ESTATE GROUP $500,000Active16.01 Acres
263 Krams Creek, Seguin, TX 78155
MLS# 1924902Listed by: SAN ANTONIO ELITE REALTY $215,000Active10.01 Acres
2584 Leissner School Road, Seguin, TX 78155
MLS# 597676Listed by: JPAR - NEW BRAUNFELS $480,000Active24 Acres
332 - 1 Fm 2438, Seguin, TX 78155
MLS# 597618Listed by: WEST AND SWOPE RANCHES $1,725,000Active9.3 Acres
0 Tx-123, Seguin, TX 78155
MLS# 597270Listed by: A CUT ABOVE REALTY, LLC $25,000Active0.08 Acres
727 Salinas Street, Seguin, TX 78155
MLS# 597454Listed by: REAL BROKER, LLC $498,000Active4.03 Acres
TBA Pine & King Street, Seguin, TX 78155
MLS# 596452Listed by: TEXAS PREMIER REALTY $249,999Active1.43 Acres
111 Antelope Lane, Seguin, TX 78155
MLS# 77531106Listed by: BRIX REALTY GROUP, LLC $245,000Active1.43 Acres
111 Antelope Lane, Seguin, TX 78155
MLS# 92894990Listed by: WORTH CLARK REALTY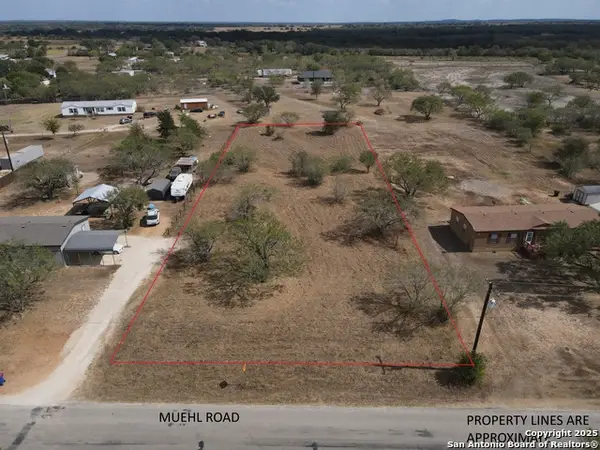
 $126,000Active1.01 Acres
141 Muehl, Seguin, TX 78155
MLS# 1917761Listed by: CENTURY 21 INTEGRA $47,500Active0.26 Acres
323 Meadowlake Drive, Seguin, TX 78155
MLS# 595449Listed by: SEGUIN REALTY $200,000Active5 Acres
Lot 13 Seay World Lane, Seguin, TX 78155
MLS# 595673Listed by: CORNER POST REAL ESTATE, LLC $640,000Active8 Acres
921 Country Club Drive, Seguin, TX 78155
MLS# 595651Listed by: REGALIA, INC. $225,000Active0.42 Acres
38 E Hampton, Seguin, TX 78155
MLS# 1915281Listed by: ZEST REALTY $877,750Active35 Acres
721 Branch Rd, Seguin, TX 78155
MLS# 594781Listed by: WEST AND SWOPE RANCHES $42,500Active0 Acres
8 E Hampton Dr, Seguin, TX 78155
MLS# 6429969Listed by: SEPPALA REAL ESTATE GROUP $115,000Active0.23 Acres
380 Guadalupe River Drive, Seguin, TX 78155
MLS# 593674Listed by: HILL COUNTRY LAND LOCATORS $28,000Active0 Acres
TBD Bert St St, Seguin, TX 78155
MLS# 3571957Listed by: TS REALTY $1,145,000Active10.99 Acres
0 E Seideman, Seguin, TX 78155
MLS# 571946Listed by: WINDLE REAL ESTATE, LLC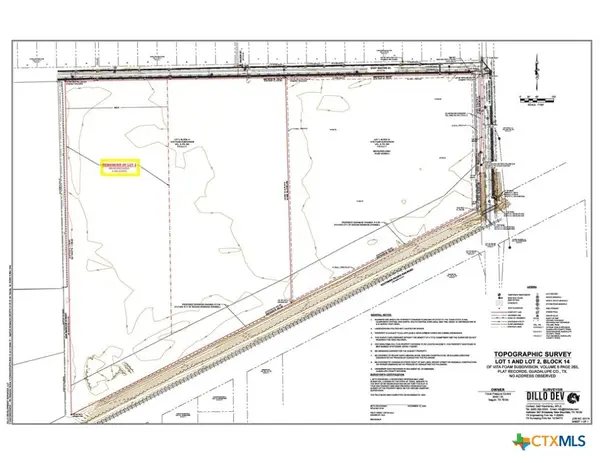 $1,434,000Active11.1 Acres
0 E Baxter Street, Seguin, TX 78155
MLS# 551266Listed by: WINDLE REAL ESTATE, LLC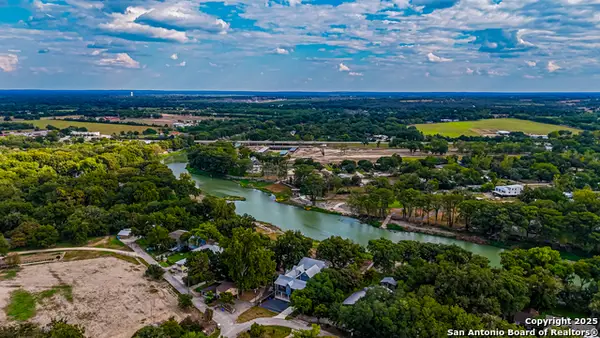 $126,900Active0.6 Acres
111 Tabler, Seguin, TX 78155
MLS# 1913194Listed by: WEICHERT, REALTORS - CORWIN & ASSOCIATES $24,900Active0.12 Acres
0 Jesse Turner, Seguin, TX 78155
MLS# 592961Listed by: WHITE LINE REALTY LLC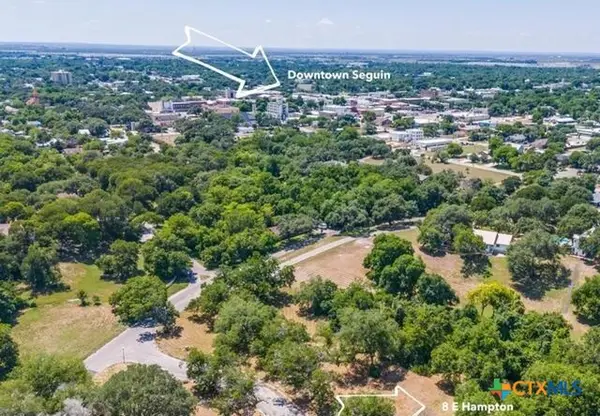 $42,500Active0.52 Acres
8 E Hampton Drive, Seguin, TX 78155
MLS# 589759Listed by: SEPPALA REAL ESTATE GROUP $49,900Active0.13 Acres
924 Roselawn, Seguin, TX 78155
MLS# 1898550Listed by: EXP REALTY $78,000Active0.11 Acres
546 Seay, Seguin, TX 78155
MLS# 1896281Listed by: EXP REALTY $125,000Pending1.55 Acres
7074 State Hwy 123, Seguin, TX 78155
MLS# 1894111Listed by: WATTERS INTERNATIONAL REALTY $3,775,000Active0 Acres
0 Cordova Rd, Seguin, TX 78155
MLS# 5949171Listed by: D LEE EDWARDS REALTY, INC $37,000Active0.11 Acres
1308 Bert Street, Seguin, TX 78155
MLS# 589452Listed by: TS REALTY $28,000Active0.11 Acres
TBD Bert Street, Seguin, TX 78155
MLS# 589454Listed by: TS REALTY $3,082,600Active154.13 Acres
4425 Us Hwy 90, Seguin, TX 78155
MLS# 589257Listed by: A CUT ABOVE REALTY, LLC $118,000Pending2 Acres
3043 Vista Ridge, Seguin, TX 78155
MLS# 566176Listed by: SOUTHERN CAPITAL REALTY $200,000Active10 Acres
0000 Fox Trotter Rd, Seguin, TX 78155
MLS# 1888179Listed by: SIMMONDS REAL ESTATE INC. $250,000Active0.23 Acres
1150 Ethel, Seguin, TX 78155
MLS# 587024Listed by: KELLER WILLIAMS HERITAGE $450,000Active0.22 Acres
1155 Ethel, Seguin, TX 78155
MLS# 587026Listed by: KELLER WILLIAMS HERITAGE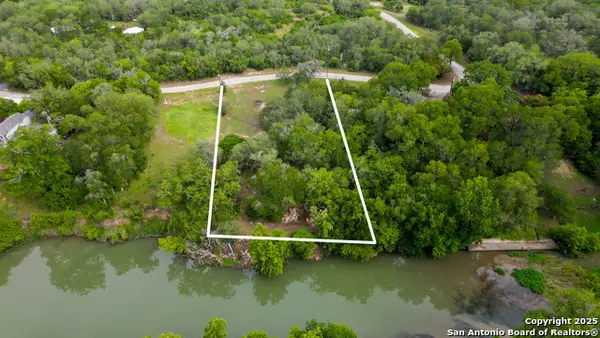 $350,000Active1.21 Acres
0 River Trl, Seguin, TX 78155
MLS# 1881775Listed by: KELLER WILLIAMS HERITAGE $209,000Active7.48 Acres
385 Marrou Rd., Seguin, TX 78155
MLS# 1876537Listed by: KELLER WILLIAMS CITY-VIEW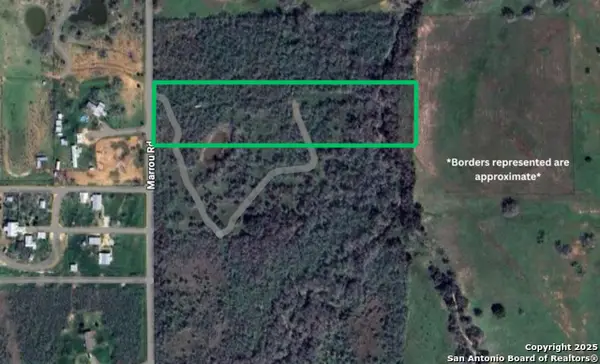 $260,000Active4.73 Acres
445 Marrou Rd., Seguin, TX 78155
MLS# 1876538Listed by: KELLER WILLIAMS CITY-VIEW $201,000Active4.69 Acres
485 Marrou Rd., Seguin, TX 78155
MLS# 1876539Listed by: KELLER WILLIAMS CITY-VIEW $255,000Active4.65 Acres
525 Marrou Rd., Seguin, TX 78155
MLS# 1876540Listed by: KELLER WILLIAMS CITY-VIEW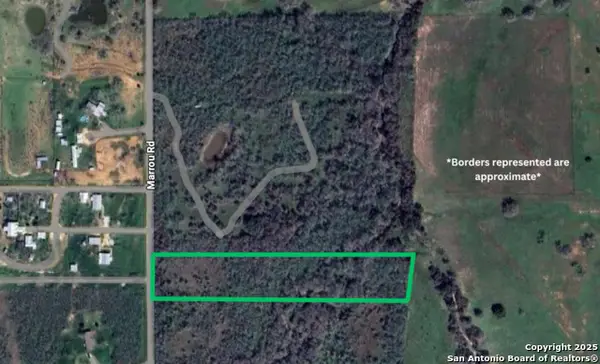 $198,000Active4.61 Acres
565 Marrou Rd., Seguin, TX 78155
MLS# 1876542Listed by: KELLER WILLIAMS CITY-VIEW $177,000Active4.56 Acres
605 Marrou Rd., Seguin, TX 78155
MLS# 1876544Listed by: KELLER WILLIAMS CITY-VIEW $147,500Active0 Acres
TBD Lot 5 Hoffman Rd, Seguin, TX 78155
MLS# 4799899Listed by: LONE STAR LAND SALES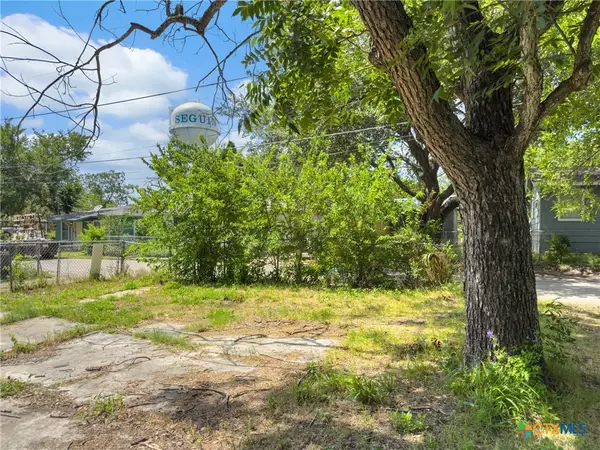 $35,000Active0.12 Acres
729 Schuessler Street, Seguin, TX 78155
MLS# 598846Listed by: THE DAMRON GROUP REALTORS $375,000Active10 Acres
2760 Glenewinkel, Seguin, TX 78155
MLS# 1874479Listed by: ESANCHEZ REAL ESTATE $67,000Pending0.28 Acres
124 W Kingsbury, Seguin, TX 78155
MLS# 1873193Listed by: LPT REALTY, LLC $135,000Active1.43 Acres
3042 Vista Ridge, Seguin, TX 78155
MLS# 578957Listed by: ANDERS PIERCE REALTY, LLC $325,000Active10.04 Acres
699 Mcknight, Seguin, TX 78155
MLS# 1870844Listed by: EXP REALTY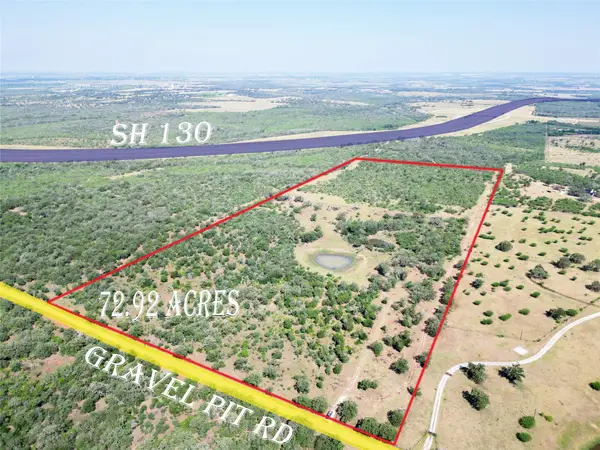 $1,600,000Active0 Acres
00 Gravel Pit Rd, Seguin, TX 78155
MLS# 2759162Listed by: LINK REALTY, LLC $29,900Active0.11 Acres
631 E Ireland Street, Seguin, TX 78155
MLS# 579931Listed by: COLDWELL BANKER D'ANN HARPER, $125,000Active1.46 Acres
3067 Vista Ridge, Seguin, TX 78155
MLS# 578954Listed by: ANDERS PIERCE REALTY, LLC $125,000Active1.49 Acres
3059 Vista Ridge, Seguin, TX 78155
MLS# 578955Listed by: ANDERS PIERCE REALTY, LLC $99,900Active0 Acres
112 Lake Forrest Dr, Seguin, TX 78155
MLS# 2756057Listed by: KELLER WILLIAMS HERITAGE $39,000Active0.5 Acres
13 Hollamon, Seguin, TX 78155
MLS# 1859595Listed by: KELLER WILLIAMS HERITAGE $890,000Active35 Acres
35 ACRES Fm 467, Seguin, TX 78155
MLS# 1859601Listed by: THE REALTY PLACE $39,900Active0.13 Acres
1318 N San Marcos, Seguin, TX 78155
MLS# 1858000Listed by: CENTURY 21 INTEGRA $39,900Active0.13 Acres
1316 N San Marcos, Seguin, TX 78155
MLS# 1857964Listed by: CENTURY 21 INTEGRA $55,900Active0.17 Acres
604 Guadalupe, Seguin, TX 78155
MLS# 1857893Listed by: CENTURY 21 INTEGRA $175,000Active0.41 Acres
TBD Cherokee Bend, Seguin, TX 78155
MLS# 1851679Listed by: BRAVA REALTY $175,000Active0.44 Acres
TBD1 Cherokee Bend, Seguin, TX 78155
MLS# 1855109Listed by: BRAVA REALTY $445,000Active21 Acres
0 Fox Trotter Rd, Seguin, TX 78155
MLS# 1854552Listed by: RODRIGUEZ COLLECTIVE $35,000Active0.5 Acres
LOT 102 & 103 Hollamon Dr, Seguin, TX 78155
MLS# 1853504Listed by: THE HESLES AGENCY $35,000Active0.37 Acres
5 E Hampton Dr, Seguin, TX 78155
MLS# 1853442Listed by: THE HESLES AGENCY $145,900Active2 Acres
650 Mcknight Road, Seguin, TX 78155
MLS# 574368Listed by: CENTURY 21 INTEGRA $665,000Active4.18 Acres
1900 N Austin Street, Seguin, TX 78155
MLS# 571948Listed by: WINDLE REAL ESTATE, LLC $999,999Active5.87 Acres
TBD E Pine, Seguin, TX 78155
MLS# 1839234Listed by: KELLER WILLIAMS HERITAGE $130,000Active0.25 Acres
TBD E Pine Street, Seguin, TX 78155
MLS# 568078Listed by: KELLER WILLIAMS HERITAGE $35,000Active0.1 Acres
903 Liberty Avenue, Seguin, TX 78155
MLS# 567883Listed by: KELLER WILLIAMS HERITAGE $170,000Active0 Acres
0000 Hampton Dr S, Seguin, TX 78155
MLS# 2974438Listed by: REAL BROKER, LLC $235,000Active0.71 Acres
340 Deer Slayer, Seguin, TX 78155
MLS# 1831368Listed by: LPT REALTY, LLC $210,000Active1.2 Acres
120 Antelope Ln, Seguin, TX 78155
MLS# 1830314Listed by: VORTEX REALTY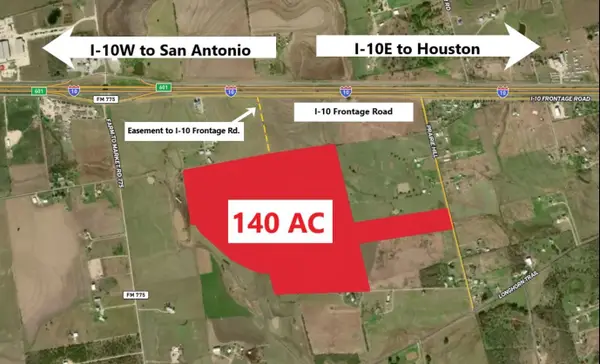 $5,000,000Active139.99 Acres
000 I-10 W, Seguin, TX 78155
MLS# 48882051Listed by: LTR, INC.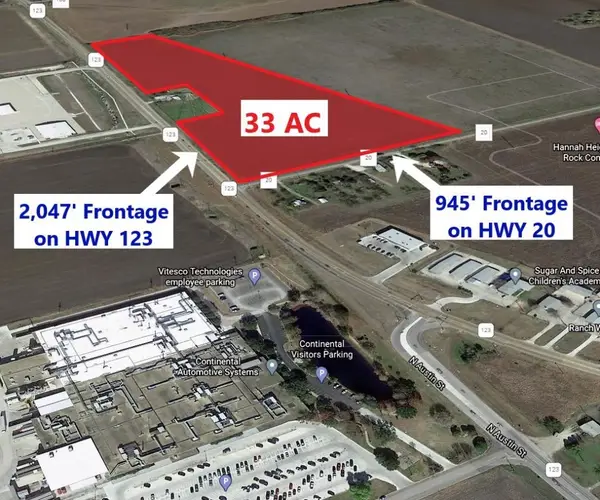 $7,187,400Active31.49 Acres
000 Fm 20, Seguin, TX 78155
MLS# 29817400Listed by: LTR, INC. $33,000Active0.27 Acres
67 S Hampton Drive, Seguin, TX 78155
MLS# 563730Listed by: OUR TEXAS REAL ESTATE GROUP $80,000Active0.79 Acres
33 Glen Cove, Seguin, TX 78155
MLS# 1816231Listed by: REALTY ADVANTAGE $39,500Active0.09 Acres
615 E Walnut Street, Seguin, TX 78155
MLS# 553383Listed by: KELLER WILLIAMS HERITAGE $65,000Active0.1 Acres
557 Silva Street, Seguin, TX 78155
MLS# 603849Listed by: CENTURY 21 INTEGRA $66,000Active0.18 Acres
1006 N Guadalupe Street, Seguin, TX 78155
MLS# 603850Listed by: CENTURY 21 INTEGRA $42,500Active0.33 Acres
557 Collins St., Seguin, TX 78155
MLS# 1775613Listed by: PROPERTY PROFESSIONALS, INC $40,000Active0.13 Acres
2544 Ayers Dr, Seguin, TX 78155
MLS# 1737158Listed by: IH 10 REALTY $79,900Active0.52 Acres
314 Troell St, Seguin, TX 78155
MLS# 1711585Listed by: CENTURY 21 THE HILLS REALTY $29,560Active0.09 Acres
1005 Clark St, Seguin, TX 78155
MLS# 1701737Listed by: LISTINGSPARK $59,560Active0.09 Acres
511 Riley St, Seguin, TX 78155
MLS# 1701743Listed by: LISTINGSPARK $29,997Active0.09 Acres
1007 Clark St, Seguin, TX 78155
MLS# 1878452Listed by: LISTINGSPARK $2,340,600Active93.79 Acres
181 Pine Meadow Rd, Seguin, TX 78155
MLS# 1695306Listed by: ANDERS PIERCE REALTY $49,900Active0.13 Acres
313 Club View, Seguin, TX 78155
MLS# 504902Listed by: DAWSON & ASSOCIATES $40,000Active0 Acres
46 Glen Cove Dr, Seguin, TX 78155
MLS# 4712194Listed by: COLDWELL BANKER D'ANN HARPER $174,500Pending0 Acres
374 Guadalupe River Dr, Seguin, TX 78155
MLS# 9282340Listed by: EXP REALTY LLC $220,000Active9.26 Acres
705 Rawhide Rd, Seguin, TX 78155
MLS# 1646730Listed by: EXP REALTY $89,000Active0.58 Acres
601 Oak Creek Parkway, Seguin, TX 78155
MLS# 601884Listed by: A CUT ABOVE REALTY, LLC $229,000Active2.1 Acres
1931 Monterrey Oak, Seguin, TX 78155
MLS# 601905Listed by: A CUT ABOVE REALTY, LLC
Local realty services provided by:CENTURY 21 Middleton, CENTURY 21 North East, CENTURY 21 Judge Fite Company
Some properties that appear for sale on this web site may subsequently have been sold and may no longer be available. The data relating to real estate for sale on this web site comes in part from the FHAAR IDX INFO SHARE PROGRAM. Real estate listings held by brokerage firms other than CENTURY 21 North East include the name of the listing agent. Copyright 2026 FHAAR IDX INFO SHARE PROGRAM. Last Updated March 6, 2026
Copyright 2026, Houston Realtors Information Service, Inc. All information provided is deemed reliable but is not guaranteed and should be independently verified. IDX information is provided exclusively for consumers' personal, non-commercial use, it may not be used for any purpose other than to identify prospective properties consumers may be interested in purchasing, and the data is deemed reliable but is not guaranteed accurate by the MLS.
Neighborhoods near Seguin, TX
Zip codes near Seguin, TX
- 78101 homes for sale
- 78108 homes for sale
- 78109 homes for sale
- 78121 homes for sale
- 78122 homes for sale
- 78123 homes for sale
- 78124 homes for sale
- 78130 homes for sale
- 78132 homes for sale
- 78148 homes for sale
- 78152 homes for sale
- 78154 homes for sale
- 78155 homes for sale
- 78161 homes for sale
- 78266 homes for sale
- 78638 homes for sale
- 78648 homes for sale
- 78655 homes for sale
- 78656 homes for sale
- 78666 homes for sale
Popular searches near Seguin, TX
- Cibolo homes for sale
- Geronimo homes for sale
- Kingsbury homes for sale
- La Vernia homes for sale
- Lake Dunlap homes for sale
- Leesville homes for sale
- Marion homes for sale
- Martindale homes for sale
- McQueeney homes for sale
- New Berlin homes for sale
- New Braunfels homes for sale
- Northeast Guadalupe homes for sale
- Redwood homes for sale
- San Marcos homes for sale
- Santa Clara homes for sale
- Schertz homes for sale
- Schertz-Cibolo homes for sale
- Southeast Guadalupe homes for sale
- Southwest Guadalupe homes for sale
- Zuehl homes for sale
Protect your home and budget from life's surprises with an Assurant Home Warranty, backed by a partner that supports you through every step of homeownership. Explore Plans.
©2026 Century 21 Real Estate LLC. All rights reserved. CENTURY 21®, the CENTURY 21 Logo and C21® are service marks owned by Century 21 Real Estate LLC. Century 21 Real Estate LLC fully supports the principles of the Fair Housing Act and the Equal Opportunity Act. Each office is independently owned and operated. Listing information is deemed reliable but not guaranteed accurate.