- Beaver Springs homes for sale
- Beavertown homes for sale
- Fayette homes for sale
- Franklin homes for sale
- Hartley homes for sale
- Middleburg homes for sale
- Middlecreek Township homes for sale
- Mifflinburg homes for sale
- Millmont homes for sale
- Mt Pleasant Mills homes for sale
- New Berlin homes for sale
- Penn homes for sale
- Perry homes for sale
- Port Trevorton homes for sale
- Selinsgrove homes for sale
- Spring homes for sale
- Susquehanna homes for sale
- Union homes for sale
- Washington homes for sale
- West Beaver homes for sale
Snyder County, PA - homes for sale
129 of 129 results displayed
- New
 $145,000Active3 beds 2 baths2,172 sq. ft.
8 S Stuck Street, McClure, PA 17841
MLS# C-813Listed by: RE/MAX BRIDGES - New
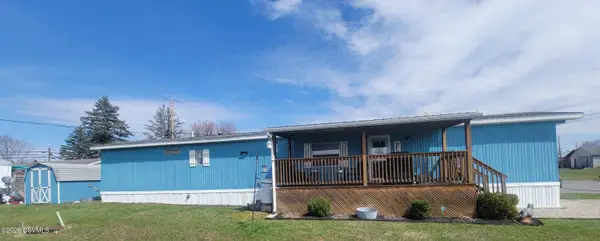 $50,000Active3 beds 1 baths980 sq. ft.
13 Jc Mobile Home Court, Middleburg, PA 17842
MLS# C-810Listed by: EXP REALTY, LLC - New
 $595,000Active2 beds 4 baths3,370 sq. ft.
139 Rainbow Drive, Middleburg, PA 17842
MLS# WB-103505Listed by: CENTURY 21 1ST CHOICE REALTY - New
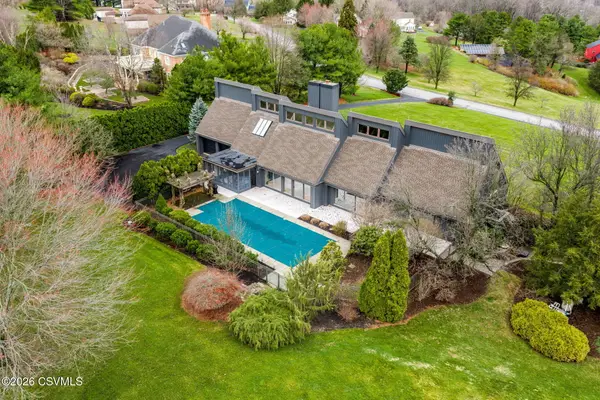
 $1,290,000Active5 beds 4 baths3,071 sq. ft.
970 App Road, Selinsgrove, PA 17870
MLS# C-800Listed by: EXP REALTY, LLC - New
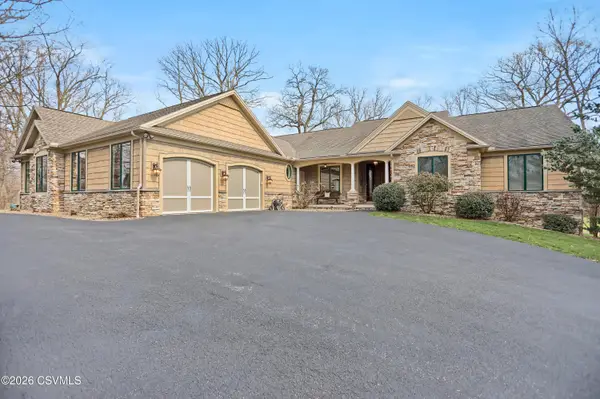
 $599,900Active3 beds 3 baths2,740 sq. ft.
142 Sweet Gum Road, Selinsgrove, PA 17870
MLS# C-783Listed by: VILLAGER REALTY, INC. - LEWISB - New
 $95,000Active2 Acres
810 Creek Road, Mount Pleasant Mills, PA 17853
MLS# C-776Listed by: BOWEN AGENCY INC., REALTORS - SUNBURY - New
 $245,000Active3 beds 2 baths1,336 sq. ft.
1760 Main Street, Port Trevorton, PA 17864
MLS# C-771Listed by: EXP REALTY, LLC  $225,000Pending4 beds 2 baths2,624 sq. ft.
4230 Pennsylvania 204, Selinsgrove, PA 17870
MLS# C-760Listed by: IRON VALLEY REAL ESTATE MID PENN- New
 $275,000Active2 beds 2 baths1,550 sq. ft.
38 N Oakwood Lane, Selinsgrove, PA 17870
MLS# C-758Listed by: EXP REALTY, LLC - New
 $569,000Active4 beds 3 baths3,554 sq. ft.
951 Mountain Road, Richfield, PA 17086
MLS# C-757Listed by: EXP REALTY, LLC - New
 $309,999Active4 beds 3 baths2,060 sq. ft.
5954 Park Road, Selinsgrove, PA 17870
MLS# 26-1209Listed by: AGENT REAL ESTATE GROUP, LLC - New
 $335,000Active3 beds 2 baths1,400 sq. ft.
2 Chrislynn Drive, Middleburg, PA 17842
MLS# C-748Listed by: COUP AGENCY - New
 $299,900Active3 beds 2 baths1,429 sq. ft.
287 Pine Crest, MCCLURE, PA 17841
MLS# PASY2002694Listed by: EXP REALTY, LLC - New
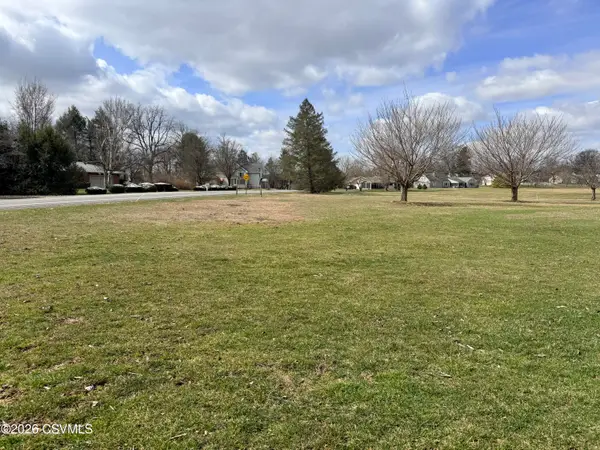 $45,000Active0.64 Acres
LOTS 68-72 Mill Road, Selinsgrove, PA 17870
MLS# C-714Listed by: EXP REALTY, LLC  $255,000Active15.53 Acres
Willard Hill Rd, MOUNT PLEASANT MILLS, PA 17853
MLS# PAJT2012742Listed by: KELLER WILLIAMS OF CENTRAL PA $240,000Pending3 beds 2 baths2,158 sq. ft.
1368 N Main Street, Port Trevorton, PA 17864
MLS# C-685Listed by: RE/MAX BRIDGES $50,000Pending4.7 Acres
Sunbury Road, Selinsgrove, PA 17870
MLS# C-679Listed by: BOWEN AGENCY INC., REALTORS - LEWISBURG $355,000Active3 beds 2 baths
762 Sand Hill Rd, SELINSGROVE, PA 17870
MLS# PASY2002686Listed by: RE/MAX REALTY SELECT $229,900Pending3 beds 2 baths1,380 sq. ft.
1548 Route 204, SELINSGROVE, PA 17870
MLS# PASY2002678Listed by: COLDWELL BANKER REALTY $449,000Active3 beds 2 baths2,377 sq. ft.
11 Easy Street, Selinsgrove, PA 17870
MLS# C-613Listed by: RE/MAX BRIDGES $365,000Pending3 beds 2 baths2,013 sq. ft.
11 Tee Street, Selinsgrove, PA 17870
MLS# C-612Listed by: PRO REAL ESTATE SERVICES, INC. $325,000Active10.62 Acres
Lot Furnace Rd, MIDDLEBURG, PA 17842
MLS# PASY2002674Listed by: JOY DANIELS REAL ESTATE GROUP, LTD $364,990Pending3 beds 3 baths1,725 sq. ft.
14-101 #26 Julian Drive, Bloomsburg, PA 17815
MLS# C-403Listed by: BERKS HOME REALTY, LLC $349,990Pending3 beds 3 baths1,621 sq. ft.
14-102 #27 Julian Drive, Bloomsburg, PA 17815
MLS# C-404Listed by: BERKS HOME REALTY, LLC $369,990Pending3 beds 3 baths1,621 sq. ft.
14-104 #29 Julian Drive, Bloomsburg, PA 17815
MLS# C-406Listed by: BERKS HOME REALTY, LLC $364,990Pending3 beds 3 baths1,725 sq. ft.
14-101 Julian Dr #lot 26, BLOOMSBURG, PA 17815
MLS# PACO2000624Listed by: BERKS HOMES REALTY, LLC $349,990Pending3 beds 4 baths2,052 sq. ft.
14-102 Julian Dr #lot 27, BLOOMSBURG, PA 17815
MLS# PACO2000626Listed by: BERKS HOMES REALTY, LLC $369,990Pending3 beds 3 baths2,052 sq. ft.
14-104 Julian Dr #lot 29, BLOOMSBURG, PA 17815
MLS# PACO2000630Listed by: BERKS HOMES REALTY, LLC $275,000Pending3 beds 2 baths1,240 sq. ft.
209 Sierra Drive, Mount Pleasant Mills, PA 17853
MLS# C-541Listed by: BOWEN AGENCY INC., REALTORS SELINSGROVE $205,000Pending4 beds 3 baths1,600 sq. ft.
27 West Specht Street, MCCLURE, PA 17841
MLS# PASY2002672Listed by: GOLD KEY REAL ESTATE & APPRAISING $89,900Active5.6 Acres
0 Dressler Ridge, MOUNT PLEASANT MILLS, PA 17853
MLS# PAJT2012716Listed by: KELLER WILLIAMS ELITE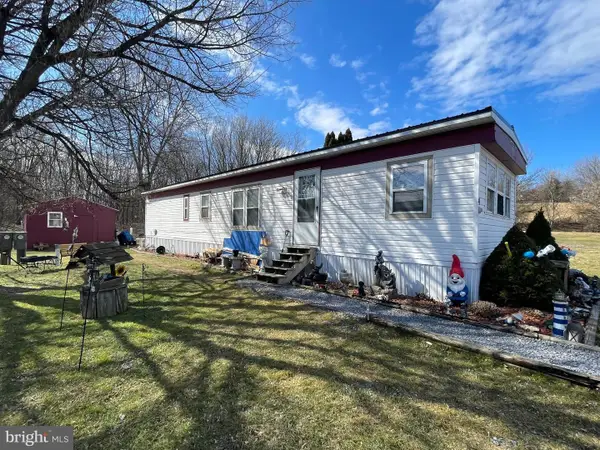 $35,000Active2 beds 1 baths840 sq. ft.
4 Oxford Dr, SELINSGROVE, PA 17870
MLS# PASY2002670Listed by: TURN KEY REALTY GROUP $444,900Active4 beds 3 baths2,120 sq. ft.
45 Oakmont Court, Selinsgrove, PA 17870
MLS# C-492Listed by: VILLAGER REALTY, INC. - DANVILLE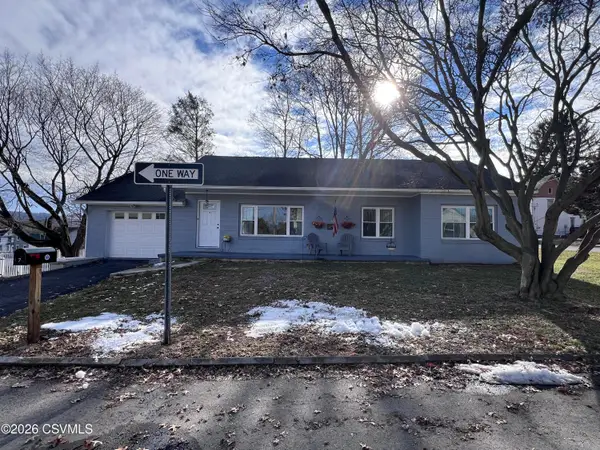 $240,000Pending3 beds 1 baths1,284 sq. ft.
7 Helen Street, Shamokin Dam, PA 17876
MLS# C-470Listed by: COLDWELL BANKER PENN ONE REAL ESTATE $889,900Active80.85 Acres
0 Spiggs Hill Rd, MOUNT PLEASANT MILLS, PA 17853
MLS# PAJT2012708Listed by: RSR, REALTORS, LLC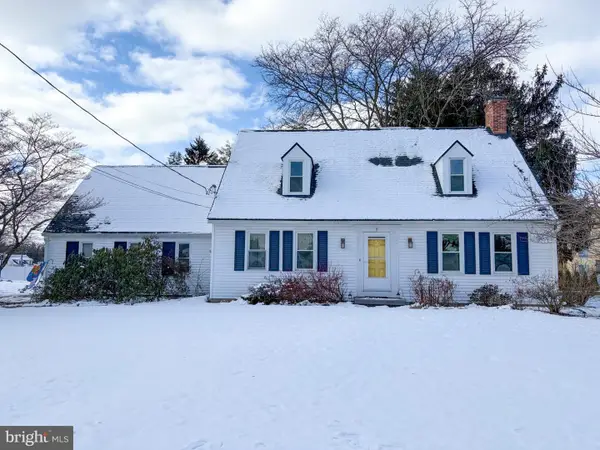 $249,900Pending3 beds 2 baths1,596 sq. ft.
9 Lenker Ave, SELINSGROVE, PA 17870
MLS# PASY2002666Listed by: REAL OF PENNSYLVANIA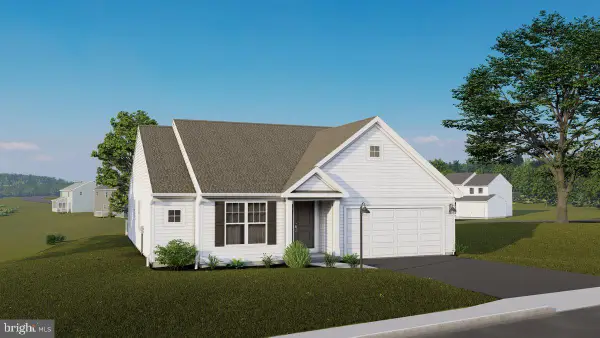 $441,945Pending3 beds 2 baths1,662 sq. ft.
136 Woodlynn Dr #lot 4, SELINSGROVE, PA 17870
MLS# PASY2002664Listed by: BERKS HOMES REALTY, LLC $125,000Active4 beds 2 baths1,672 sq. ft.
2336 Snyder Ave, BEAVER SPRINGS, PA 17812
MLS# PASY2002662Listed by: BEILER-CAMPBELL REALTORS-QUARRYVILLE $235,000Pending3 beds 2 baths1,584 sq. ft.
169 Pine Ln, SELINSGROVE, PA 17870
MLS# PASY2002660Listed by: BOWEN AGENCY, INC. $58,500Active1.9 Acres
School House Lane, Selinsgrove, PA 17870
MLS# C-441Listed by: RE/MAX BRIDGES $75,000Active35.77 Acres
2336 Snyder Ave #1 Lot, BEAVER SPRINGS, PA 17812
MLS# PASY2002646Listed by: BEILER-CAMPBELL REALTORS-QUARRYVILLE $200,000Active63.42 Acres
0 Ridge Rd #4 Lot, BEAVER SPRINGS, PA 17812
MLS# PASY2002648Listed by: BEILER-CAMPBELL REALTORS-QUARRYVILLE $75,000Active29.56 Acres
2336 Snyder Ave #2 Lot, BEAVER SPRINGS, PA 17812
MLS# PASY2002650Listed by: BEILER-CAMPBELL REALTORS-QUARRYVILLE $125,000Active40.09 Acres
2336 Snyder Ave #3 Lot, BEAVER SPRINGS, PA 17812
MLS# PASY2002652Listed by: BEILER-CAMPBELL REALTORS-QUARRYVILLE $150,000Active39.34 Acres
0 Ridge Rd #5 Lot, BEAVER SPRINGS, PA 17812
MLS# PASY2002654Listed by: BEILER-CAMPBELL REALTORS-QUARRYVILLE $35,000Active17.2 Acres
0 Ridge Rd #6 Lot, BEAVER SPRINGS, PA 17812
MLS# PASY2002656Listed by: BEILER-CAMPBELL REALTORS-QUARRYVILLE $35,000Active17.15 Acres
0 Ridge Rd #7 Lot, BEAVER SPRINGS, PA 17812
MLS# PASY2002658Listed by: BEILER-CAMPBELL REALTORS-QUARRYVILLE $306,000Pending2 beds 2 baths1,728 sq. ft.
721 Rolling Green Drive, Selinsgrove, PA 17870
MLS# C-418Listed by: EXP REALTY, LLC $479,000Pending4 beds 4 baths2,248 sq. ft.
10 Swope Drive, Selinsgrove, PA 17870
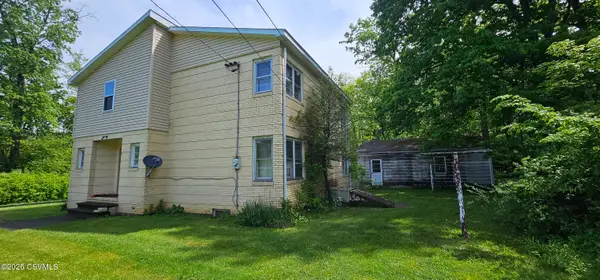
MLS# C-414Listed by: EXP REALTY, LLC $139,900Active4 beds 1 baths2,208 sq. ft.
108 S Main Street, Middleburg, PA 17842
MLS# C-408Listed by: BOWEN AGENCY INC., REALTORS SELINSGROVE $625,000Active4 beds 3 baths2,748 sq. ft.
1220 Old 522, SELINSGROVE, PA 17870
MLS# PASY2002644Listed by: NEXTHOME CAPITAL REALTY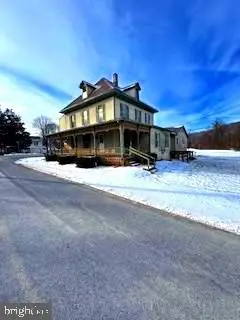 $175,000Active4 beds 3 baths
40 Spring St, BEAVER SPRINGS, PA 17812
MLS# PASY2002636Listed by: BERKSHIRE HATHAWAY HOMESERVICES HOMESALE REALTY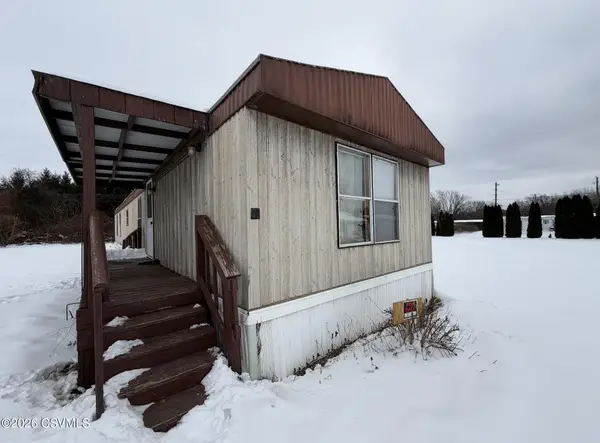 $20,000Pending2 beds 2 baths980 sq. ft.
55 Minton Drive, Selinsgrove, PA 17870
MLS# C-362Listed by: IRON VALLEY REAL ESTATE MID PENN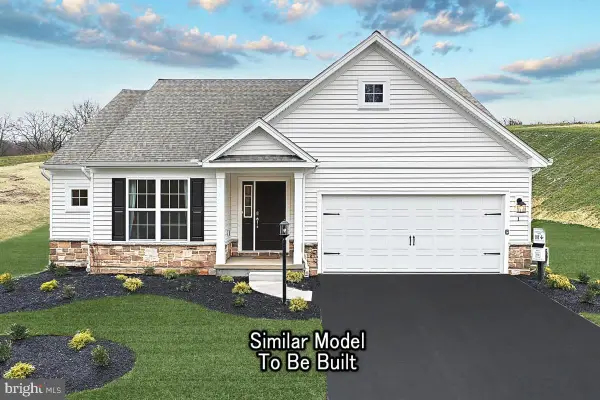 $409,990Active3 beds 2 baths1,662 sq. ft.
Abbey Plan At Woodlynn Preserve, SELINSGROVE, PA 17870
MLS# PASY2002614Listed by: BERKS HOMES REALTY, LLC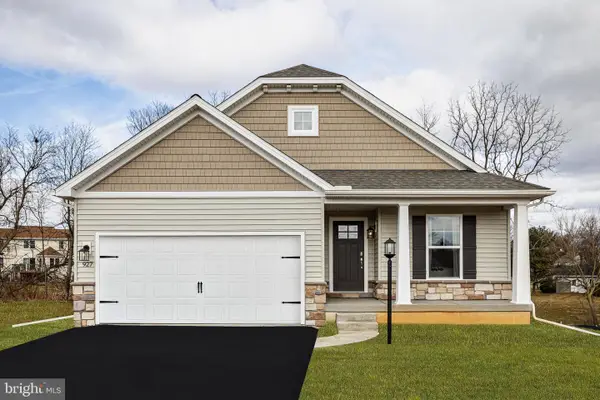 $399,990Active3 beds 2 baths1,649 sq. ft.
Adeline Floorplan At Woodlynn Preserve, SELINSGROVE, PA 17870
MLS# PASY2002616Listed by: BERKS HOMES REALTY, LLC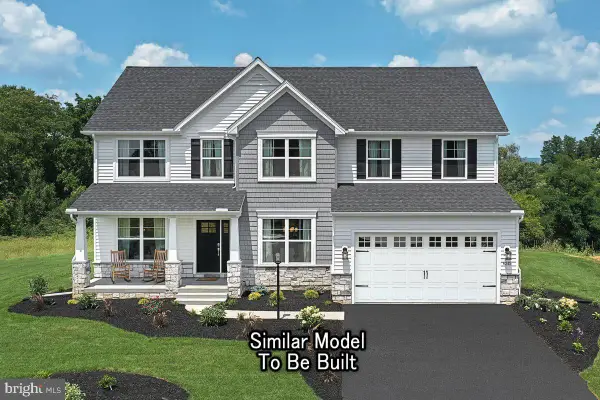 $444,990Active4 beds 3 baths2,772 sq. ft.
Beacon Pointe Plan At Woodlynn Preserve, SELINSGROVE, PA 17870
MLS# PASY2002618Listed by: BERKS HOMES REALTY, LLC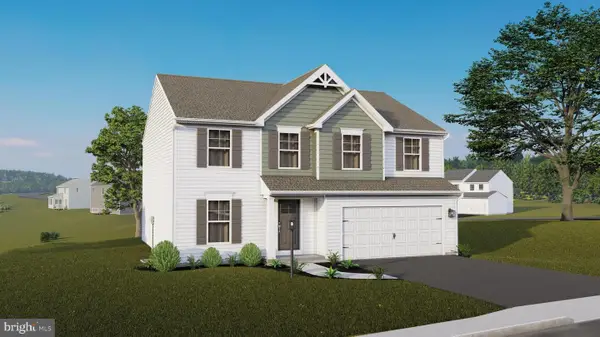 $414,990Active4 beds 3 baths2,362 sq. ft.
Black Cherry Plan At Woodlynn Preserve, SELINSGROVE, PA 17870
MLS# PASY2002620Listed by: BERKS HOMES REALTY, LLC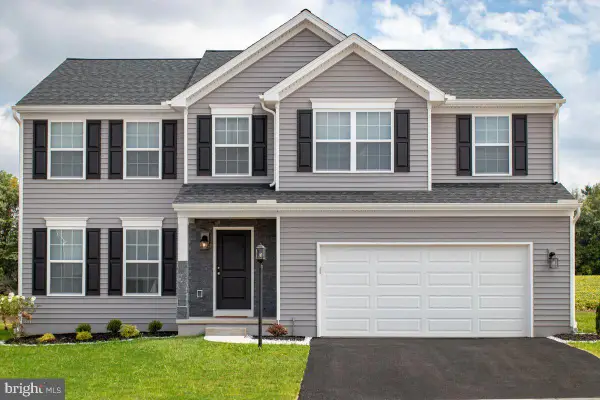 $424,990Active4 beds 3 baths2,420 sq. ft.
Blue Ridge Plan At Woodlynn Preserve, SELINSGROVE, PA 17870
MLS# PASY2002622Listed by: BERKS HOMES REALTY, LLC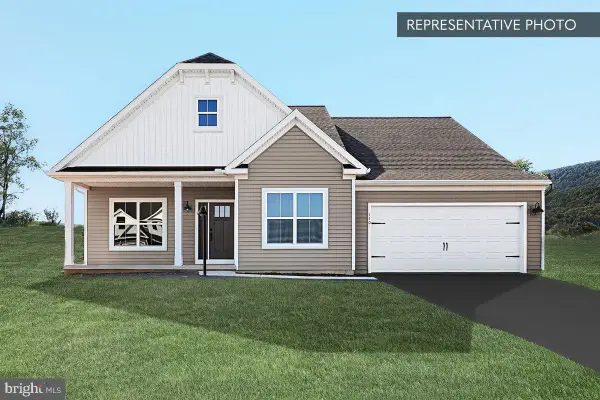 $429,990Active3 beds 2 baths1,900 sq. ft.
Juliet Plan At Woodlynn Preserve, SELINSGROVE, PA 17870
MLS# PASY2002626Listed by: BERKS HOMES REALTY, LLC $174,900Pending3 beds 1 baths1,344 sq. ft.
1849 Back Mountain Road, Beaver Springs, PA 17812
MLS# C-356Listed by: BOWEN AGENCY INC., REALTORS SELINSGROVE $259,000Active3 beds 1 baths1,596 sq. ft.
610 E Market Street, Beavertown, PA 17813
MLS# C-344Listed by: EXP REALTY, LLC $139,900Active2 beds 1 baths1,084 sq. ft.
435 Neitz Valley Rd, SELINSGROVE, PA 17870
MLS# PASY2002608Listed by: TEU REAL ESTATE CORPORATION $90,000Active1.53 Acres
506 Mill Road, Selinsgrove, PA 17870
MLS# C-308Listed by: EXP REALTY, LLC $205,000Pending4 beds 2 baths1,800 sq. ft.
550 Greenhouse Rd, MIDDLEBURG, PA 17842
MLS# PASY2002610Listed by: CAVALRY REALTY LLC $229,000Pending2 beds 1 baths960 sq. ft.
1 Belmar Avenue, Selinsgrove, PA 17870
MLS# C-290Listed by: BOWEN AGENCY INC., REALTORS SELINSGROVE $259,000Active3 beds 2 baths2,116 sq. ft.
126 S Orange Street, Beavertown, PA 17813
MLS# C-241Listed by: EXP REALTY, LLC $225,000Active7.7 Acres
7.7 AC Pa-35 Route, Mount Pleasant Mills, PA 17853
MLS# C-215Listed by: BOWEN AGENCY INC., REALTORS SELINSGROVE $479,990Pending4 beds 3 baths2,580 sq. ft.
165 Woodlynn Dr #lot 10, SELINSGROVE, PA 17870
MLS# PASY2002612Listed by: BERKS HOMES REALTY, LLC $439,990Pending4 beds 3 baths2,033 sq. ft.
164 Woodlynn Dr #lot 2, SELINSGROVE, PA 17870
MLS# PASY2002574Listed by: BERKS HOMES REALTY, LLC $409,990Active4 beds 3 baths2,174 sq. ft.
Emily Plan At Woodlynn Preserve, SELINSGROVE, PA 17870
MLS# PASY2002624Listed by: BERKS HOMES REALTY, LLC $394,990Active4 beds 3 baths1,909 sq. ft.
Revere Plan At Woodlynn Preserve, SELINSGROVE, PA 17870
MLS# PASY2002628Listed by: BERKS HOMES REALTY, LLC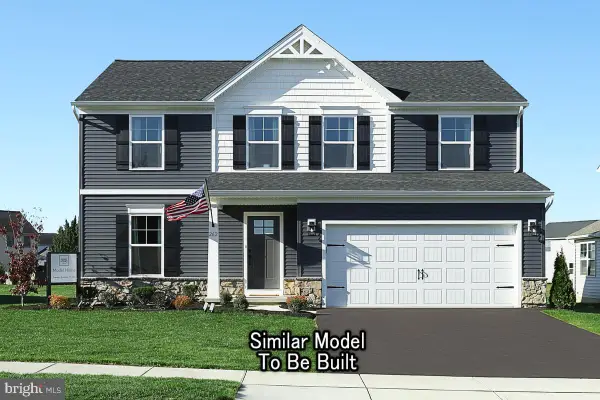 $389,990Active4 beds 3 baths2,104 sq. ft.
White Oak Plan At Woodlynn Preserve, SELINSGROVE, PA 17870
MLS# PASY2002630Listed by: BERKS HOMES REALTY, LLC $245,000Pending3 beds 1 baths1,594 sq. ft.
2 E New Market St, FREEBURG, PA 17827
MLS# PASY2002564Listed by: JACK GAUGHEN NETWORK SERVICES HOWER & ASSOCIATES $179,000Active11.99 Acres
8781 Route 235, BEAVERTOWN, PA 17813
MLS# PASY2002562Listed by: BEILER-CAMPBELL REALTORS-QUARRYVILLE $425,000Active4 beds 3 baths2,704 sq. ft.
211 W Pine Street, Selinsgrove, PA 17870
MLS# 20-102119Listed by: EXP REALTY, LLC $475,000Pending5 beds 4 baths3,040 sq. ft.
7848 Route 104, MOUNT PLEASANT MILLS, PA 17853
MLS# PASY2002550Listed by: KELLER WILLIAMS OF CENTRAL PA $130,000Pending2 beds 1 baths980 sq. ft.
4953 Creek Road, Beavertown, PA 17813
MLS# 20-102086Listed by: EXP REALTY, LLC $919,000Active6 beds 6 baths6,327 sq. ft.
1105 Red Hill Rd, PORT TREVORTON, PA 17864
MLS# PASY2002554Listed by: EXP REALTY, LLC $539,900Active13 beds 10 baths3,744 sq. ft.
3095 Turkey Valley Rd, MOUNT PLEASANT MILLS, PA 17853
MLS# PAJT2012646Listed by: GREEN ACRES REALTY COMPANY $165,000Active5 beds 2 baths1,960 sq. ft.
9400 Pa-35, Mount Pleasant Mills, PA 17853
MLS# 20-102034Listed by: EXP REALTY, LLC $199,900Active2 beds 1 baths1,144 sq. ft.
656 Snyder Ave, BEAVER SPRINGS, PA 17812
MLS# PASY2002546Listed by: IRON VALLEY REAL ESTATE MID PENN $299,000Pending52 Acres
00 S Market Street, Selinsgrove, PA 17870
MLS# 20-101998Listed by: BEILER-CAMPBELL REALTORS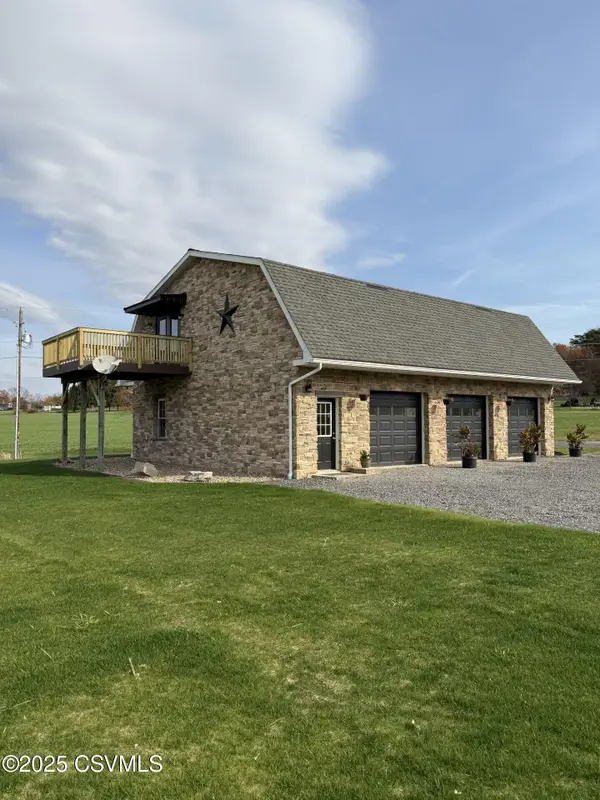 $398,500Pending2 beds 2 baths1,496 sq. ft.
37 Horseshoe Bend Road, Middleburg, PA 17842
MLS# 20-101941Listed by: VILLAGER REALTY, INC. - NORTHUMBERLAND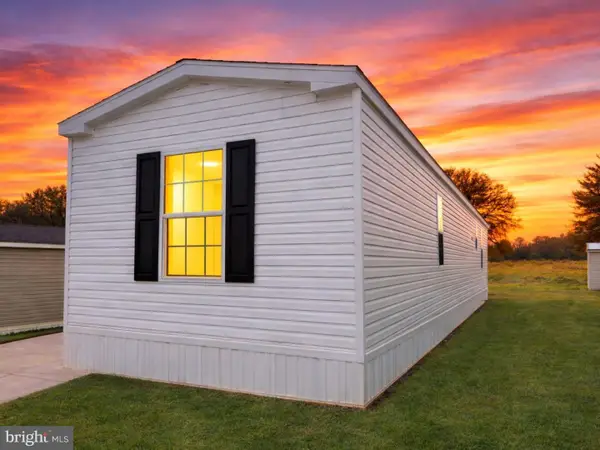 $74,999Active3 beds 2 baths880 sq. ft.
12 Minton Dr, SELINSGROVE, PA 17870
MLS# PASY2002632Listed by: LIME HOUSE $20,000Active0.35 Acres
237 S Thomas Street, Beavertown, PA 17813
MLS# 20-101940Listed by: EXP REALTY, LLC $179,900Active3 beds 1 baths1,298 sq. ft.
107 E Church St, FREEBURG, PA 17827
MLS# PASY2002538Listed by: IRON VALLEY REAL ESTATE OF CENTRAL PA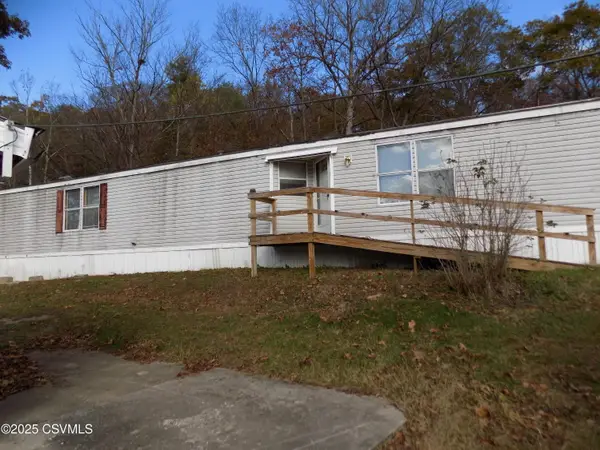 $100,000Pending3 beds 2 baths1,120 sq. ft.
6116 Route 104, Mount Pleasant Mills, PA 17853
MLS# 20-101856Listed by: RE/MAX BRIDGES $309,900Pending3 beds 2 baths1,744 sq. ft.
12825 Route 104, Middleburg, PA 17842
MLS# 20-101838Listed by: VILLAGER REALTY, INC. - NORTHUMBERLAND $300,000Pending83.06 Acres
00 Smalsh Barrick Rd #3 Parcel, MIDDLEBURG, PA 17842
MLS# PASY2002512Listed by: BEILER-CAMPBELL REALTORS-QUARRYVILLE $125,000Active2 beds 2 baths1,568 sq. ft.
5 Runyan Road, Selinsgrove, PA 17870
MLS# 20-101634Listed by: EXP REALTY, LLC $985,500Active6 beds 6 baths7,157 sq. ft.
1164 Grangers Rd, SELINSGROVE, PA 17870
MLS# PASY2002498Listed by: IRON VALLEY REAL ESTATE OF CENTRAL PA $189,000Active11.99 Acres
8791 Pa State 235 Route, Beavertown, PA 17813
MLS# 20-101426Listed by: BEILER-CAMPBELL REALTORS $45,000Active9.05 Acres
Route 522, BEAVER SPRINGS, PA 17812
MLS# PASY2002458Listed by: COLDWELL BANKER REALTY $180,000Pending6 beds 4 baths2,590 sq. ft.
3266-3268 N Old Trail, Shamokin Dam, PA 17876
MLS# 20-101207Listed by: IRON VALLEY REAL ESTATE MID PENN $600,000Pending9.86 Acres
0 Mill, SELINSGROVE, PA 17870
MLS# PASY2002450Listed by: BOWEN AGENCY, INC. $79,900Active2.34 Acres
387 Neitz Valley Road, Selinsgrove, PA 17870
MLS# 20-100716Listed by: SQUARE DIEHL REALTY INC $59,900Pending3 beds 2 baths1,508 sq. ft.
77 Spring St, BEAVER SPRINGS, PA 17812
MLS# PASY2002418Listed by: RE/MAX 1ST ADVANTAGE $59,900Active0.4 Acres
137 St Johns Street, Mount Pleasant Mills, PA 17853
MLS# 20-100594Listed by: EXP REALTY, LLC $80,000Active0.75 Acres
2103 N Susquehanna Trail, Selinsgrove, PA 17870
MLS# 20-100458Listed by: BOWEN AGENCY INC., REALTORS - LEWISBURG $600,000Pending9.86 Acres
Mill Road, Selinsgrove, PA 17870
MLS# 20-98742Listed by: BOWEN AGENCY INC., REALTORS - LEWISBURG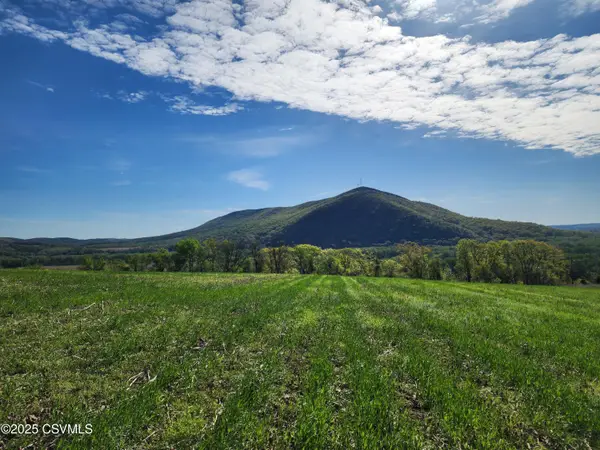 $299,000Active8.08 Acres
Roosters Road, Port Trevorton, PA 17864
MLS# 20-100190Listed by: RE/MAX BRIDGES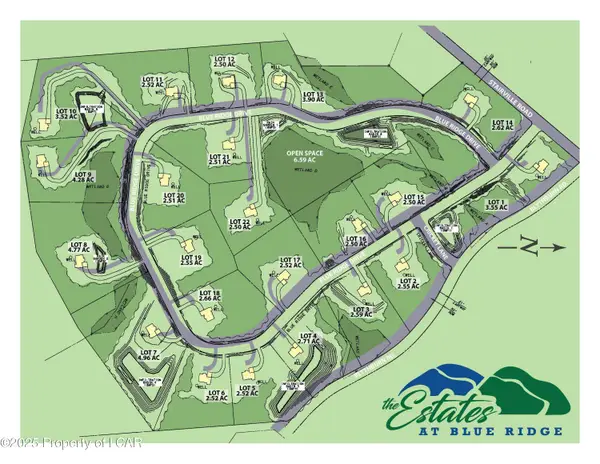 $179,000Active2.5 Acres
253 Estates Drive (lot 22), Mountain Top, PA 18707
MLS# 25-1935Listed by: CLASSIC PROPERTIES - MOUNTAINTOP $173,000Active2.52 Acres
163 Estates Drive (lot 17), Mountain Top, PA 18707
MLS# 25-1929Listed by: CLASSIC PROPERTIES - MOUNTAINTOP $59,900Active2.05 Acres
LOT 1 Church Road, Middleburg, PA 17842
MLS# 20-89204Listed by: BOWEN AGENCY INC., REALTORS SELINSGROVE $59,900Active2.51 Acres
LOT 2 Church Road, Middleburg, PA 17842
MLS# 20-89206Listed by: BOWEN AGENCY INC., REALTORS SELINSGROVE $29,000Active0.29 Acres
134 High Lot 54 Street, Beavertown, PA 17813
MLS# 20-93226Listed by: RE/MAX BRIDGES $27,000Active0.28 Acres
154 High Lot 53 Street, Beavertown, PA 17813
MLS# 20-93228Listed by: RE/MAX BRIDGES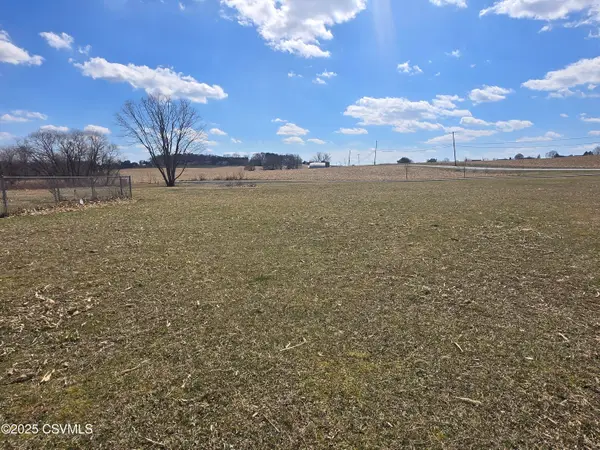 $79,900Active0.93 Acres
33 Grand Oak Lane, Selinsgrove, PA 17870
MLS# C-589Listed by: COLDWELL BANKER PENN ONE REAL ESTATE $275,000Active1.53 Acres
Lot 1 522 Rte S, SELINSGROVE, PA 17870
MLS# PASY2002314Listed by: BOWEN AGENCY, INC. $215,000Pending4 beds 2 baths1,052 sq. ft.
9 Walnut Ridge Estate, Middleburg, PA 17842
MLS# 20-101386Listed by: RE/MAX BRIDGES $400,000Active7.88 Acres
Roosevelt Avenue, Selinsgrove, PA 17870
MLS# 20-98739Listed by: BOWEN AGENCY INC., REALTORS - LEWISBURG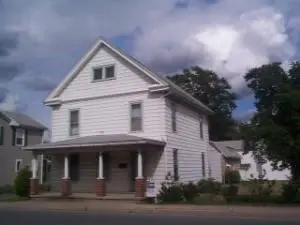 $89,500Pending2 beds 2 baths1,750 sq. ft.
625 N Market Street, Selinsgrove, PA 17870
MLS# WB-43599Listed by: COLDWELL BANKER PENN ONE REAL $489,000Pending4 beds 3 baths1,972 sq. ft.
594 Augusta Dr, SELINSGROVE, PA 17870
MLS# PASY2002250Listed by: BOWEN AGENCY, INC. $347,900Active3 beds 3 baths1,498 sq. ft.
86 Limerick Ln, SELINSGROVE, PA 17870
MLS# PASY2000898Listed by: BOWEN AGENCY, INC. $347,900Active3 beds 3 baths1,498 sq. ft.
88 Limerick Ln, SELINSGROVE, PA 17870
MLS# PASY2000896Listed by: BOWEN AGENCY, INC. $361,900Active3 beds 3 baths1,498 sq. ft.
90 Limerick Ln, SELINSGROVE, PA 17870
MLS# PASY2000894Listed by: BOWEN AGENCY, INC. $392,900Active2 beds 2 baths1,559 sq. ft.
81 St Andrews Way, SELINSGROVE, PA 17870
MLS# PASY2000852Listed by: BOWEN AGENCY, INC. $392,900Active2 beds 2 baths1,559 sq. ft.
79 St Andrews Way, SELINSGROVE, PA 17870
MLS# PASY2000850Listed by: BOWEN AGENCY, INC.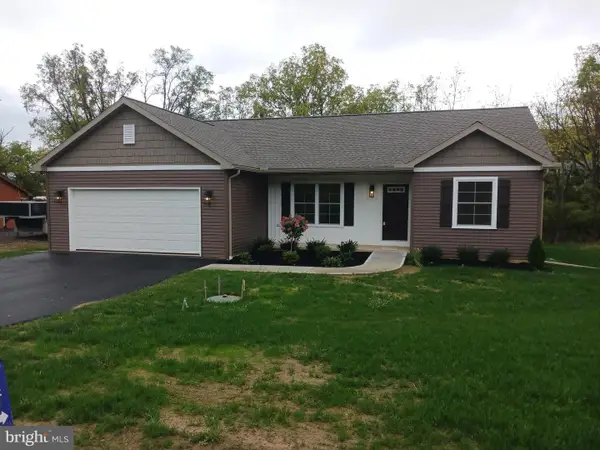 $376,900Active3 beds 2 baths1,302 sq. ft.
85 Old Colony Rd, SELINSGROVE, PA 17870
MLS# PASY2000814Listed by: BOWEN AGENCY, INC. $33,000Active0.34 Acres
235 Middleswarth St., Lot 27 Street, Beavertown, PA 17813
MLS# 20-93222Listed by: RE/MAX BRIDGES $36,000Pending0.49 Acres
155 High Lot 58 Street, Beavertown, PA 17813
MLS# 20-93229Listed by: RE/MAX BRIDGES $33,000Active0.34 Acres
214 Middleswarth St., Lot 22 Street, Beavertown, PA 17813
MLS# 20-93213Listed by: RE/MAX BRIDGES $33,000Active0.34 Acres
215 Middleswarth, Lot 23 Street, Beavertown, PA 17813
MLS# 20-93214Listed by: RE/MAX BRIDGES $29,000Pending0.34 Acres
254 Hahn, Lot 24 Street, Beavertown, PA 17813
MLS# 20-93223Listed by: RE/MAX BRIDGES $33,000Active0.34 Acres
255 Middleswarth, Lot 31 Street, Beavertown, PA 17813
MLS# 20-93224Listed by: RE/MAX BRIDGES $27,000Active0.28 Acres
114 High Lot 55 Street, Beavertown, PA 17813
MLS# 20-93225Listed by: RE/MAX BRIDGES $33,000Active0.34 Acres
368 Hahn St., Lot 42 Street, Beavertown, PA 17813
MLS# 20-93238Listed by: RE/MAX BRIDGES $33,000Active0.34 Acres
388 Hahn Lot 46 Street, Beavertown, PA 17813
MLS# 20-93239Listed by: RE/MAX BRIDGES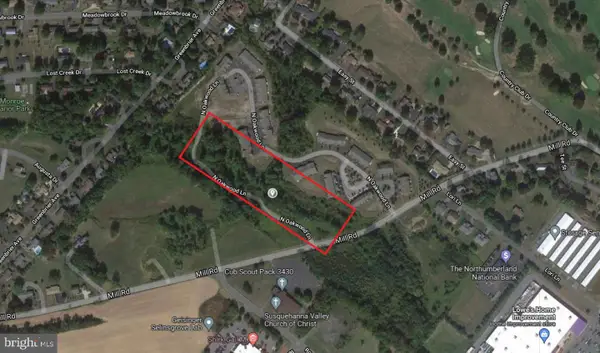 $300,000Active8.75 Acres
Phase 4 Oakwood Grove, SELINSGROVE, PA 17870
MLS# PASY2000144Listed by: RSR, REALTORS, LLC
Local realty services provided by:CENTURY 21 Jackson Real Estate, CENTURY 21 Betty Steinbacher Real Estate, CENTURY 21 Select Group, CENTURY 21 The Real Estate Store
Popular searches near Snyder County, PA
Popular neighborhoods near Snyder County, PA
- Capitol Area, Harrisburg homes for sale
- Center City, Pottsville homes for sale
- Dover, Dover homes for sale
- Downtown, Harrisburg homes for sale
- Fishbach, Pottsville homes for sale
- Greenwood Hill, Pottsville homes for sale
- Harrisburg East, Harrisburg homes for sale
- Marlin, Pottsville homes for sale
- Midtown, Harrisburg homes for sale
- Midtown Square, Harrisburg homes for sale
- Mount Hope, Pottsville homes for sale
- Oak Hills, Middletown homes for sale
- Old Fox Ridge, Harrisburg homes for sale
- Quinntown, Pottsville homes for sale
- Riverfront, Harrisburg homes for sale
- Riverside United Neighbors, Harrisburg homes for sale
- Shipoke, Harrisburg homes for sale
- Southern Harrisburg, Harrisburg homes for sale
- Uptown, Harrisburg homes for sale
- Yorkville, Pottsville homes for sale
Zip codes near Snyder County, PA
- 17045 homes for sale
- 17049 homes for sale
- 17059 homes for sale
- 17061 homes for sale
- 17062 homes for sale
- 17094 homes for sale
- 17812 homes for sale
- 17813 homes for sale
- 17830 homes for sale
- 17837 homes for sale
- 17841 homes for sale
- 17842 homes for sale
- 17844 homes for sale
- 17845 homes for sale
- 17853 homes for sale
- 17855 homes for sale
- 17864 homes for sale
- 17870 homes for sale
- 17876 homes for sale
- 17889 homes for sale
Protect your home and budget from life's surprises with an Assurant Home Warranty, backed by a partner that supports you through every step of homeownership. Explore Plans.
©2026 Century 21 Real Estate LLC. All rights reserved. CENTURY 21®, the CENTURY 21 Logo and C21® are service marks owned by Century 21 Real Estate LLC. Century 21 Real Estate LLC fully supports the principles of the Fair Housing Act and the Equal Opportunity Act. Each office is independently owned and operated. Listing information is deemed reliable but not guaranteed accurate.